
HIVE
Hive
| تریدر | نوع سیگنال | حد سود/ضرر | زمان انتشار | مشاهده پیام |
|---|---|---|---|---|
No results found. | ||||
Price Chart of Hive
سود 3 Months :
سیگنالهای Hive
Filter
Sort messages by
Trader Type
Time Frame
HIVEUSD LONG

Hiveusd might bounce from this zone as it has accumulated liquidity above it and grabbed it also

VIPCryptoVault
تحلیل تکنیکال HIVE: پایان روند نزولی قوی و اهداف صعودی جدید!
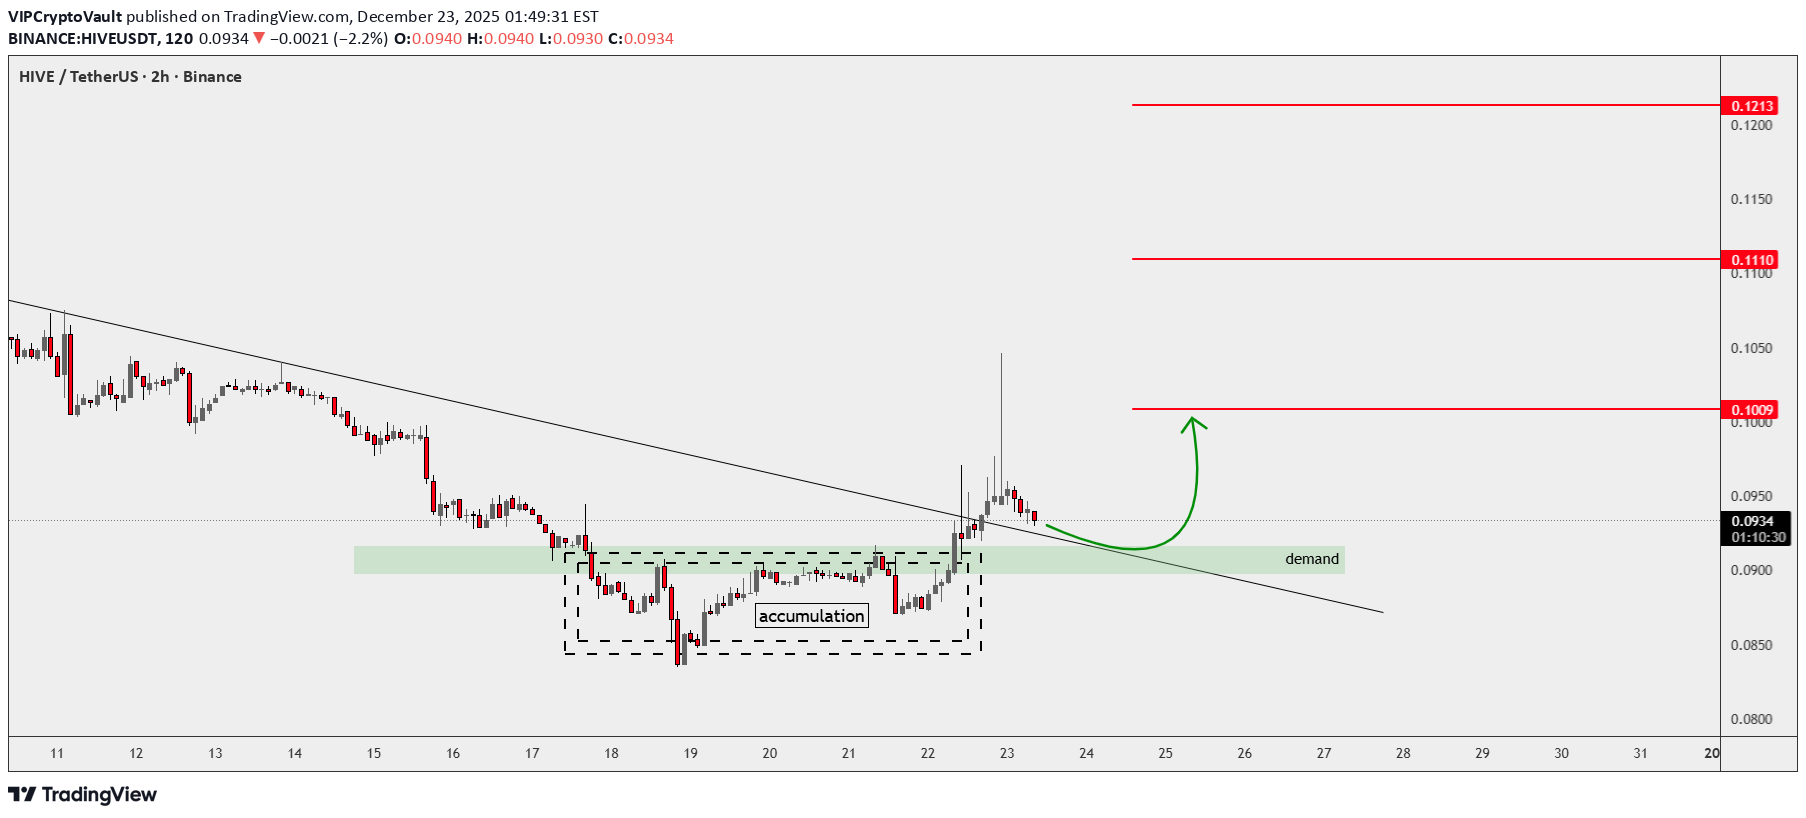
Hello traders, As we can see, HIVE managed to break a strong downtrend line with a clear break of structure. Price structure has started forming a bullish trend with quiet accumulation. Now it is ready for a push to the indicated targets after a pullback to demand zone $0.1000 $0.1110 $0.1210 Good Luck!

Bithereum_io

Alpha-GoldFX
HIVEUSDT Forming Falling Wedge
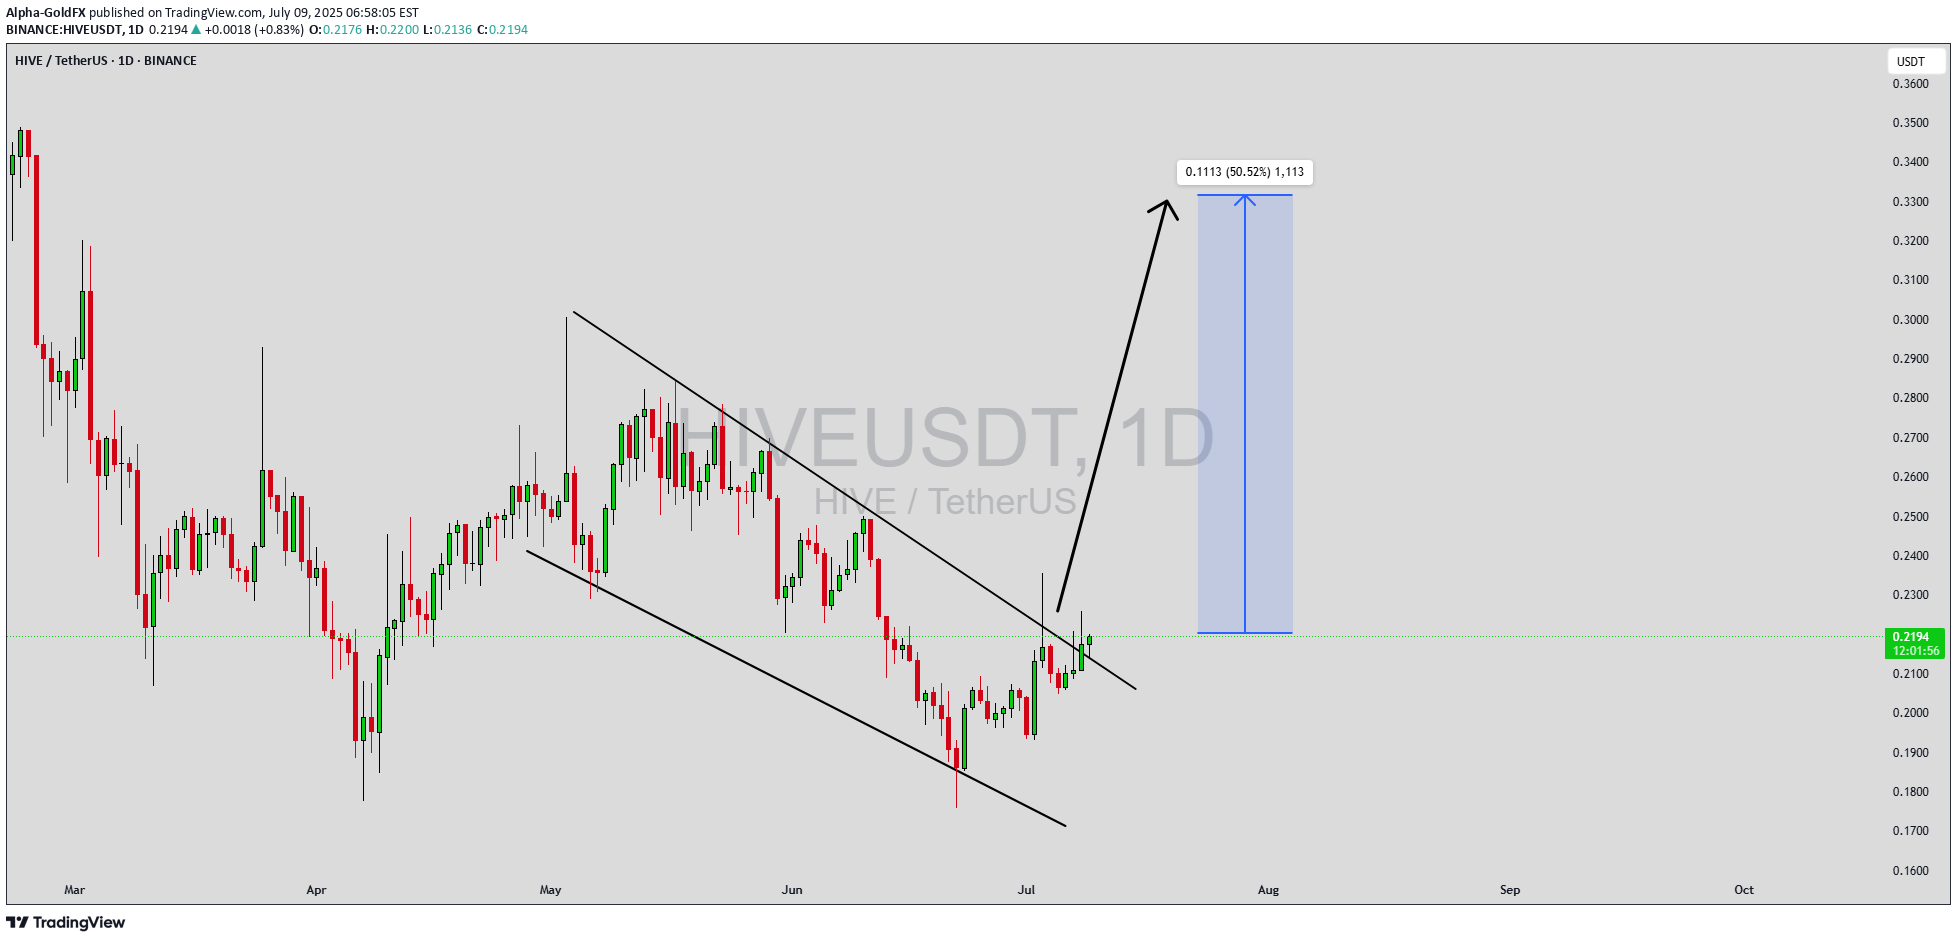
HIVEUSDT is starting to attract notable attention from traders and investors who are seeking solid opportunities in the altcoin space. With good volume backing recent price movements, HIVE appears to be consolidating in a healthy range that could soon give way to an upward breakout. The project’s fundamentals, combined with its strong community engagement, make it an interesting prospect for short- to medium-term gains. Analysts are eyeing a potential price rally of around 40% to 50%+ if market sentiment remains supportive.One of the key reasons behind the growing interest in HIVE is its consistent development activity and use case within the decentralized social media and content creation space. As blockchain-based social networks gain momentum, HIVE stands out as a pioneer with an active user base and proven on-chain activity. This makes it a compelling option for investors who want exposure to utility-driven tokens with tangible adoption.On the technical side, traders should watch for breakouts above significant resistance levels and monitor how volume behaves during these moves. A strong surge in buying activity could confirm that bullish momentum is taking over, offering an attractive risk-reward setup. With the broader crypto market showing signs of recovery, HIVE’s setup looks promising for traders looking to capture gains in the coming weeks.✅ Show your support by hitting the like button and✅ Leaving a comment below! (What is You opinion about this Coin)Your feedback and engagement keep me inspired to share more insightful market analysis with you!

MasterAnanda
HIVE: When To, How To?

I've been tracking HIVE for a while and now I want to show it to you, it will be a good money maker if you decide to "jump in." Let's go back to some basics signals.HIVEUSDT Technical AnalysisIn August 2024 we have the main low and subsequent higher low in November. In 2025 we have a long-term higher low, April & June and also a double-bottom. That's the classic.The higher low points to a higher high for the new bullish wave that will develop in the coming days and weeks; the double-bottom points to the low being in and current prices being good for a trade setup with low risk vs a high potential for reward.When to sellI have a friend and he is a scientist, he asked, "Hey Alan, when should I sell? Should I go for 400% or 660%?" It is always the same question.I said, "You can do whatever you want of course..." He wasn't satisfied. Imagine, the scientific mind. "Yes, but how do I know if the right target is the one where you placed 400% or the 660%?" He said. You know, the scientific mind is never satisfied unless supplied with specific answers."Well..." I am preparing myself to give a reply that will require no additional questions. "How you approach the targets will fully depend on your trading style, that is, your goals, your capital, your risk tolerance and how confident you feel about my analysis, the targets and the chart.""What?" Listen, you just buy and hold and contact me after three months. You'll know what to do when prices are up... Just kidding of course.Namaste.

CryptoNuclear

MasterAnanda
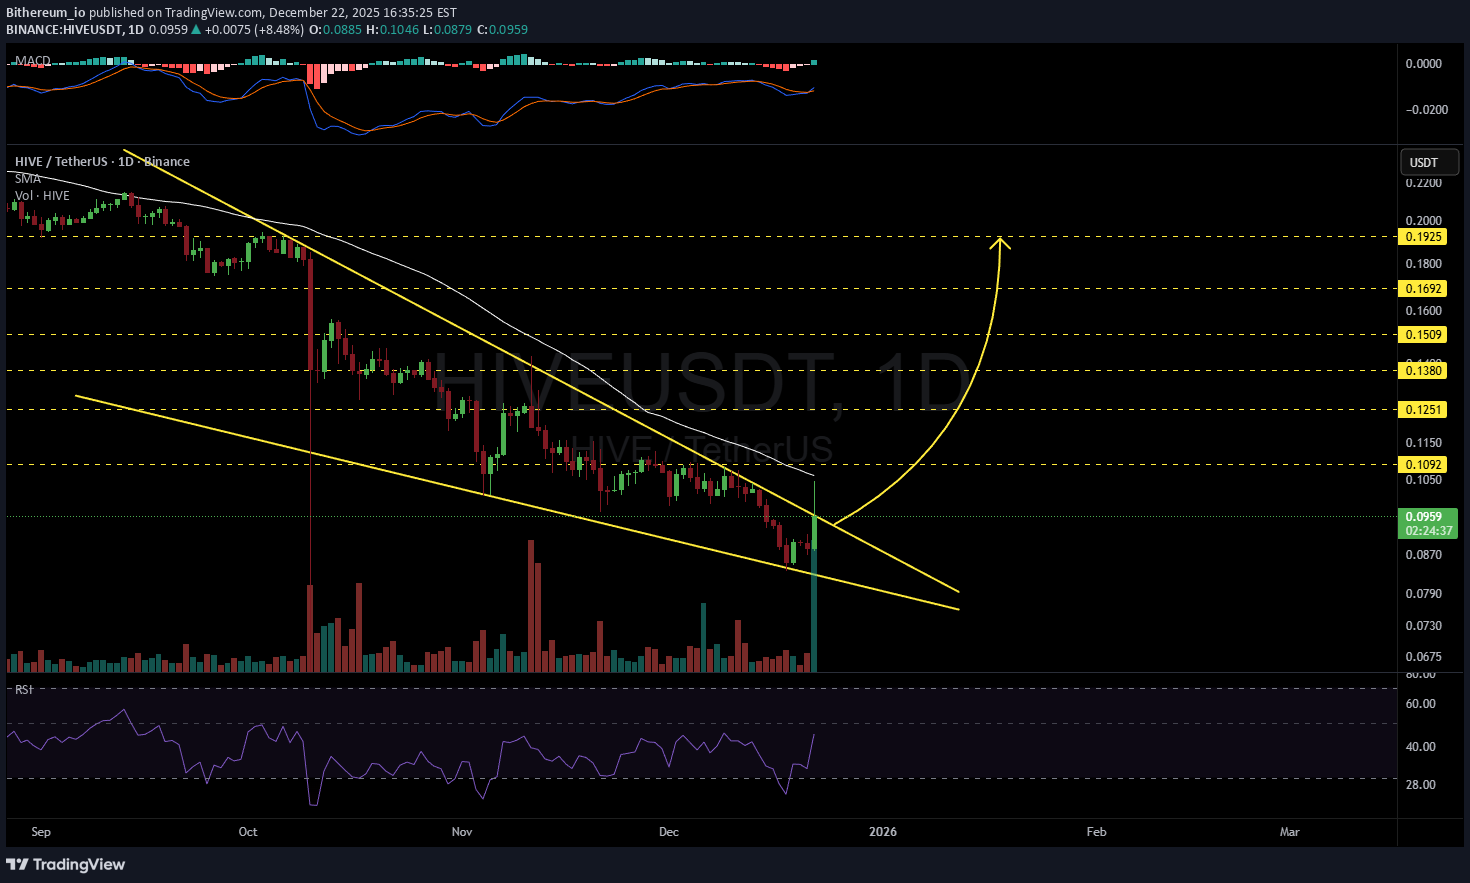
Hive Breaks Above Resistance, Easy 190% Jump In The Making

I don't have to describe the signals because it is already happening, the results will speak for themselves.I have to describe the signals because we cannot post a chart without adding some text. So some times you will see me writing just to meet the requirements but I would just love to say, "It is going up."Sometimes no words can give a stronger message than too many words, but the rules say that we have to write so, here we go:» HIVEUSDT is trading within a long-term higher low. Long-term for me is 6 months or more for Cryptocurrency pairs, and here the main low happened in early November 2024, so this higher low can be called long-term. Of course, the second low happened recently, 7-April 2025, when the correction reached its end marketwide.» A broken downtrend, based on an internal trendline and a move above resistance is also taking place. I can guess a strong RSI and move and close above some moving averages, in this case, EMA34 has been conquered.» A nice and easy 190% bullish jump is in the making, this can happen within days or weeks, short-term. Within 30 days (one month). There will be more growth but this is for another day. This chart analysis is for those trading short-term.Namaste.

behdark
HIVE buy/long setup (4H)

Two trigger lines have been broken, and there is a bullish iCH on the chart. We have also seen a strong move, and at the origin of this move, buy/long positions can be considered.This setup is mostly suitable for spot trading.Targets are marked on the chart.The closure of a 4-hour candle below the invalidation level will invalidate this analysis.For risk management, please don't forget stop loss and capital managementWhen we reach the first target, save some profit and then change the stop to entryComment if you have any questionsThank You

esmail900149
HIVE cryptocurrency analysis from the perspective of Elliott

In my opinion, we are completing a wave and the area marked is a low-risk area to consider entering a buy trade.

UmutTrades
HIVEUSDT – Support & Resistance Levels Marked!

Time to Make Some Money – But Smartly! 🔥📊 Key Levels to Watch:🟢 Green Box = Strong Support – This is where buyers may step in.🔴 Red Box = Major Resistance – Sellers are likely waiting here.💡 The Plan:✅ At Support? – Look for LTF bullish confirmations & CDV divergence before entering long.✅ At Resistance? – Wait for LTF breakdowns & CDV confirmation for potential short plays.✅ Break & Retest? – If price breaks a level with volume, trade the retest—not the breakout itself.📌 Final Words:Patience + Confirmation = Profitable Trades. We don’t gamble, we execute!🚀 Follow me for high-probability setups—let’s get this money! 🔥✅I keep my charts clean and simple because I believe clarity leads to better decisions.✅My approach is built on years of experience and a solid track record. I don’t claim to know it all but I’m confident in my ability to spot high-probability setups.✅If you would like to learn how to use the heatmap, cumulative volume delta and volume footprint techniques that I use below to determine very accurate demand regions, you can send me a private message. I help anyone who wants it completely free of charge.🔑I have a long list of my proven technique below:🎯 ZENUSDT.P: Patience & Profitability | %230 Reaction from the Sniper Entry🐶 DOGEUSDT.P: Next Move🎨 RENDERUSDT.P: Opportunity of the Month💎 ETHUSDT.P: Where to Retrace🟢 BNBUSDT.P: Potential Surge📊 BTC Dominance: Reaction Zone🌊 WAVESUSDT.P: Demand Zone Potential🟣 UNIUSDT.P: Long-Term Trade🔵 XRPUSDT.P: Entry Zones🔗 LINKUSDT.P: Follow The River📈 BTCUSDT.P: Two Key Demand Zones🟩 POLUSDT: Bullish Momentum🌟 PENDLEUSDT.P: Where Opportunity Meets Precision🔥 BTCUSDT.P: Liquidation of Highly Leveraged Longs🌊 SOLUSDT.P: SOL's Dip - Your Opportunity🐸 1000PEPEUSDT.P: Prime Bounce Zone Unlocked🚀 ETHUSDT.P: Set to Explode - Don't Miss This Game Changer🤖 IQUSDT: Smart Plan⚡️ PONDUSDT: A Trade Not Taken Is Better Than a Losing One💼 STMXUSDT: 2 Buying Areas🐢 TURBOUSDT: Buy Zones and Buyer Presence🌍 ICPUSDT.P: Massive Upside Potential | Check the Trade Update For Seeing Results🟠 IDEXUSDT: Spot Buy Area | %26 Profit if You Trade with MSB 📌 USUALUSDT: Buyers Are Active + %70 Profit in Total🌟 FORTHUSDT: Sniper Entry +%26 Reaction🐳 QKCUSDT: Sniper Entry +%57 Reaction📊 BTC.D: Retest of Key Area Highly Likely*📊 XNOUSDT %80 Reaction with a Simple Blue Box!I stopped adding to the list because it's kinda tiring to add 5-10 charts in every move but you can check my profile and see that it goes on..
Disclaimer
Any content and materials included in Sahmeto's website and official communication channels are a compilation of personal opinions and analyses and are not binding. They do not constitute any recommendation for buying, selling, entering or exiting the stock market and cryptocurrency market. Also, all news and analyses included in the website and channels are merely republished information from official and unofficial domestic and foreign sources, and it is obvious that users of the said content are responsible for following up and ensuring the authenticity and accuracy of the materials. Therefore, while disclaiming responsibility, it is declared that the responsibility for any decision-making, action, and potential profit and loss in the capital market and cryptocurrency market lies with the trader.