
GOOGLX
GOOGLX Alphabet tokenized stock (xStock)
| تریدر | نوع سیگنال | حد سود/ضرر | زمان انتشار | مشاهده پیام |
|---|---|---|---|---|
خرید | حد سود: تعیین نشده حد ضرر: تعیین نشده | 12/12/2025 | ||
خرید | حد سود: تعیین نشده حد ضرر: تعیین نشده | 12/10/2025 | ||
 EPSMomentumRank: 1024 | خرید | حد سود: تعیین نشده حد ضرر: تعیین نشده | 11/6/2025 | |
 TopgOptionsRank: 167 | خرید | حد سود: تعیین نشده حد ضرر: تعیین نشده | 10/29/2025 |

Price Chart of GOOGLX Alphabet tokenized stock (xStock)
سود 3 Months :
سیگنالهای GOOGLX Alphabet tokenized stock (xStock)
Filter
Sort messages by
Trader Type
Time Frame

BullBearInsights
GOOGL. Plan for Dec 15
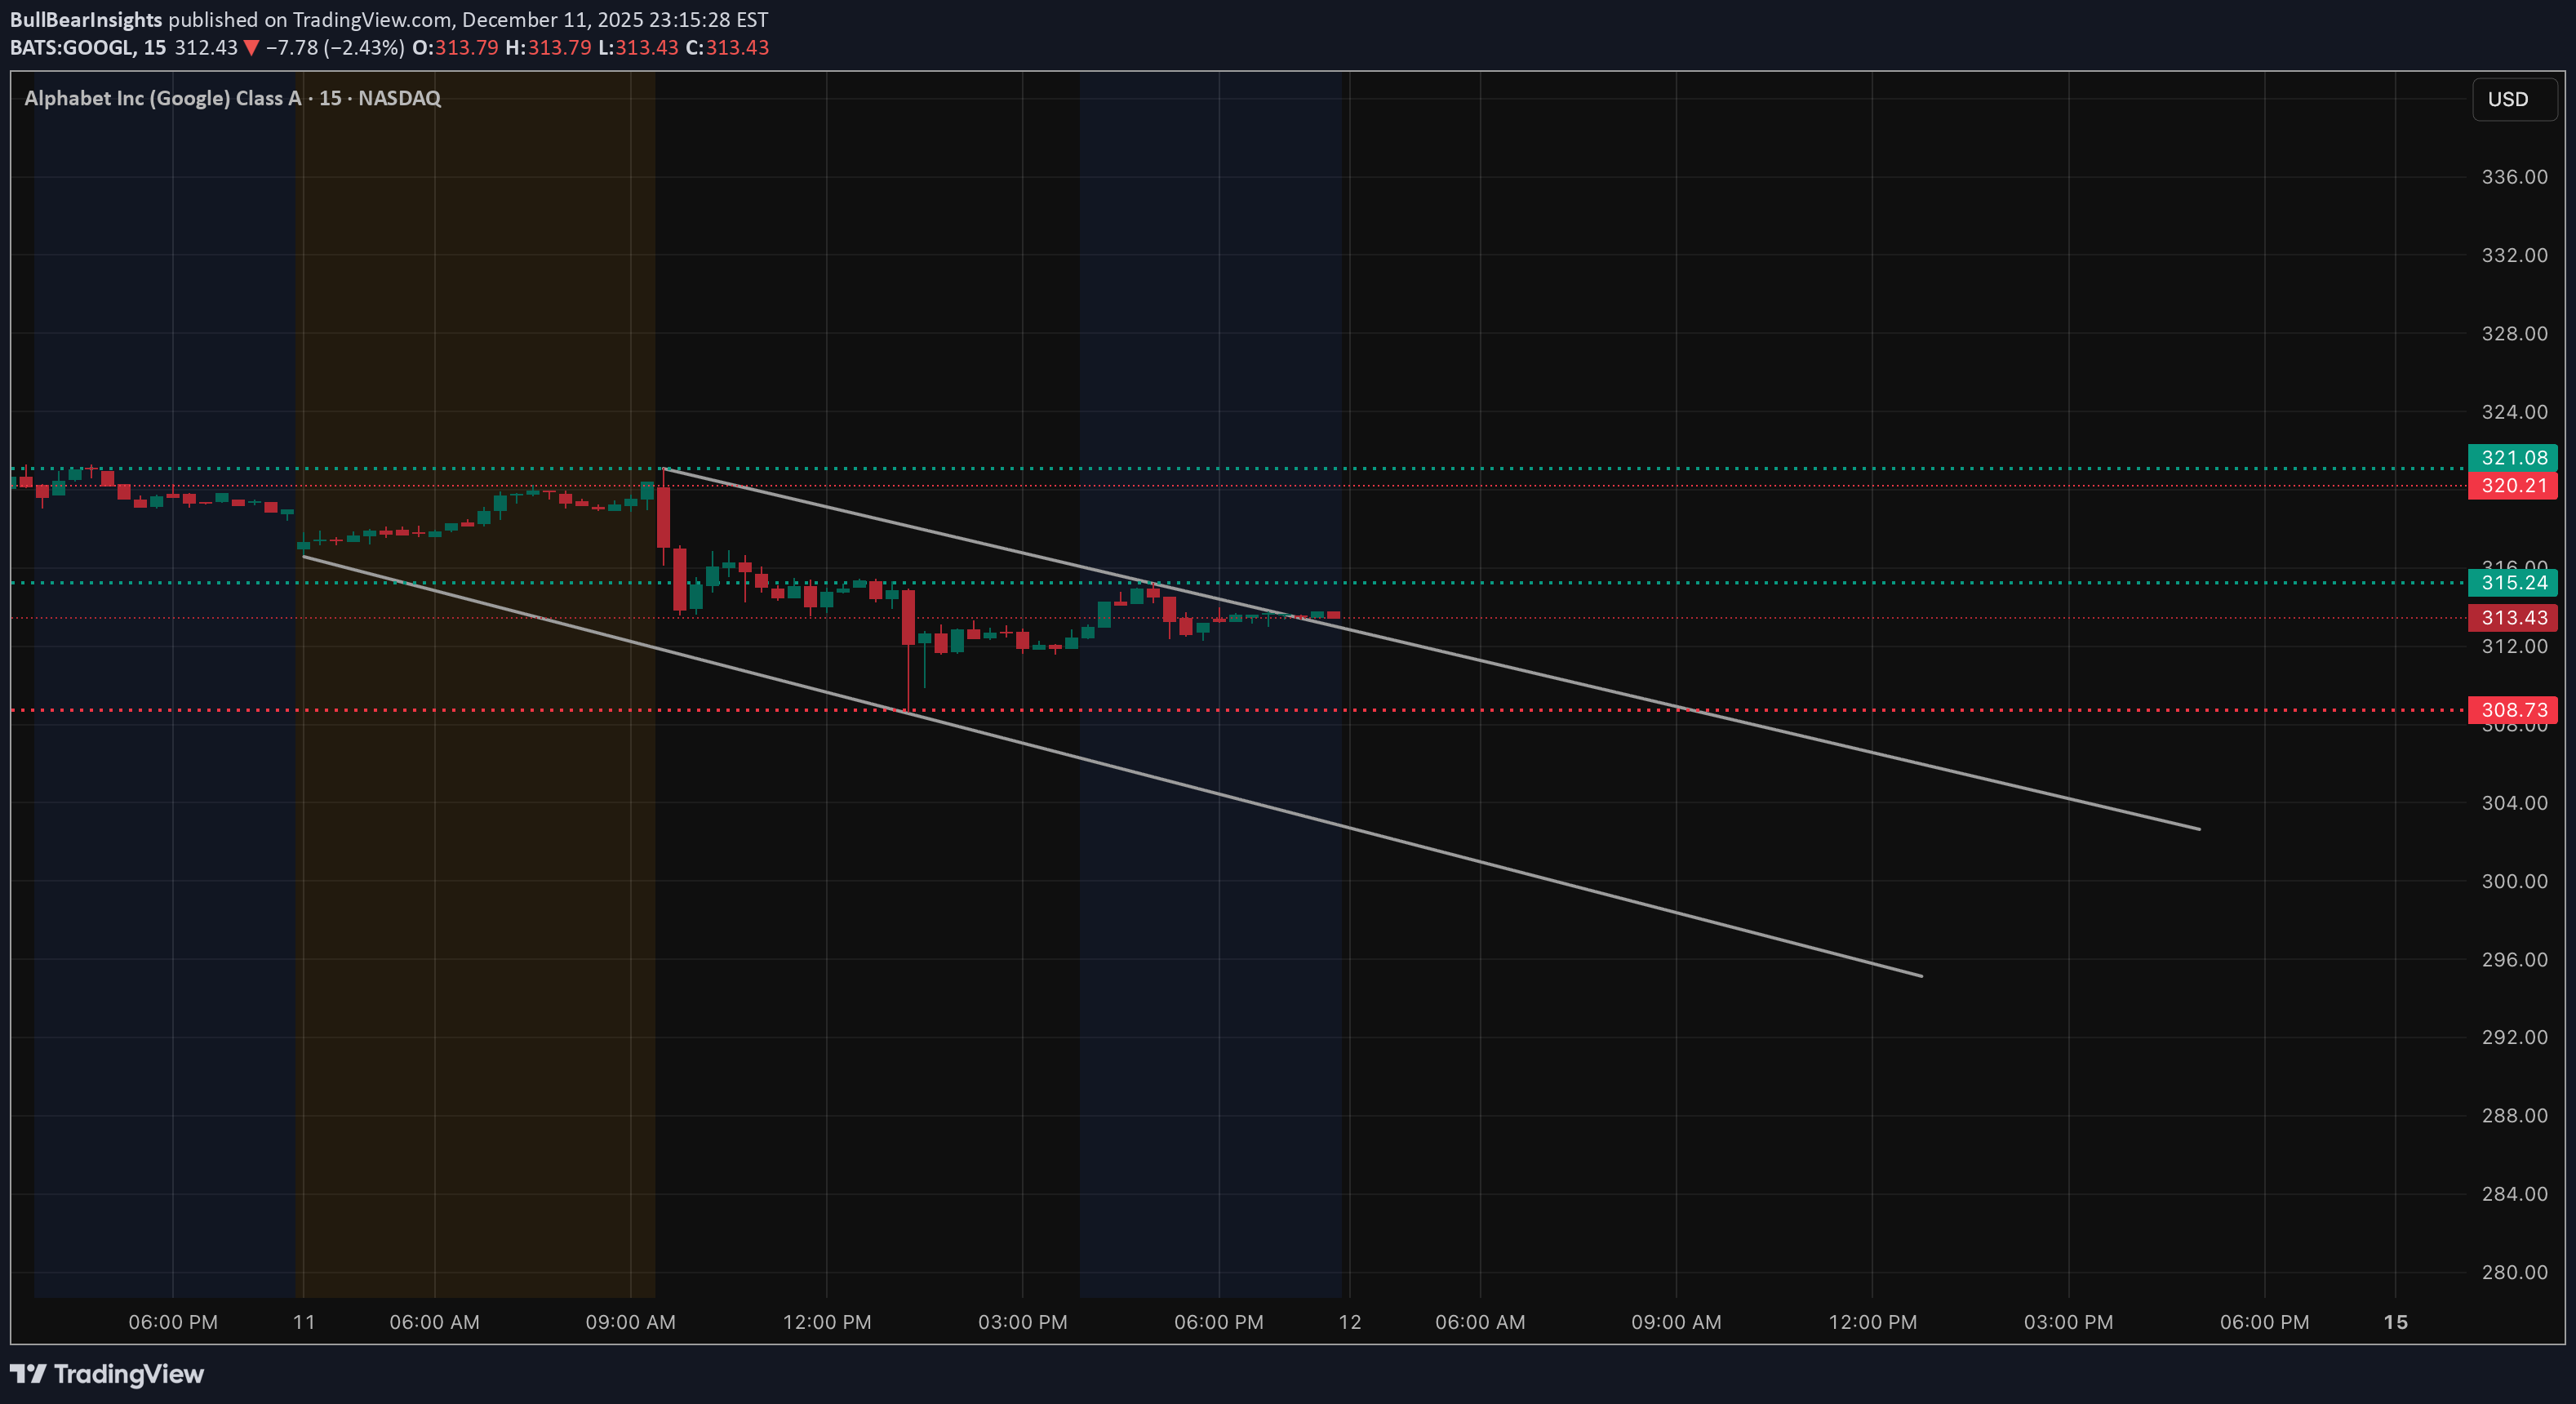
Looking at GOOGL going into Dec. 15, the chart still feels heavy, even though price has stopped falling aggressively. After the selloff, we got a bounce — but that bounce never reclaimed structure. Price broke down, tried to push back up, and stalled right where former support should turn into resistance. That’s not strength — that’s sellers letting price breathe. Right now, GOOGL is sitting around the 308–310 area, which feels more like a pause than a base. There’s no real impulsive buying, just small candles and low follow-through. This usually means the market is deciding when, not if, to make the next move. From a structure standpoint, the bearish move is still valid until proven otherwise. Levels that actually matter The first thing I’m watching is 308. If price loses 308 with any momentum, I expect a quick move into 305, and if that doesn’t hold, 302–300 becomes very realistic. Those levels line up with prior lows and unfinished business from the selloff. On the upside, 312–315 is the problem area. That zone was support before the breakdown, and now it’s acting like a ceiling. Every bounce into that area so far has been sold. If price can’t reclaim and hold above 315, upside moves are likely just short-covering, not real trend change. How GEX fits into this (not the focus, just confirmation) Options positioning lines up with what price is telling us. There’s strong PUT support around the current price, which explains why we’re chopping instead of free-falling. But above us, CALL resistance stacks up around 320 and higher, which makes upside continuation harder unless volume steps in. That’s why moves down feel faster than moves up — dealers aren’t forced to support upside right now. How I’d think about tomorrow If GOOGL opens and can’t hold above 310, I’d be cautious leaning long. A clean break below 308 is where downside momentum likely kicks in. If we open strong and reclaim 315, then I’d reassess — but until that happens, the burden of proof is on the bulls. For me, Dec. 15 is simple: * Below 308 → downside continuation likely * Between 308–315 → chop and traps * Above 315 → only then does the chart start to improve Until then, this still looks like bearish consolidation, not a reversal. Not financial advice. Just how I’m reading the chart going into the next session.

skainn
Dear Moonboys Google even is bearish on weekly lets see how this play
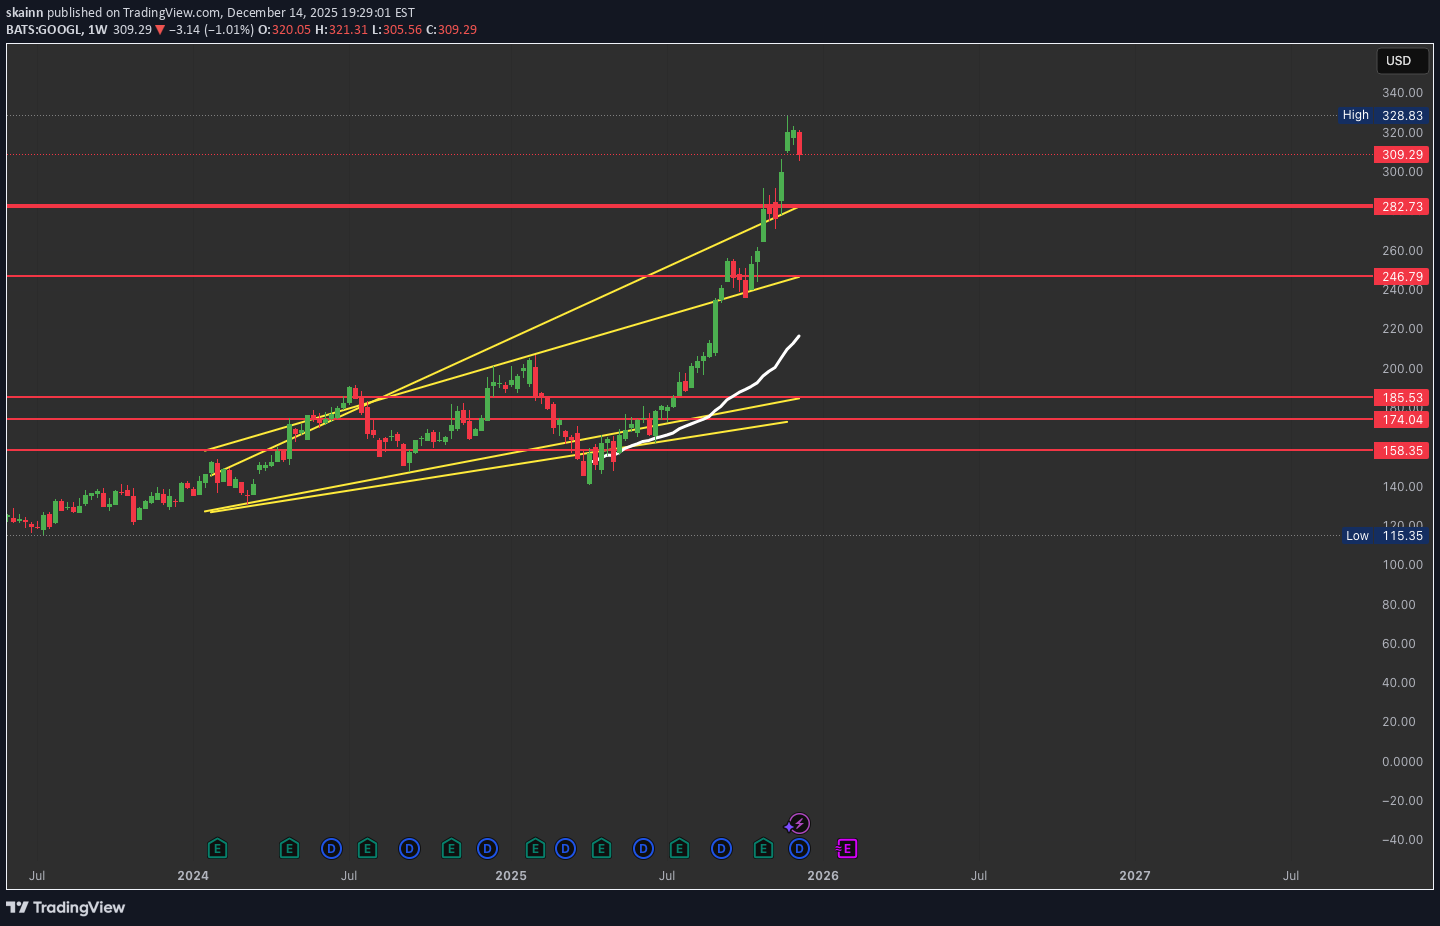
GOOGL Outlook
Quick expectations for GOOGL Buying around $276.43 - $296.62, area will most likely hold, if we even get to see it again in the near future. If we come back to $237.01 - $253.84 liquidate all you got and get GOOGL, if the macro economics permit it and we don't break down because of rate hikes or other stuff. Watch for that Santa Rally. Enjoy.

Investing in Gold: A Comprehensive Analysis
1. Why Invest in Gold? Gold offers several compelling reasons for investment. Primarily, it acts as a hedge against inflation. During periods when the purchasing power of fiat currencies declines, gold prices generally rise, preserving wealth. For example, during the 1970s, the US experienced high inflation, and gold prices surged dramatically. Additionally, gold provides protection during economic and geopolitical uncertainty. In times of financial crises, such as the 2008 global recession, investors flocked to gold as a safe-haven asset. Gold is not tied to any single country’s economy, making it a globally recognized store of value. Diversification is another key reason. Financial advisors often suggest including gold in an investment portfolio to reduce overall risk. Unlike stocks or bonds, gold has a low or negative correlation with other asset classes, which means its value can remain stable or even rise when other investments falter. 2. Forms of Gold Investment Investors can access gold through various channels, each with unique advantages and considerations: Physical Gold: This includes gold bars, coins, and jewelry. Physical gold provides tangible ownership and a psychological sense of security. However, it requires safe storage and insurance, and liquidity can sometimes be a concern. Gold ETFs (Exchange-Traded Funds): These funds track gold prices and are traded on stock exchanges. They offer a convenient and liquid way to invest without dealing with physical gold. They typically have lower transaction costs compared to buying physical gold. Gold Mutual Funds: These invest in gold mining companies or gold-related assets. They offer exposure to gold without owning it directly and can generate returns through dividends and capital appreciation. Gold Futures and Options: These are derivatives that allow investors to speculate on future gold prices. They can provide significant leverage but carry high risk, making them suitable only for experienced investors. Digital Gold: This is a modern form of investment where investors can buy gold online in small quantities. It offers convenience and security without the need for physical storage. 3. Factors Influencing Gold Prices Gold prices are influenced by a combination of macroeconomic, geopolitical, and market-specific factors. Understanding these drivers can help investors make informed decisions: Inflation and Interest Rates: Gold is often inversely related to interest rates. When real interest rates (adjusted for inflation) are low or negative, gold becomes more attractive, driving up prices. Currency Movements: Gold is priced in US dollars globally. A weaker dollar makes gold cheaper for other currency holders, often increasing demand. Conversely, a stronger dollar can suppress gold prices. Geopolitical Risks: Wars, conflicts, and political instability can increase demand for gold as a safe-haven asset. Central Bank Policies: Central banks around the world hold significant gold reserves. Changes in their buying or selling behavior can impact global prices. Supply and Demand: Gold mining production, recycling, and industrial demand (especially in jewelry and technology) influence supply and demand dynamics. 4. Benefits of Investing in Gold Investing in gold provides multiple advantages: Wealth Preservation: Gold has historically maintained its value over centuries, protecting investors from currency depreciation and economic downturns. Portfolio Diversification: It reduces overall portfolio risk due to its low correlation with stocks and bonds. Liquidity: Gold is globally recognized and can be quickly sold or exchanged for cash in most markets. Inflation Hedge: Gold tends to retain purchasing power during periods of rising prices. Safe Haven During Crises: It is considered a stable investment during financial and geopolitical turmoil. 5. Risks of Investing in Gold Despite its advantages, gold investment carries certain risks: Price Volatility: Although gold is less volatile than stocks, it can still experience short-term price fluctuations due to market sentiment or speculative activity. No Income Generation: Unlike stocks or bonds, gold does not provide dividends or interest. Returns depend solely on price appreciation. Storage and Security Concerns: Physical gold requires secure storage and insurance, which can incur additional costs. Market Timing Risk: Buying gold at a peak can result in temporary losses if prices decline before an investor exits. 6. Strategies for Investing in Gold Successful gold investment requires careful planning and strategy: Long-Term Investment: Investors seeking stability can buy and hold gold for the long term to hedge against inflation and economic uncertainty. Diversification: Allocate a portion of the portfolio to gold alongside equities, bonds, and real estate to balance risk. Many advisors recommend 5–15% of a portfolio in gold. Dollar-Cost Averaging: Buying gold in regular intervals, regardless of price, can mitigate the impact of short-term volatility. Monitoring Macroeconomic Trends: Keeping track of inflation rates, interest rates, currency movements, and geopolitical events can help in timing investments. Combining Physical and Paper Gold: A combination of physical gold for security and ETFs or mutual funds for liquidity can optimize returns while managing risks. 7. Conclusion Gold remains a timeless investment vehicle with unique advantages. It offers protection against inflation, acts as a hedge during economic and geopolitical instability, and provides diversification to investment portfolios. While gold does not generate income, its long-term value preservation and liquidity make it a preferred choice for conservative investors. Understanding the forms of gold investment, factors influencing its price, and implementing strategic approaches can help investors leverage gold effectively for wealth protection and growth. Whether through physical ownership, digital platforms, or financial instruments, gold remains an essential component of a balanced investment strategy. By carefully assessing individual financial goals, risk tolerance, and market conditions, investors can harness the enduring appeal of gold to safeguard and grow their wealth.
Here is YOUR chance Bottom Bull Flag 16-20 % Upside
16-20 % Upside 300-310 End of 7 Days Distribution Bottom Bull Flag Every single Tools Bottoms
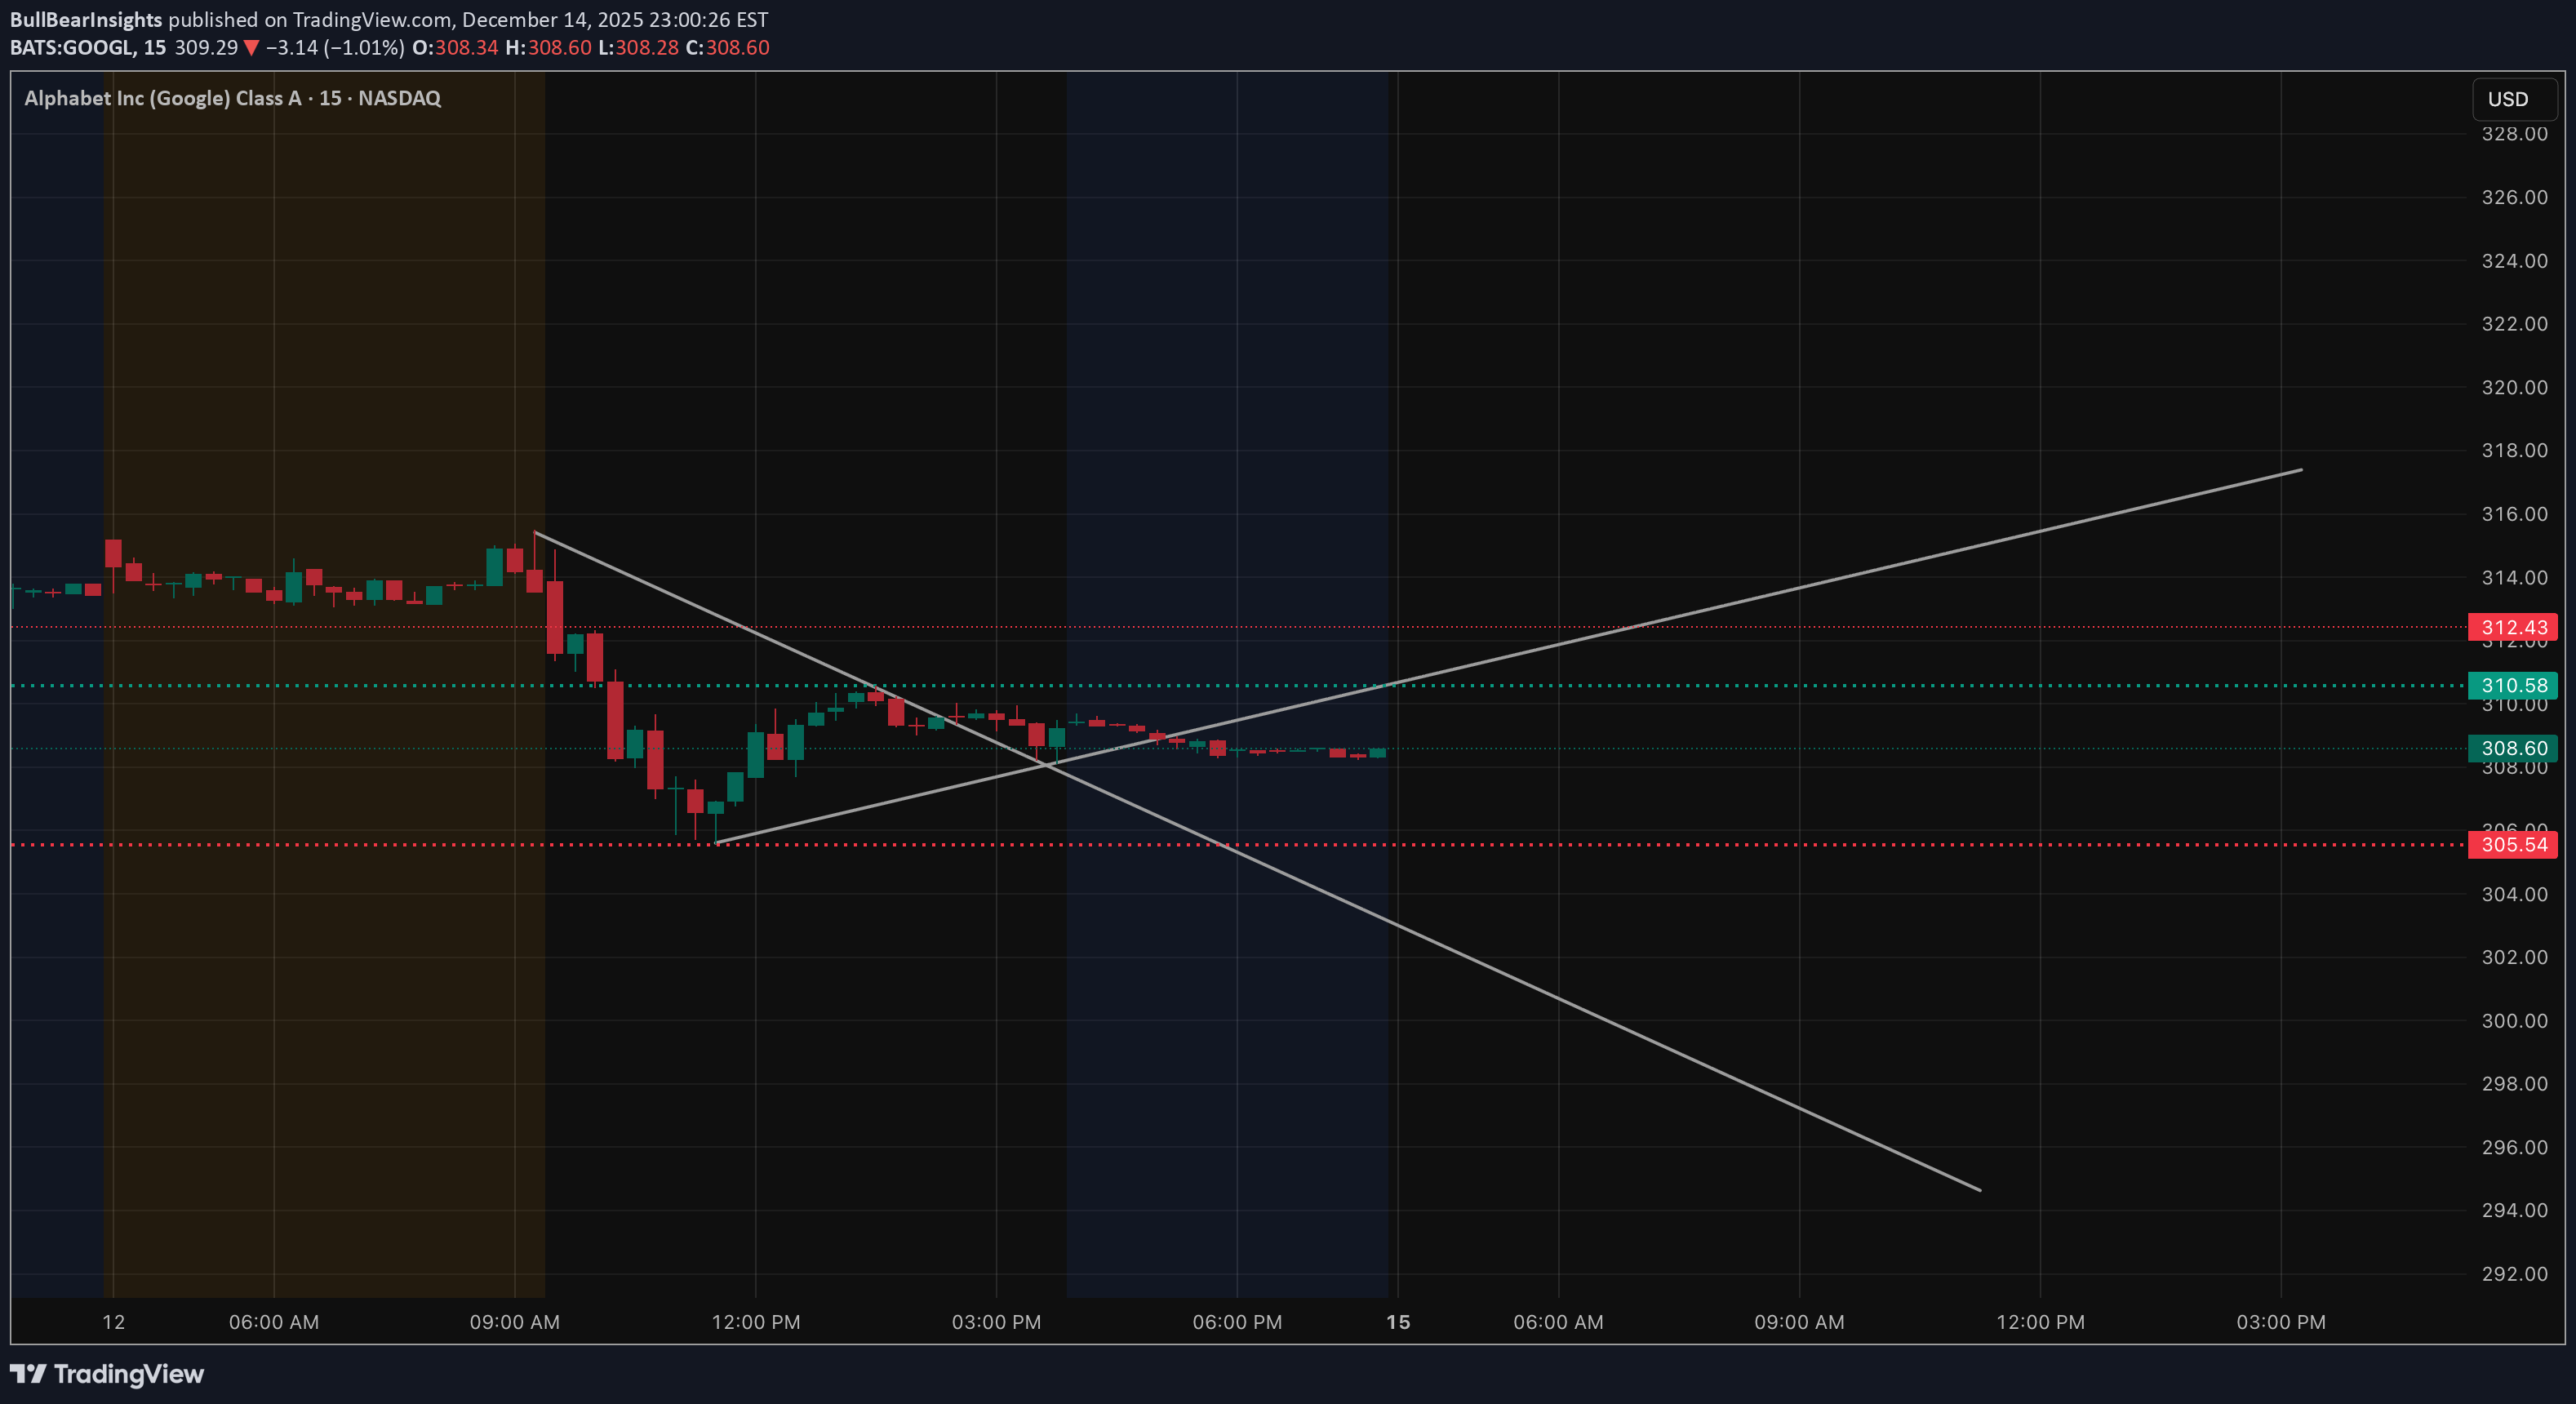
BullBearInsights
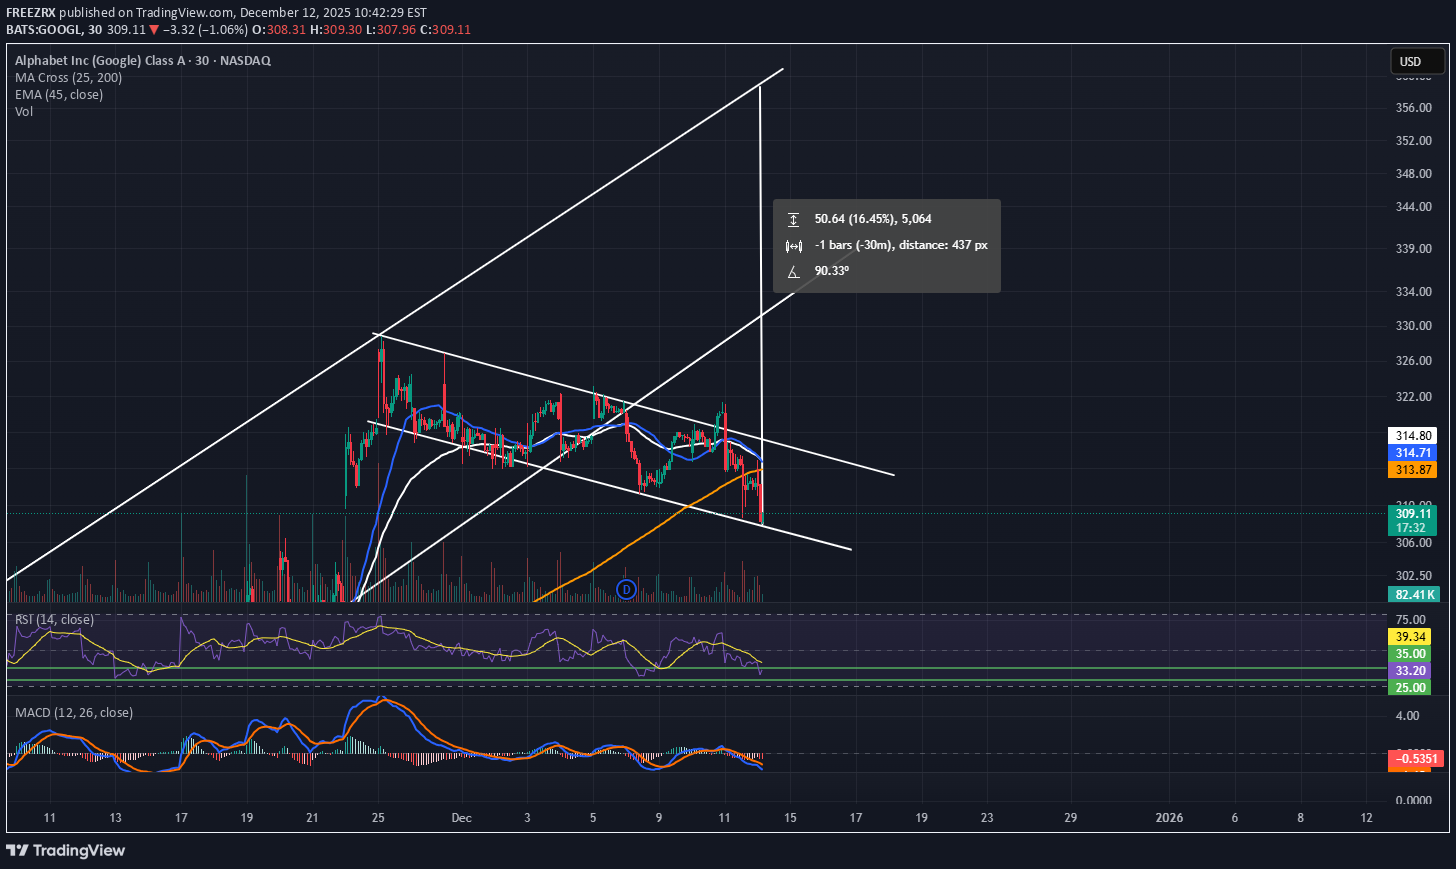
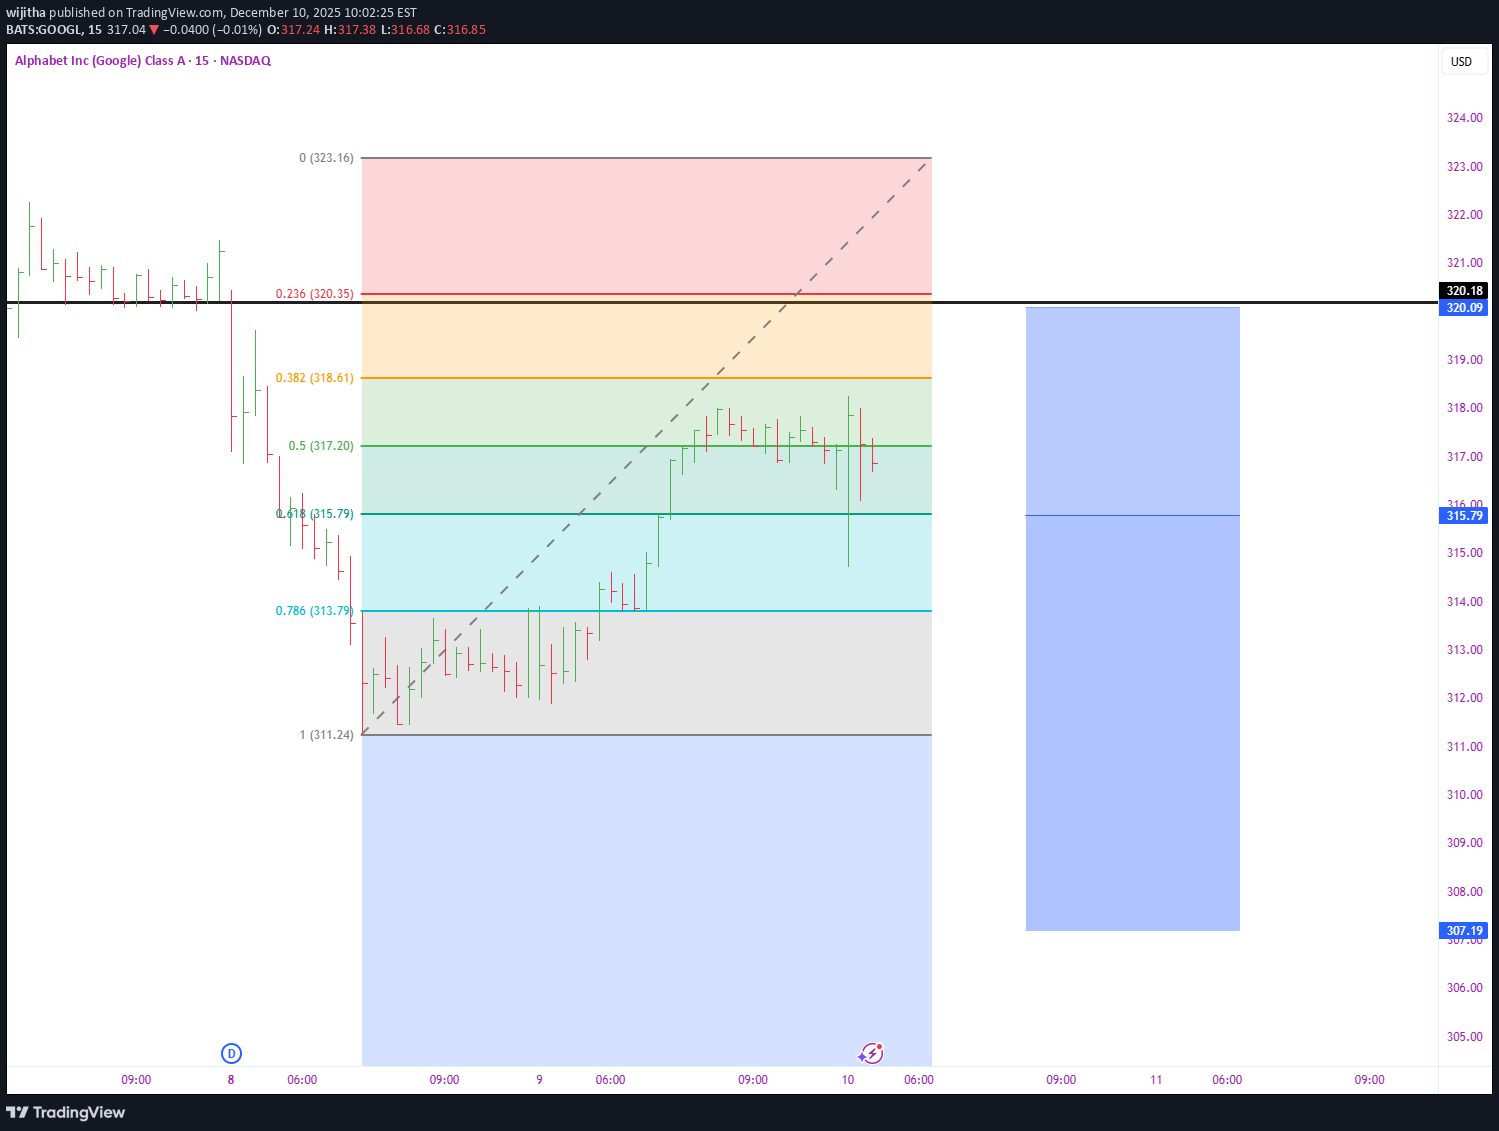
GOOGL Dec 12 Sliding Downward Channel. Key Support Now in Play
GOOGL has been moving inside a clean descending channel on the 15-minute timeframe after the sharp rejection earlier in the session. Each bounce continues to form lower highs, and price remains pinned under the channel’s upper boundary. That trendline has now rejected price multiple times, signaling that sellers are still in control until GOOGL can break above it with strength. The mid-zone around 313–315 is acting as the key intraday decision area. Buyers attempted to stabilize here, but each rally into 315 met resistance, and the latest candles show hesitation beneath the trendline. Unless GOOGL can reclaim 315 and close above the channel’s upper line, the structure remains bearish. Below price, the channel’s lower boundary aligns with the 308–309 support zone. This area held earlier and became the base of the channel. If GOOGL breaks under 310, the channel suggests room for continuation toward 308–307, where buyers previously stepped in aggressively. Now looking at the options landscape, the GEX levels line up tightly with these structural turning points. The 315 level, where GOOGL stalled repeatedly, corresponds with a significant positive gamma band. When price moves into these upper positive-gamma regions, dealer hedging typically dampens momentum. This explains why every push back into 315 fades—it’s not just chart resistance, it’s an area where hedging flows naturally limit extension. Above that, the next major positive gamma levels sit around 322–324. These levels represent the top-end call concentration. To reach that area, GOOGL would need to break the descending channel, reclaim 315, and hold it. If that happens, the hedging pressure that previously contained price begins to release, and volatility can expand upward, opening a path toward 320+. On the downside, negative gamma levels align with the lower channel targets. The cluster around 310–308 shows where downside movement can accelerate. If GOOGL loses 310, the options positioning shifts into a zone where dealer hedging amplifies volatility instead of controlling it. That is exactly the environment where channel breakdowns can follow through cleanly. The correlation between the descending channel and the GEX positioning creates a clear roadmap: • Holding below the channel’s upper trendline keeps the bearish structure intact • A move above 315 signals strength and opens the path to 318 and potentially 322 if momentum builds • Losing 310 confirms continuation within the downward channel toward 308–307 • Below 307, negative gamma increases the chance of sharper moves GOOGL is moving cleanly within its channel, and the options landscape supports both the rejection zones above and the acceleration zones below. Dec 12 is likely defined by how price interacts with 315 on top and 310 underneath. This analysis is for educational purposes only and not financial advice.

shkspr
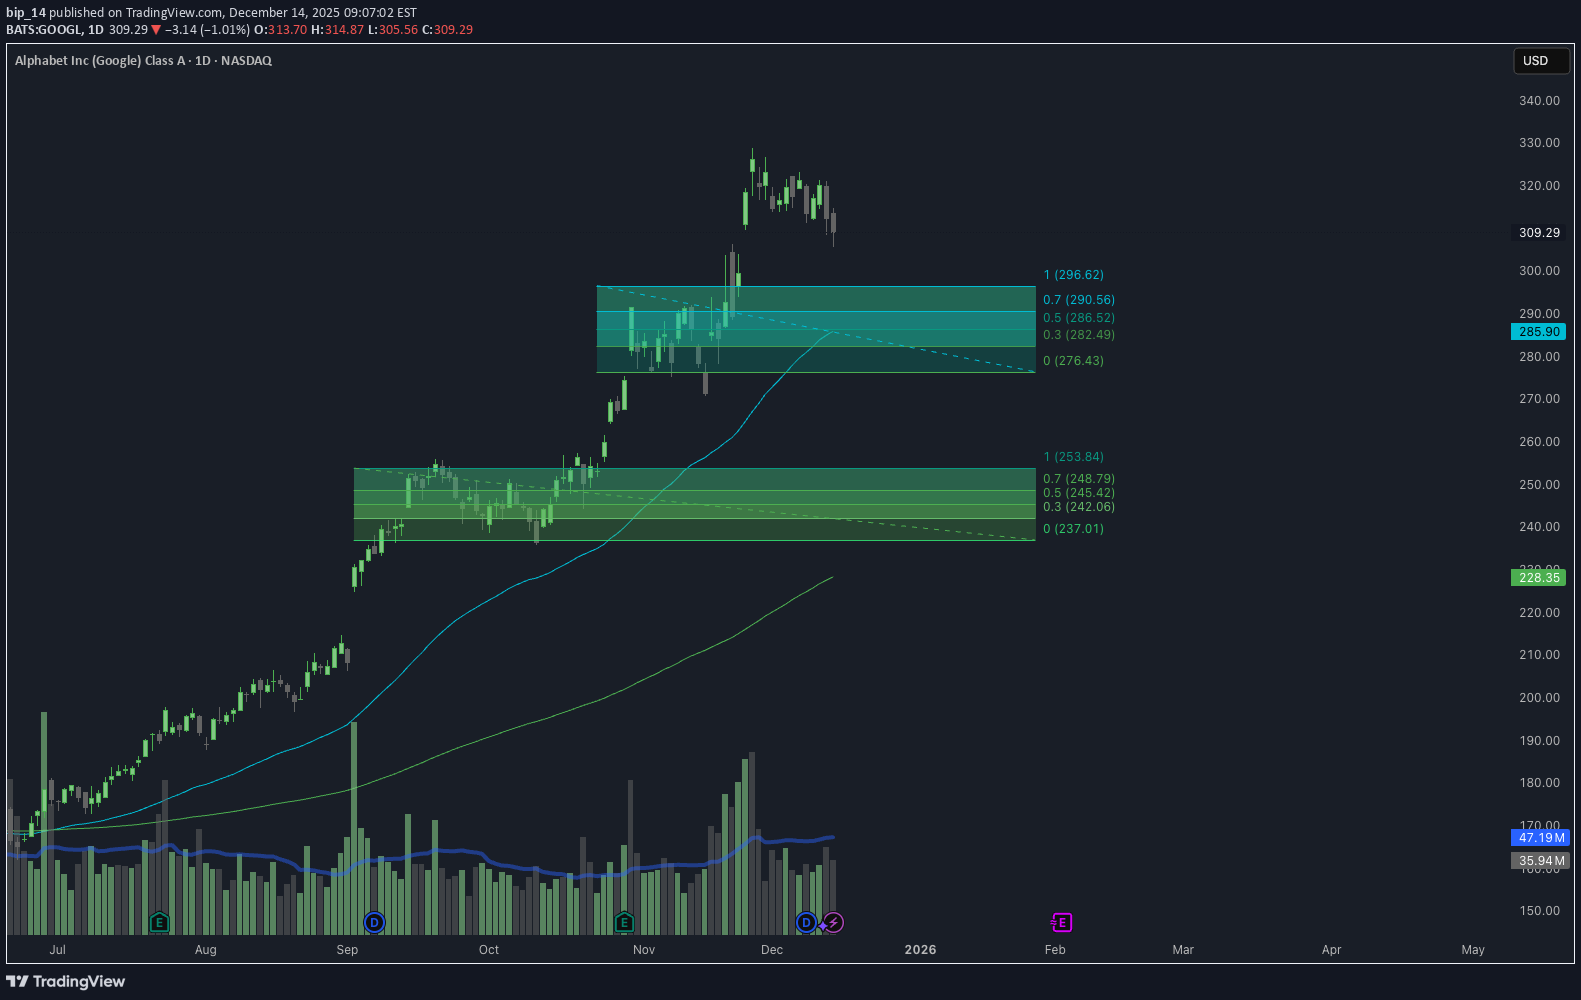
GOOGL | Informative
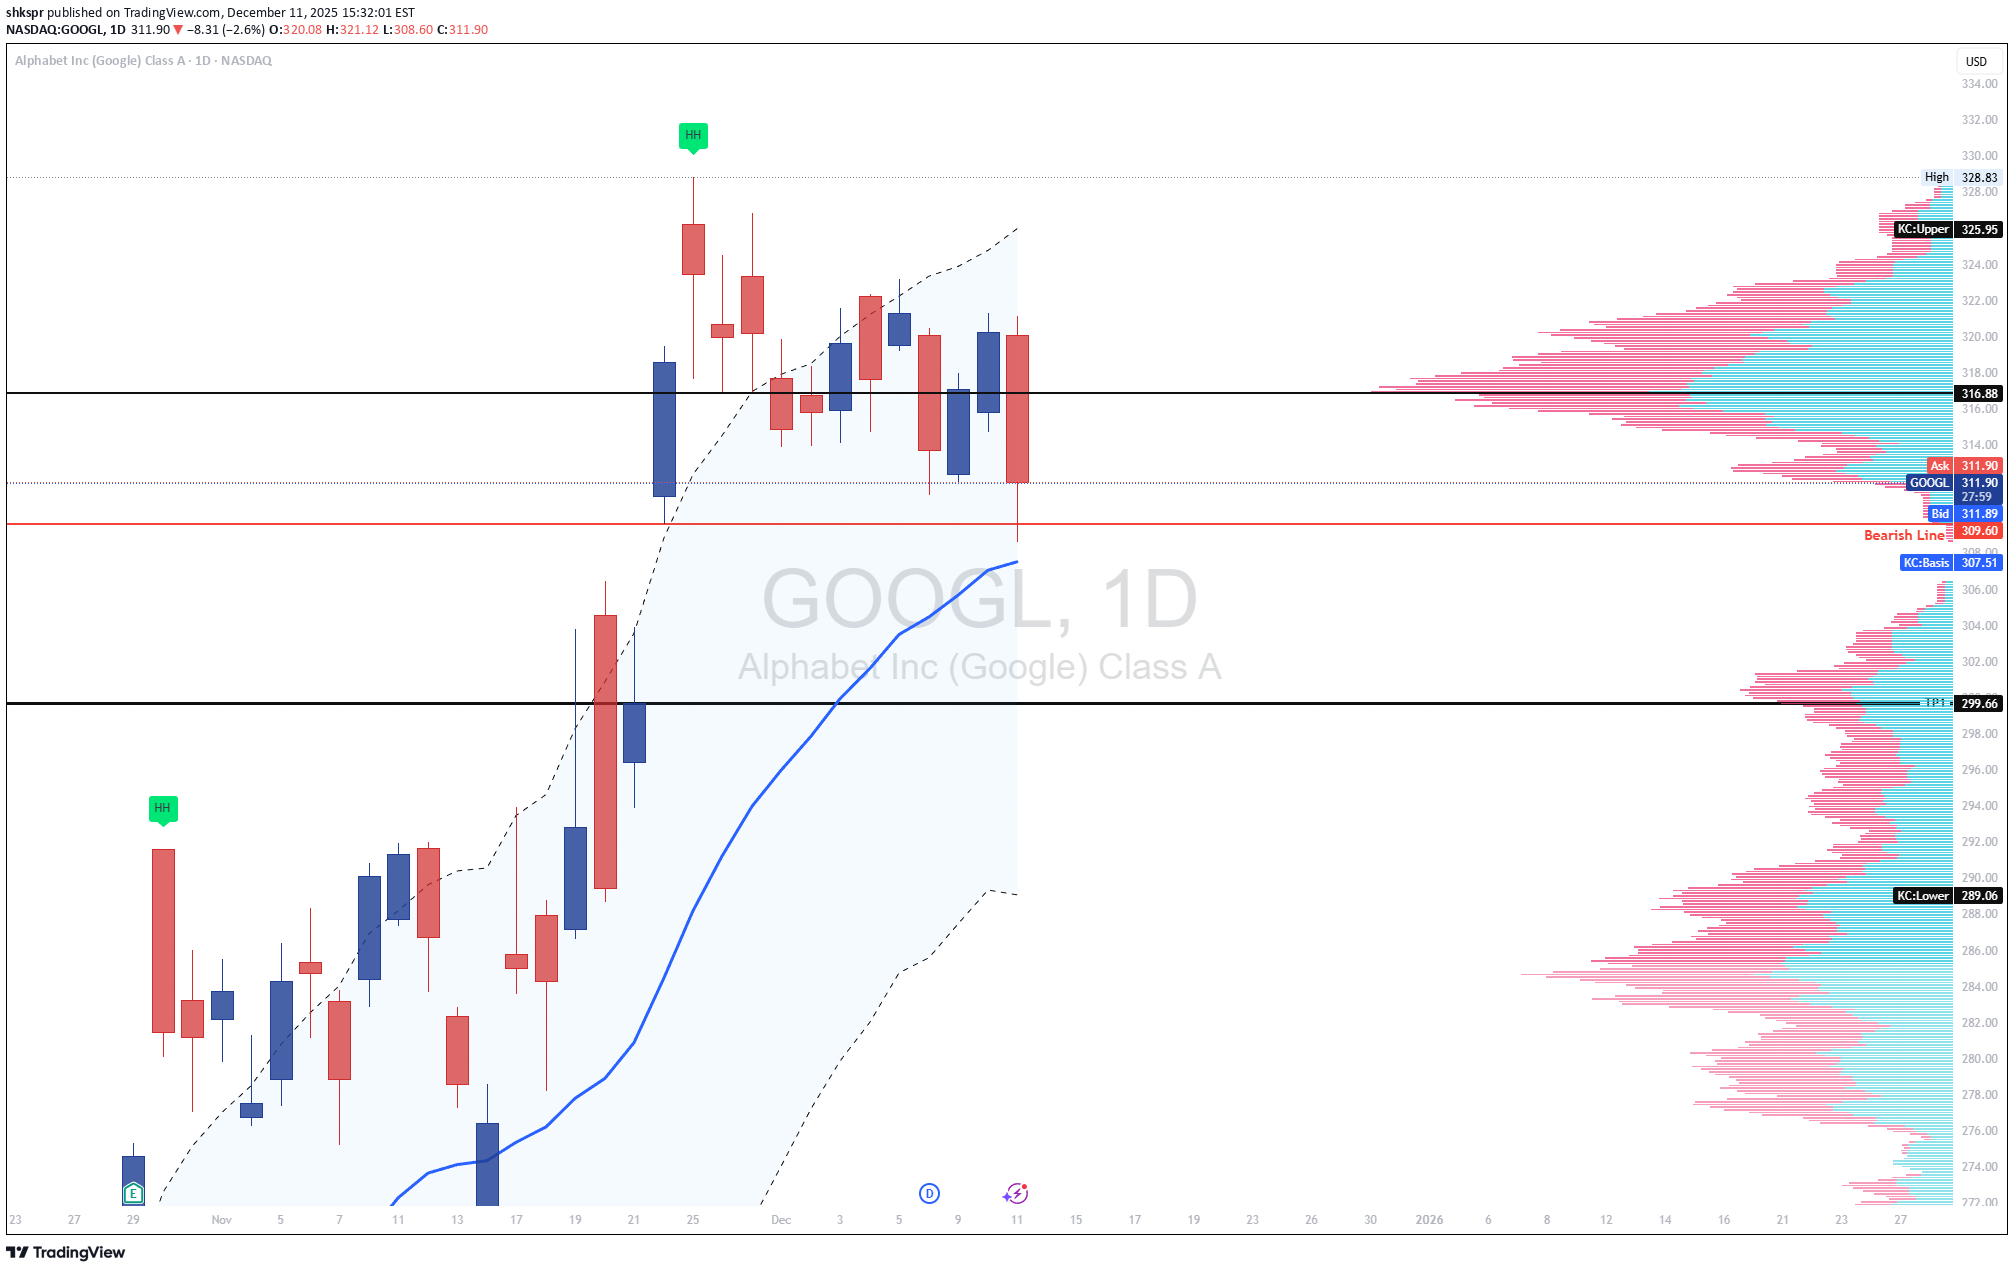
GOOGL Technical Summary GOOGL is breaking down from a multi-week consolidation near the highs. The chart shows repeated failures to hold above the 314–316 resistance band and a clean rejection from the upper Keltner region. Price is now closing below the internal support level at 309–310, shifting the bias to a bearish continuation. The volume profile shows a clear low-liquidity zone beneath current price, opening the door for a rapid move toward 299.66, followed by the Keltner lower band around 289. Bearish Factors 1. Failure at Prior Highs Price made a higher-high earlier but was unable to sustain any momentum. The recent candles show compression followed by a decisive bearish break, signaling the end of upward strength. 2. Breakdown Through 309–310 Support The red line on your chart marks the bearish threshold. Today’s close sits below that area, confirming sellers have taken control. This level now becomes resistance. 3. Rejection at the Keltner Mid-Level The mid-band around 316 acted as resistance several times. GOOGL failed to reclaim it even during strong sessions, showing loss of bullish momentum. 4. Volume Profile Gap There is a thin volume pocket between 309 and the next major volume shelf at 299.66. Once price enters a low-volume region, continuation moves tend to accelerate until reaching the next high-volume area. 5. Trend Context The structure has shifted from impulsive upward movement to sideways distribution, followed by a clean bearish break. Sellers are stepping in aggressively at upper levels and defending every retest. Short Scenario Breakdown Confirmation: Bearish below 309–310, as long as price remains under this level on a daily close. Targets: • First target: 299.66 (primary volume node) • Second target: 289 (Keltner lower band and major support cluster) Invalidation: A daily close back above 316, which would reclaim prior structure and negate the breakdown setup. Outlook GOOGL has transitioned from strength to distribution and is now breaking cleanly beneath support. If price remains below the 309–310 band, the chart favors continuation lower toward 299 and potentially 289. If you want, I can also prepare the optimized TradingView headline for maximum visibility.
Global Trading Economics Risk
1. Macroeconomic Risks in Global Trade Macroeconomic risks arise from changes in global economic conditions. These are the most common risks that affect trade flows, demand, profits, and investment decisions. a) Economic Slowdowns and Recessions When major economies like the US, China, or the EU slow down, global trade demand drops sharply. Lower consumer spending reduces imports, companies cut production, and global supply chains weaken. Recessions also increase unemployment, reduce investment, and cause businesses to delay expansion. b) Inflation Risk High inflation increases production costs, reduces the purchasing power of consumers, and forces central banks to raise interest rates. When interest rates rise: borrowing costs go up companies reduce investment currency values fluctuate export and import dynamics shift Countries with high inflation become less competitive in global markets. c) Interest Rate Risk Central banks around the world adjust interest rates to control inflation, stabilize the currency, or stimulate growth. Higher interest rates strengthen a country’s currency, making exports expensive and imports cheaper. Lower interest rates weaken the currency and stimulate exports. These fluctuations directly impact global trade volumes and profitability. 2. Currency Risk in Global Trade Currency risk is one of the biggest challenges in international trade. Because transactions usually happen in global currencies like USD, EUR, or GBP, sudden changes in exchange rates can create huge gains or losses. a) Exchange Rate Volatility If a country's currency depreciates suddenly, its exports become cheaper globally, but its imports become costly. On the other hand, a strong currency makes exports expensive and reduces foreign demand. b) Currency Wars Sometimes countries intentionally devalue their currency to boost exports. This creates competitive tension between nations and increases uncertainty for international traders. c) Hedging Challenges Companies use forex instruments (like forward contracts, options, and swaps) to protect themselves from currency movements. But hedging itself carries costs and complexity. 3. Geopolitical and Political Risks Political instability and geopolitical conflicts are major sources of global trading risk. Any disruption in political relations impacts trade policies, supply routes, and investor confidence. a) Trade Wars Trade wars happen when countries impose tariffs and sanctions on each other’s imports. The US-China trade war is a clear example, with tariffs creating uncertainty for businesses and raising costs for consumers. b) Conflicts and Wars Geopolitical conflicts disrupt supply chains, increase commodity prices (especially oil and gas), and restrict trade routes. For example: Middle East conflicts disrupt crude oil supply. Russia–Ukraine conflict affected global wheat, gas, and fertilizer markets. c) Policy Changes Government decisions such as new taxes, export restrictions, sanctions, or regulatory reforms can abruptly change trade conditions. d) Political Instability Countries with unstable governments experience disruptions in production, currency fluctuations, investment losses, and lower international trust. 4. Supply Chain and Logistics Risks Global trade depends on efficient supply chains. Any disruption can cause shortages, delays, and increased costs. a) Shipping Delays and Container Shortages Events such as port congestion, strikes, and logistical bottlenecks lead to delivery delays and higher freight costs. b) Natural Disasters Earthquakes, floods, cyclones, and pandemics can shut down ports, factories, and production hubs, affecting global supply networks. c) Supply Chain Dependencies Many countries depend heavily on specific nations for essential goods like semiconductors, crude oil, food, and pharmaceuticals. Disruptions in these supply hubs can impact global trade stability. d) Transportation Risk Breakdowns in transportation networks—such as railway issues, air cargo restrictions, or shipping route closures—cause massive trade disruptions. 5. Regulatory and Compliance Risks International trade is heavily regulated. Countries follow trade agreements, tariffs, environmental rules, and safety standards. a) Tariff Risk Changes in customs duties, import taxes, and trade barriers can alter the profitability of cross-border sales. b) Trade Agreement Risk Countries may withdraw from agreements (like Brexit), renegotiate tariffs, or impose new conditions. c) Compliance Risk Businesses must follow: environmental standards labor laws product quality rules customs documentation Non-compliance leads to fines, shipment delays, or bans. 6. Technological Risks in Global Trading Economics Technology plays a critical role in modern trade, but it also introduces new risks. a) Cybersecurity Threats Hackers target: financial transactions supply chain software logistics systems digital shipping documents A cyberattack can halt operations and compromise sensitive data. b) Automation and AI Risks Automation increases efficiency but also creates job losses and inequality. Over-reliance on AI systems can escalate risks if they malfunction. c) Digital Trade Barriers Countries sometimes restrict data transfers or impose digital taxes, affecting companies operating globally. 7. Commodity Market Risks Global trade heavily depends on commodities like crude oil, natural gas, metals, and agricultural produce. a) Price Volatility Commodity prices fluctuate due to demand-supply imbalances, geopolitical tensions, weather conditions, or speculation. High volatility affects production costs and profit margins. b) Resource Dependency Countries dependent on a single commodity face extreme risk when prices fall (e.g., oil-exporting nations during a crude price crash). 8. Environmental and Climate Risks Climate change is becoming one of the most significant long-term global trading risks. a) Extreme Weather Storms, droughts, and floods disrupt trade, damage crops, and shut down industries. b) Carbon Taxes and Emission Rules Global environmental regulations are changing how companies operate. Carbon taxes increase costs for exporters, especially in energy-intensive industries. c) Sustainability Pressure Consumers and governments demand eco-friendly production. Companies that fail to adapt face loss of market access. 9. Global Financial Market Risks Financial markets influence trade through stock market performance, liquidity conditions, and investor sentiment. a) Credit Risk Companies and governments rely on global financing. Liquidity crises or credit downgrades increase borrowing costs. b) Banking Risk Banking collapses or regulatory failures impact trade finance, currency markets, and investor confidence. 10. Risk Management in Global Trading Economics Companies and investors use several strategies to manage global trading risks: Hedging using futures, options, and swaps Diversifying markets and suppliers Setting up supply chain redundancies Political risk insurance Strong financial planning Digital security systems Scenario analysis and stress testing Effective risk management ensures long-term stability and profitability in global trade. Conclusion Global trading economics risks are unavoidable in today’s interconnected world. They emerge from economic cycles, political tensions, currency movements, supply chain disruptions, commodity volatility, and environmental changes. For traders, investors, and businesses, understanding these risks and adopting effective risk-management strategies is crucial to surviving and succeeding in global markets.
Google: Pause?
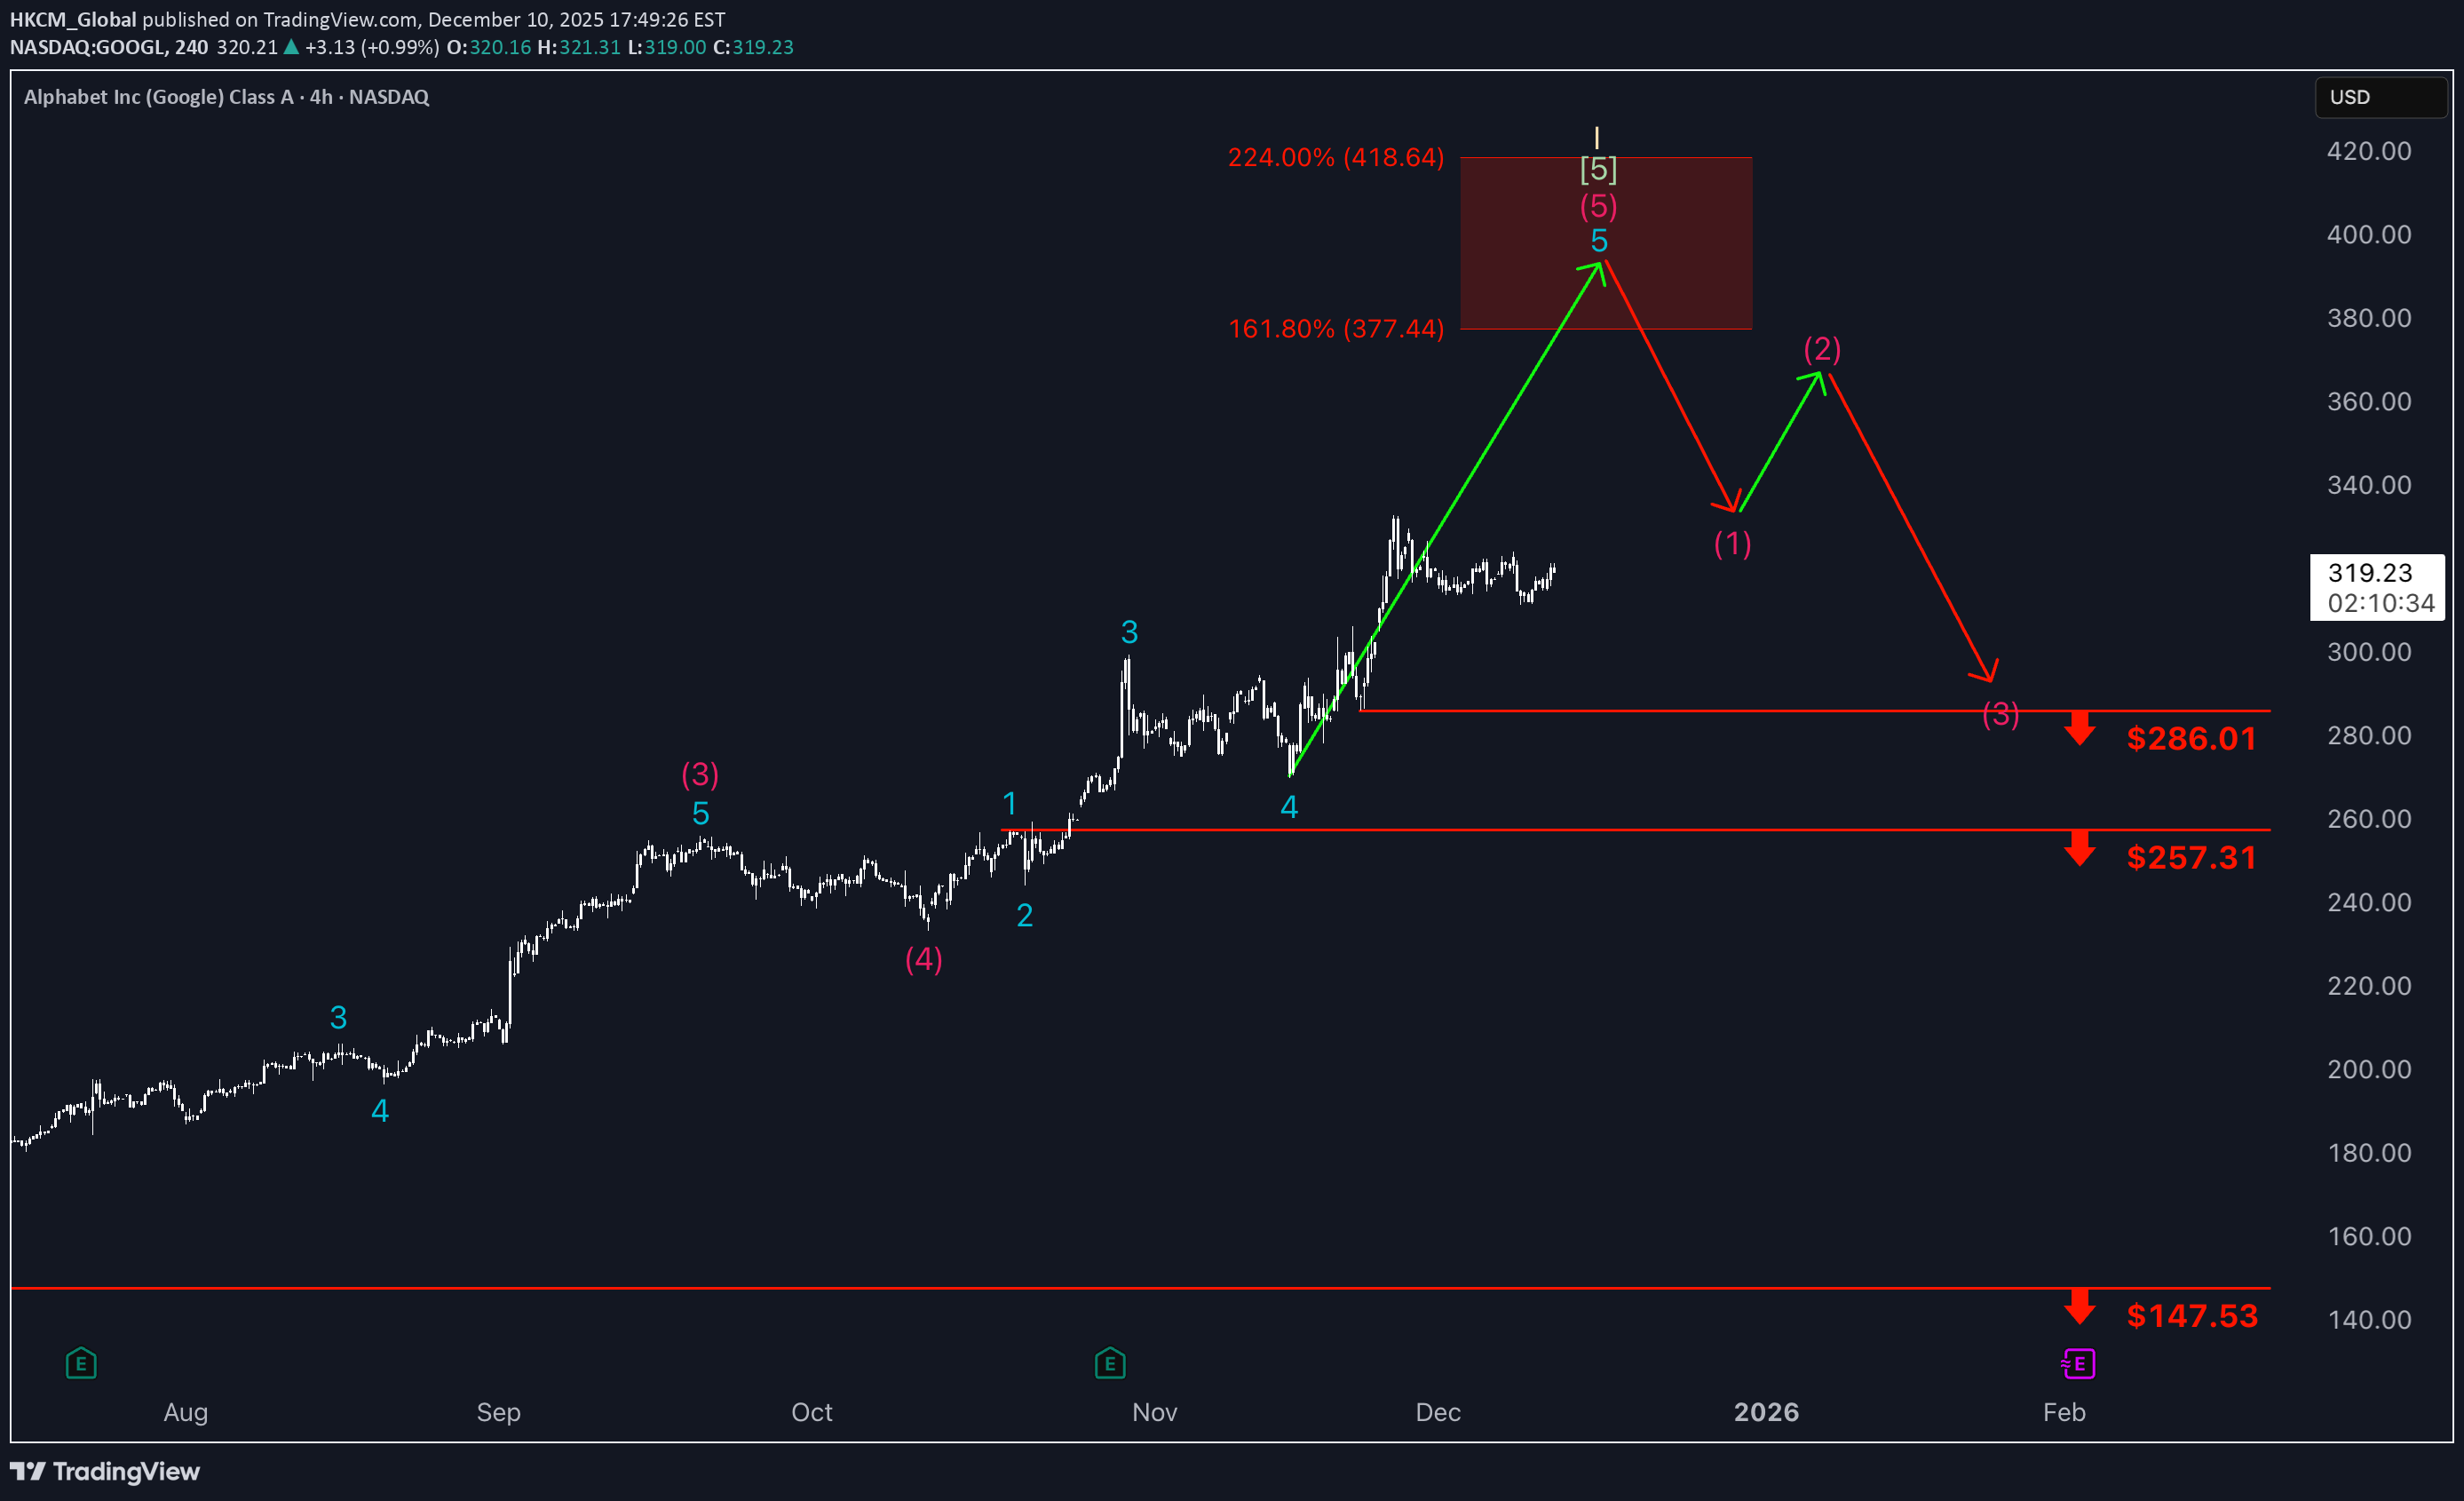
Over the past two weeks, Google's stock has been taking a breather, moving mostly sideways. Our primary scenario suggests that price will soon gather fresh upward momentum and swing into the red Target Zone between $377.44 and $418.64, where it should complete the overarching upward cycle of the beige wave I. Once this occurs, a new downward impulse is expected to begin, making the red zone suitable for entering short positions; a stop 1% above the upper boundary of the zone can provide protection.

wijitha
BEARISH TREND Analyze
Bearish markets test the mettle of every trader—but they also sharpen strategy and reveal hidden potential. Success lies in recognizing resistance zones, anticipating trend shifts, and enforcing disciplined risk controls like stop-losses and diversified holdings. Staying informed on macroeconomic developments—such as fiscal policy, global trade dynamics, and central bank signals—adds a crucial layer of foresight. Rather than fearing downturns, seasoned traders view them as setups for future gains. With patience, adaptability, and a clear-eyed strategy, every dip becomes a stepping stone toward long-term resilience.
Disclaimer
Any content and materials included in Sahmeto's website and official communication channels are a compilation of personal opinions and analyses and are not binding. They do not constitute any recommendation for buying, selling, entering or exiting the stock market and cryptocurrency market. Also, all news and analyses included in the website and channels are merely republished information from official and unofficial domestic and foreign sources, and it is obvious that users of the said content are responsible for following up and ensuring the authenticity and accuracy of the materials. Therefore, while disclaiming responsibility, it is declared that the responsibility for any decision-making, action, and potential profit and loss in the capital market and cryptocurrency market lies with the trader.