Technical analysis by shkspr about Symbol GOOGLX on 12/11/2025

GOOGL | Informative
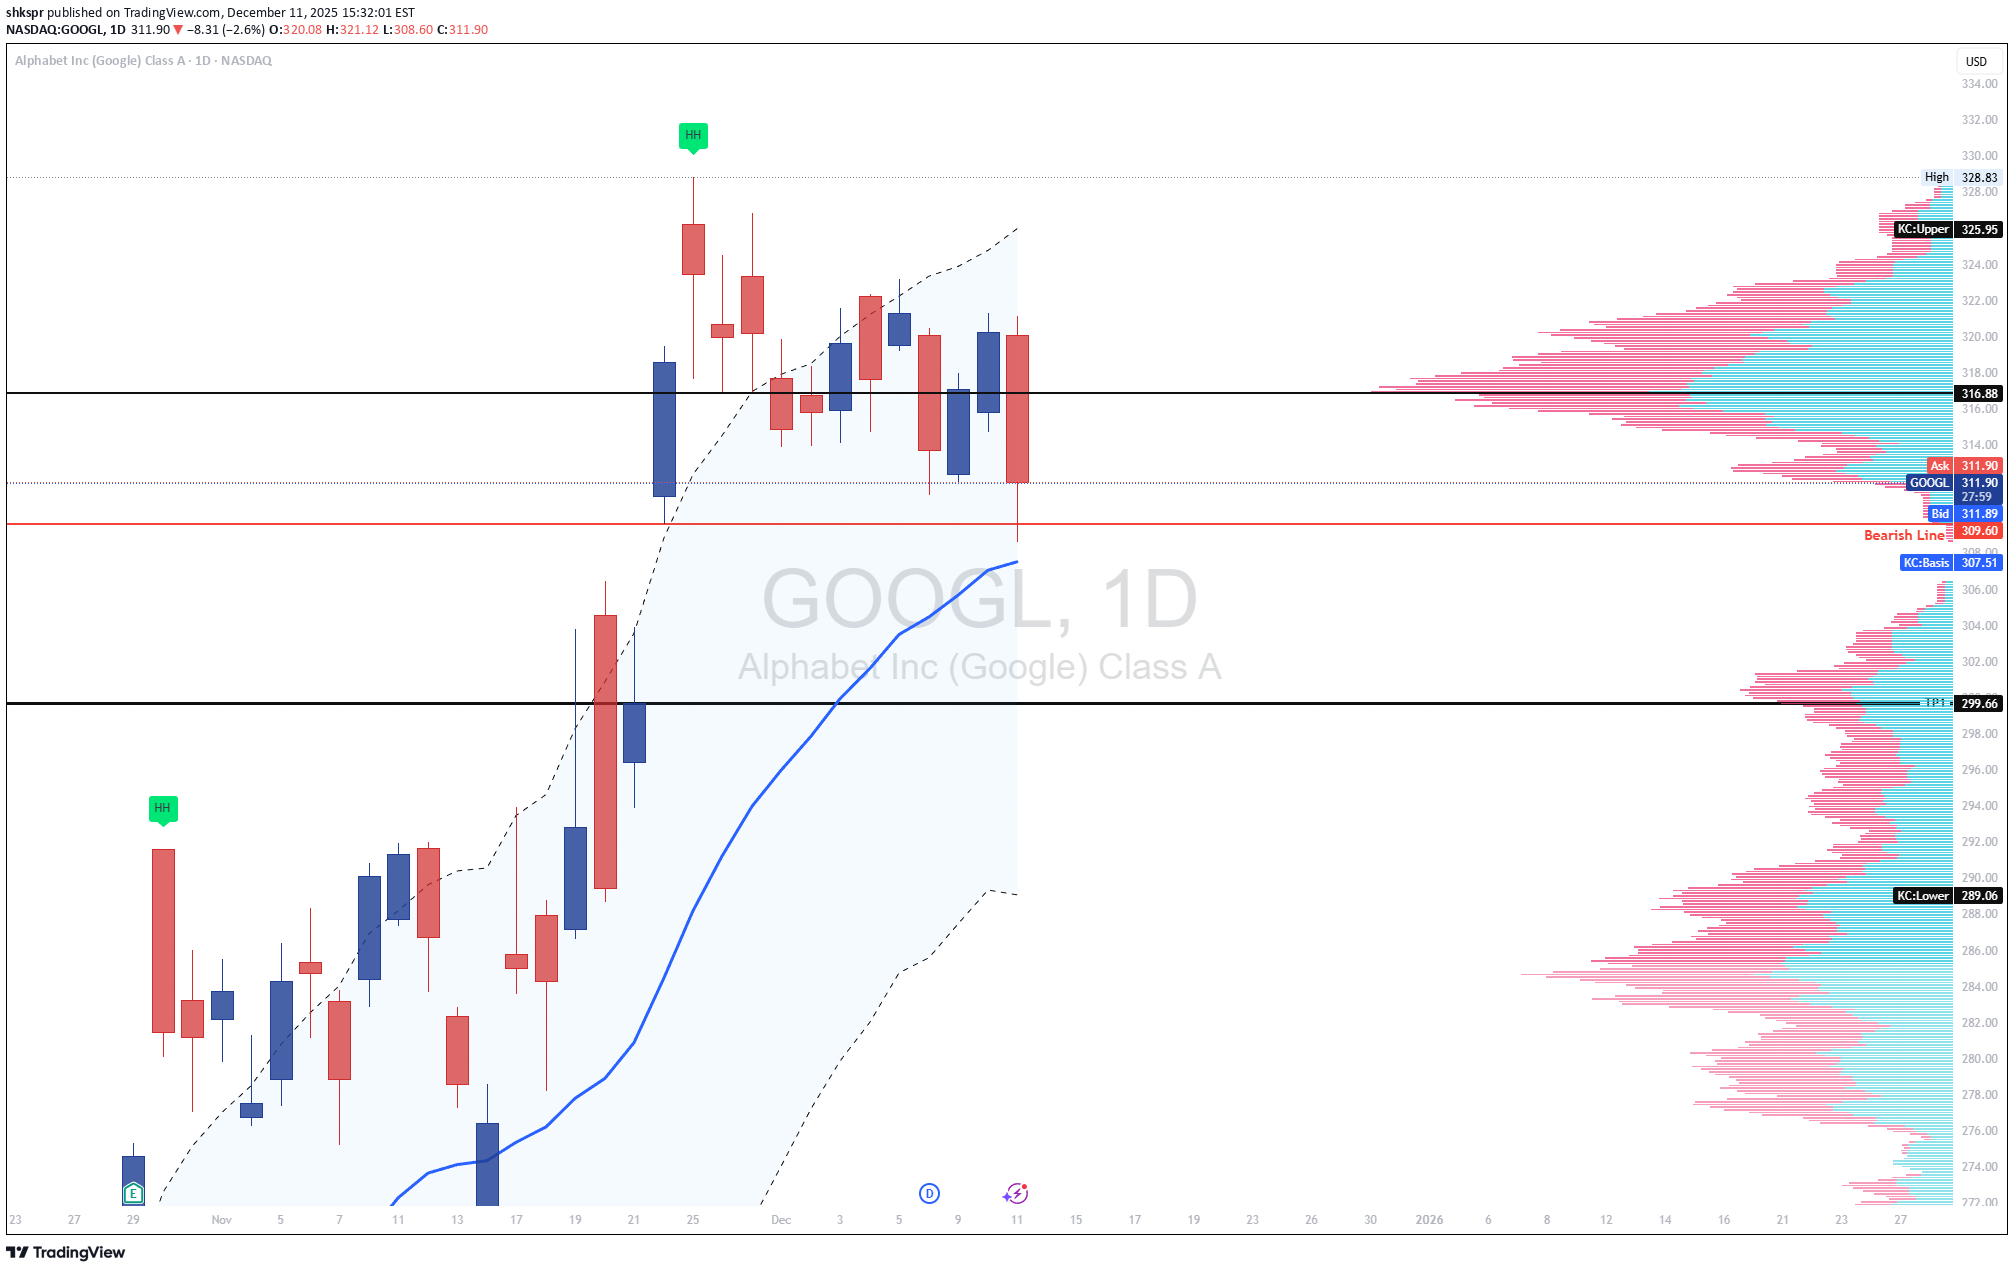
GOOGL Technical Summary GOOGL is breaking down from a multi-week consolidation near the highs. The chart shows repeated failures to hold above the 314–316 resistance band and a clean rejection from the upper Keltner region. Price is now closing below the internal support level at 309–310, shifting the bias to a bearish continuation. The volume profile shows a clear low-liquidity zone beneath current price, opening the door for a rapid move toward 299.66, followed by the Keltner lower band around 289. Bearish Factors 1. Failure at Prior Highs Price made a higher-high earlier but was unable to sustain any momentum. The recent candles show compression followed by a decisive bearish break, signaling the end of upward strength. 2. Breakdown Through 309–310 Support The red line on your chart marks the bearish threshold. Today’s close sits below that area, confirming sellers have taken control. This level now becomes resistance. 3. Rejection at the Keltner Mid-Level The mid-band around 316 acted as resistance several times. GOOGL failed to reclaim it even during strong sessions, showing loss of bullish momentum. 4. Volume Profile Gap There is a thin volume pocket between 309 and the next major volume shelf at 299.66. Once price enters a low-volume region, continuation moves tend to accelerate until reaching the next high-volume area. 5. Trend Context The structure has shifted from impulsive upward movement to sideways distribution, followed by a clean bearish break. Sellers are stepping in aggressively at upper levels and defending every retest. Short Scenario Breakdown Confirmation: Bearish below 309–310, as long as price remains under this level on a daily close. Targets: • First target: 299.66 (primary volume node) • Second target: 289 (Keltner lower band and major support cluster) Invalidation: A daily close back above 316, which would reclaim prior structure and negate the breakdown setup. Outlook GOOGL has transitioned from strength to distribution and is now breaking cleanly beneath support. If price remains below the 309–310 band, the chart favors continuation lower toward 299 and potentially 289. If you want, I can also prepare the optimized TradingView headline for maximum visibility.