Technical analysis by BullBearInsights about Symbol GOOGLX on 12/15/2025

BullBearInsights
GOOGL. Plan for Dec 15
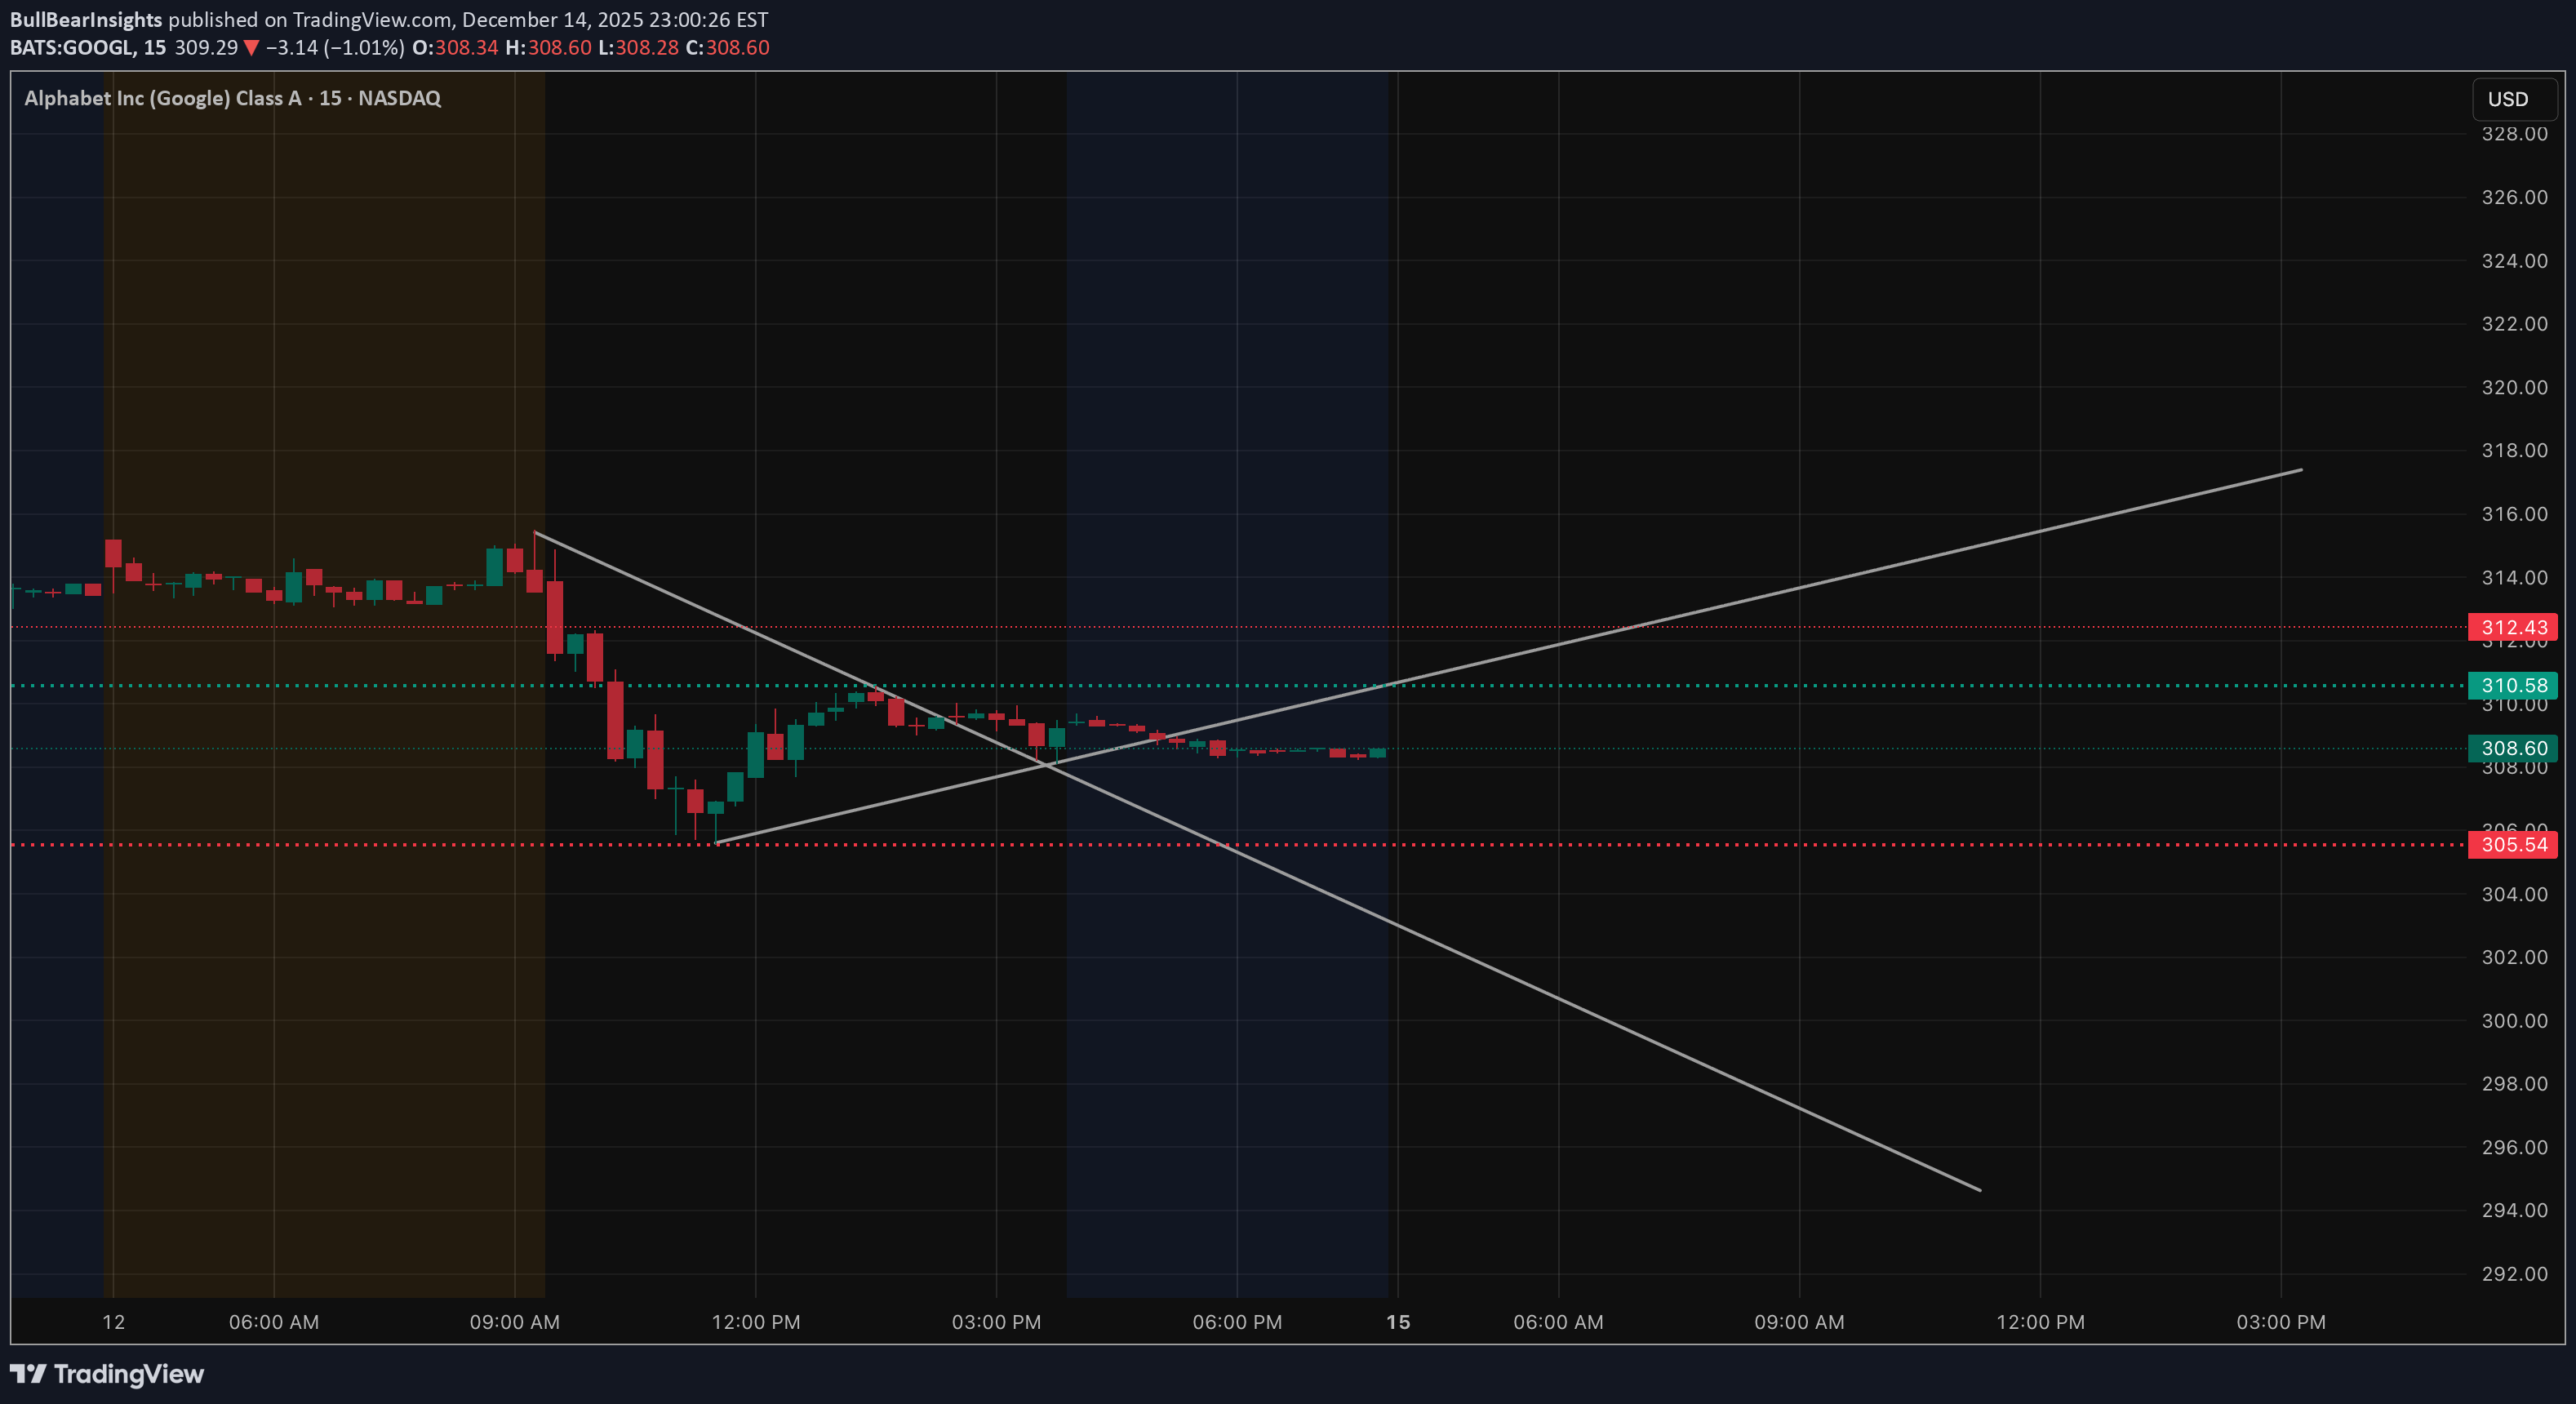
Looking at GOOGL going into Dec. 15, the chart still feels heavy, even though price has stopped falling aggressively. After the selloff, we got a bounce — but that bounce never reclaimed structure. Price broke down, tried to push back up, and stalled right where former support should turn into resistance. That’s not strength — that’s sellers letting price breathe. Right now, GOOGL is sitting around the 308–310 area, which feels more like a pause than a base. There’s no real impulsive buying, just small candles and low follow-through. This usually means the market is deciding when, not if, to make the next move. From a structure standpoint, the bearish move is still valid until proven otherwise. Levels that actually matter The first thing I’m watching is 308. If price loses 308 with any momentum, I expect a quick move into 305, and if that doesn’t hold, 302–300 becomes very realistic. Those levels line up with prior lows and unfinished business from the selloff. On the upside, 312–315 is the problem area. That zone was support before the breakdown, and now it’s acting like a ceiling. Every bounce into that area so far has been sold. If price can’t reclaim and hold above 315, upside moves are likely just short-covering, not real trend change. How GEX fits into this (not the focus, just confirmation) Options positioning lines up with what price is telling us. There’s strong PUT support around the current price, which explains why we’re chopping instead of free-falling. But above us, CALL resistance stacks up around 320 and higher, which makes upside continuation harder unless volume steps in. That’s why moves down feel faster than moves up — dealers aren’t forced to support upside right now. How I’d think about tomorrow If GOOGL opens and can’t hold above 310, I’d be cautious leaning long. A clean break below 308 is where downside momentum likely kicks in. If we open strong and reclaim 315, then I’d reassess — but until that happens, the burden of proof is on the bulls. For me, Dec. 15 is simple: * Below 308 → downside continuation likely * Between 308–315 → chop and traps * Above 315 → only then does the chart start to improve Until then, this still looks like bearish consolidation, not a reversal. Not financial advice. Just how I’m reading the chart going into the next session.