
FORTH
Ampleforth Governance Token
| تریدر | نوع سیگنال | حد سود/ضرر | زمان انتشار | مشاهده پیام |
|---|---|---|---|---|
No results found. | ||||
Price Chart of Ampleforth Governance Token
سود 3 Months :
سیگنالهای Ampleforth Governance Token
Filter
Sort messages by
Trader Type
Time Frame

CryptoSanders9563
تحلیل هفتگی فورث/تتر (FORTH/USDT): آیا کف قیمت تاریخی شکسته میشود یا آماده جهش است؟
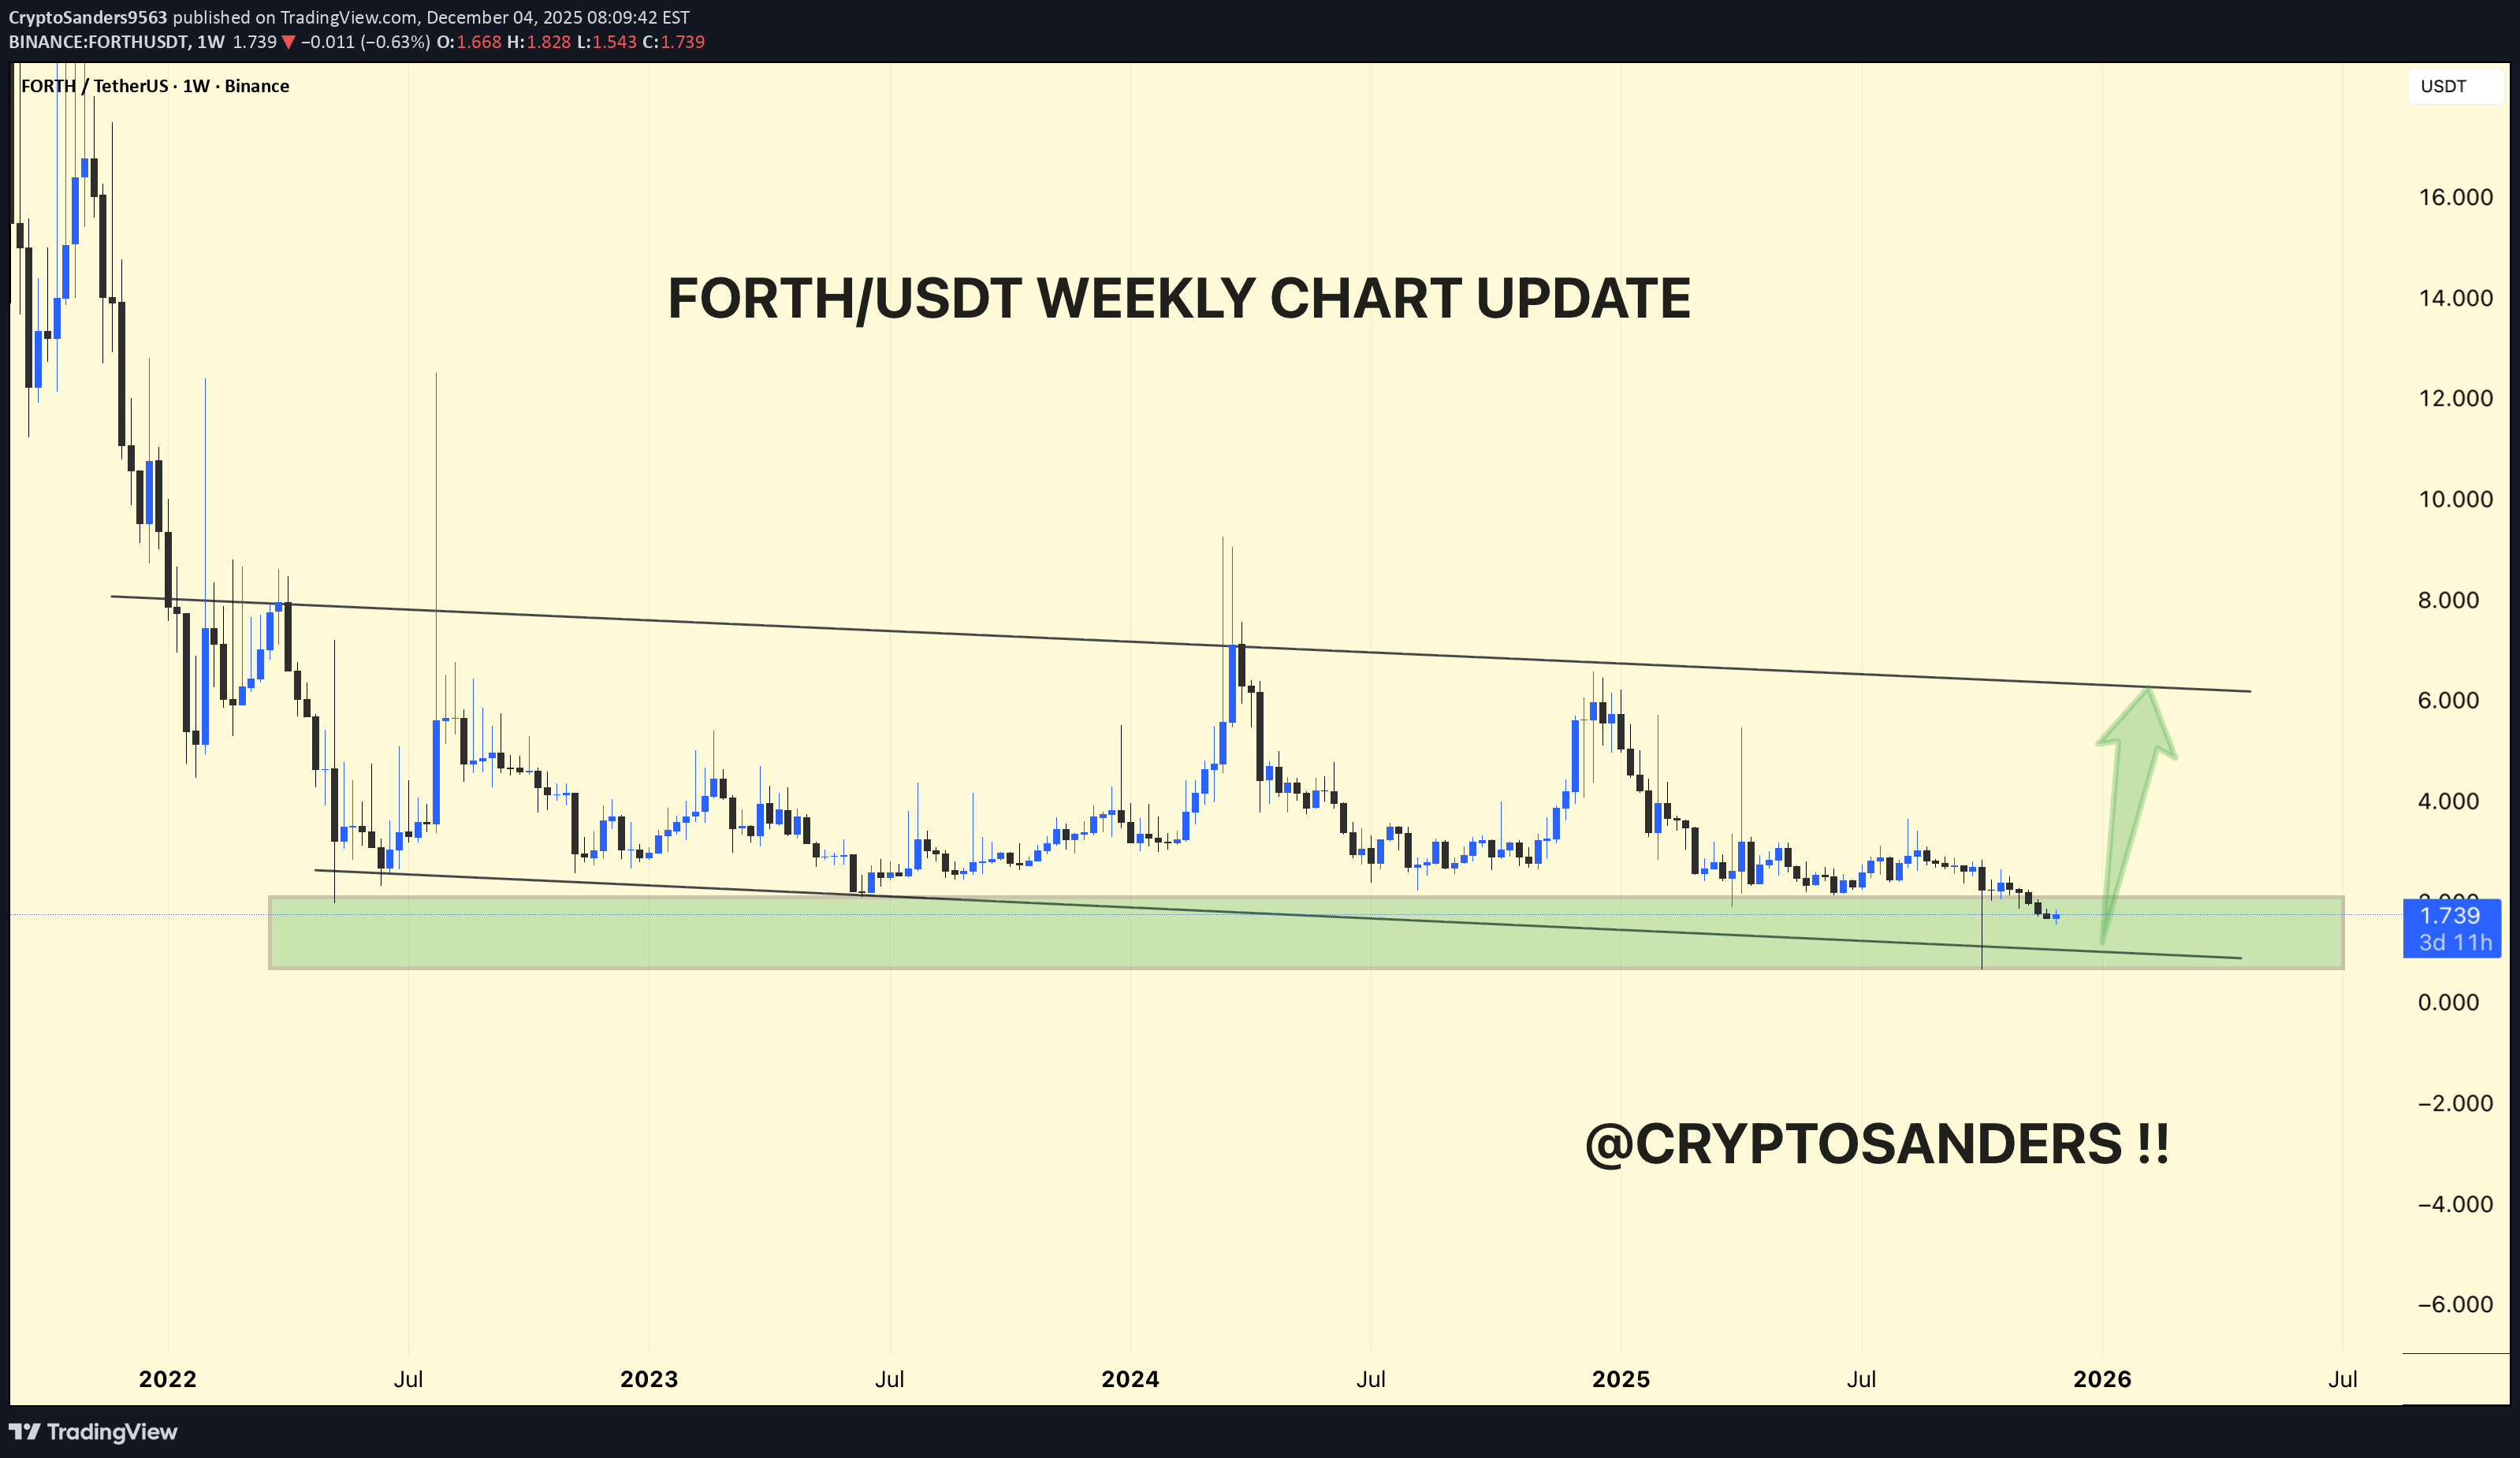
The weekly chart, FORTH/USDT, is still in a prolonged downtrend, but is once again within a large demand zone where previous rallies originated. The price has been trending down below a major downward resistance line since 2022, with each upward impulse failing near that trendline and then retracing back to the same green support band around 1.4–2.0 USDT. The latest candles have been holding within this green zone and the slightly rising underlying trendline, making this area a key higher-timeframe accumulation and invalidation zone for the pair. As long as green support holds, a technical bounce towards downward resistance near 5–6 USDT remains a realistic medium-term scenario, matching the upward arrow on your chart. A clean weekly close below the green band would break the multi-year base and create room for new lows, so risk on any long bias should be strictly managed below that zone. DYOR | NFA

Bithereum_io
تحلیل تکنیکال فورث (FORTH): مثلث نزولی، مقاومت قوی و اهداف هیجانانگیز پس از شکست!
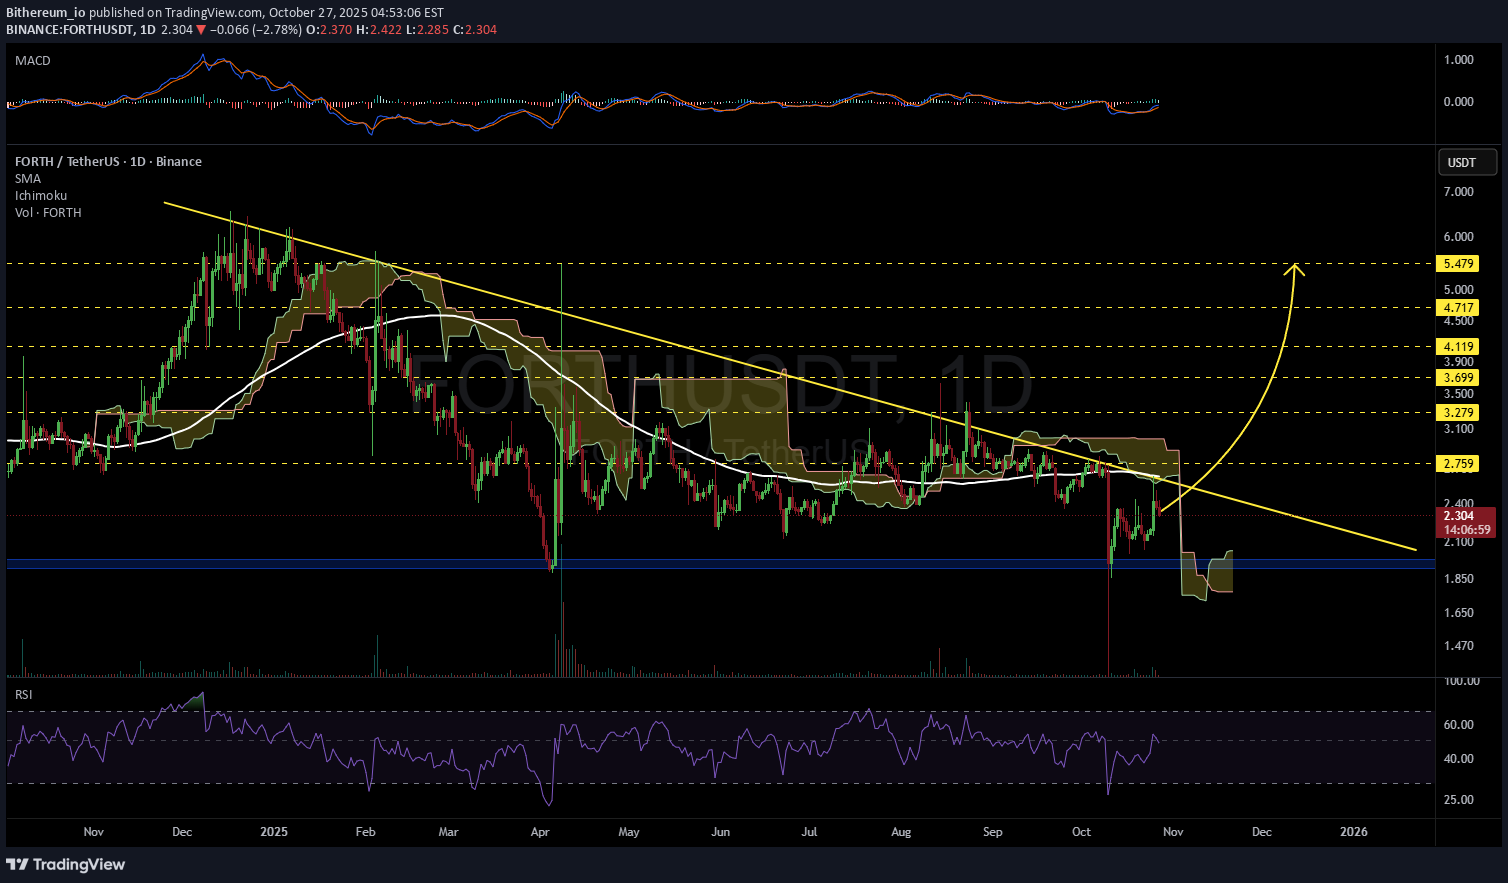
#FORTH is moving inside a descending triangle on the daily timeframe chart. It has recently rejected from the resistance cluster, which includes the triangle resistance, the Ichimoku cloud, and the daily SMA100. However, a breakout is expected in the coming days, so keep an eye on it. If a breakout occurs, the potential targets are: 🎯 $2.759 🎯 $3.279 🎯 $3.699 🎯 $4.119 🎯 $4.717 🎯 $5.479 ⚠️ Always remember to use a tight stop-loss and maintain proper risk management.

AltcoinPiooners
Seize the Surge: $FORTH 4H Trading Plan with RSI Signal
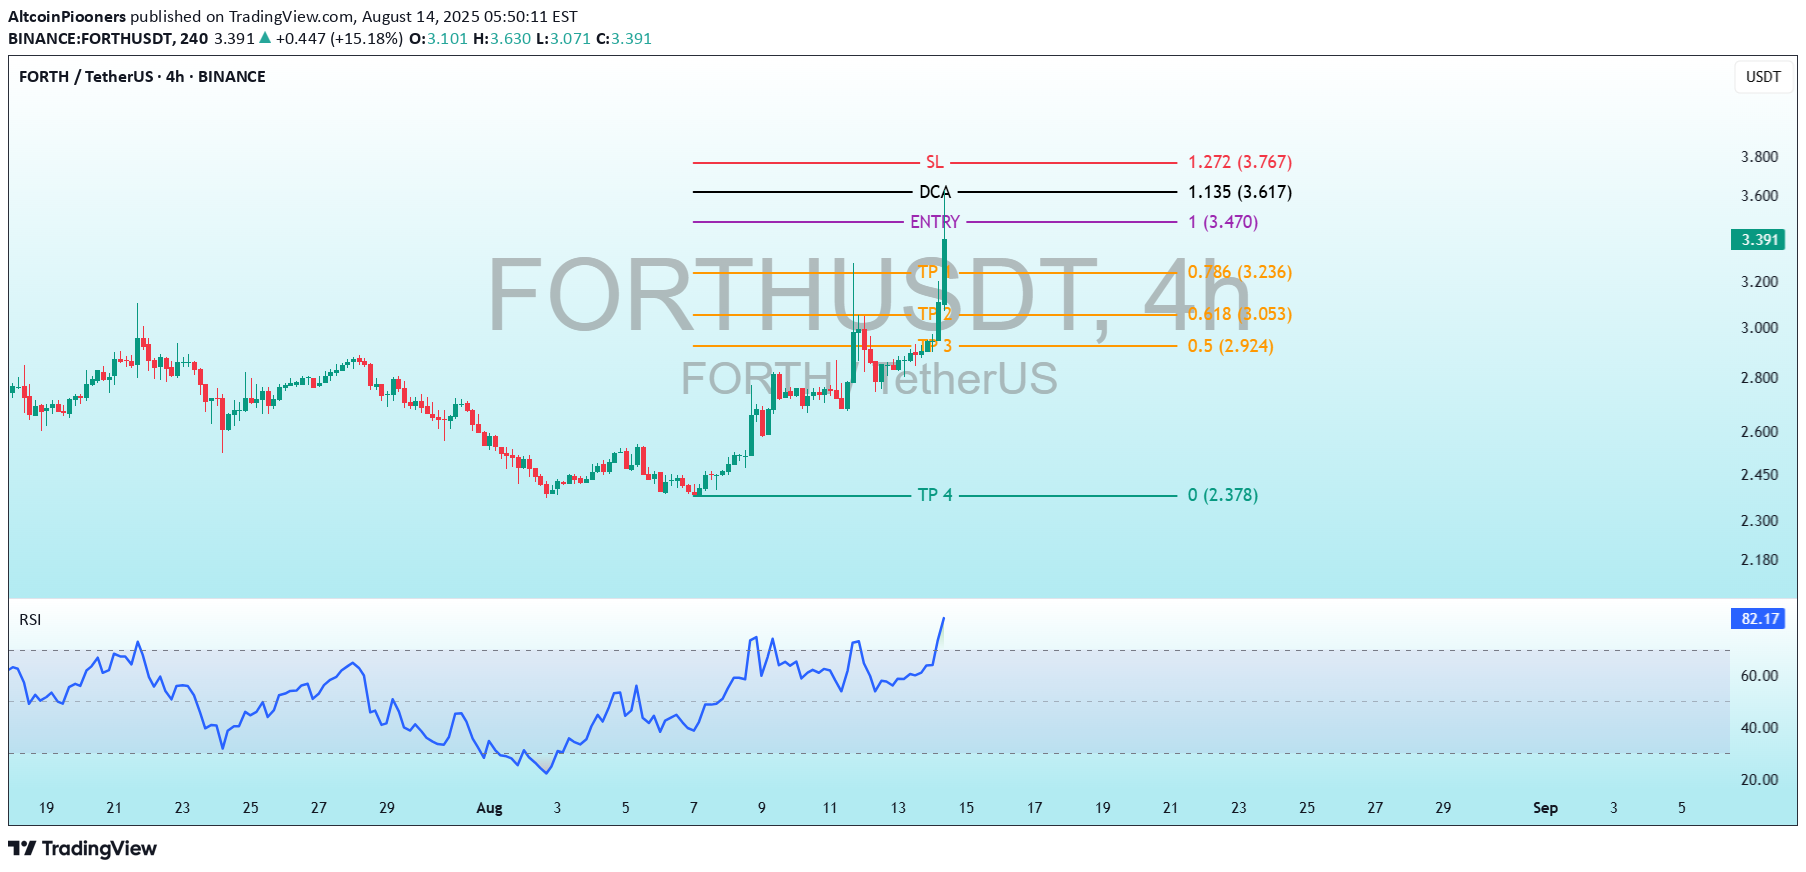
FORTHUSDT Seize the Surge: FORTH 4H Trading Plan with RSI Signal Trading Levels: Entry: 1.00 (3.470 USDT) - The level where the initial purchase is planned. DCA (Dollar-Cost Averaging): 1.135 (3.617 USDT) - An additional buying point if the price rises. SL (Stop Loss): 1.272 (3.767 USDT) - The level where the loss would be limited. TP (Take Profit):TP1: 0.786 (3.236 USDT) TP2: 0.618 (3.053 USDT) TP3: 0.5 (2.924 USDT) TP4: 0.236 (2.236 USDT) - A significantly lower target, possibly a long-term goal. RSI (Relative Strength Index) Indicator: The current RSI value is 82.85, which is in the overbought territory (above 70 and nearing 80). This indicates the price may be overextended, hinting at a potential reversal or correction. Analysis and Interpretation: Strategy: The chart uses Fibonacci levels to determine entry, exit, and loss points. The entry is set at 3.470 USDT, with a DCA at 3.617 USDT if the price continues to rise, and a stop loss at 3.767 USDT to protect capital. Profit Targets: TP1 to TP3 are based on Fibonacci retracement levels (0.786, 0.618, 0.5), indicating a technical approach to taking profits incrementally. TP4 at 2.236 USDT seems notably lower and might reflect a long-term target or an error. RSI: The high RSI value (82.85) suggests an overbought condition. This could signal an impending pullback or consolidation, especially if the price fails to sustain its recent upward momentum. Recommendation: Monitor the price closely around the entry level (3.470 USDT) and DCA (3.617 USDT). Given the overbought RSI, exercise caution with new entries or consider preparing for a potential sell-off.TP 1 ✅ +7.80% PROFIT 💭 Dream big, work hard, stay focused. Interested for Premium 👉 t.me/Altcoin_Piooners Follow for signals! 🔥 #Crypto #Stablecoin

Jawad_Crypto
ForthUSDT 2 targets hitted with 20% profits.
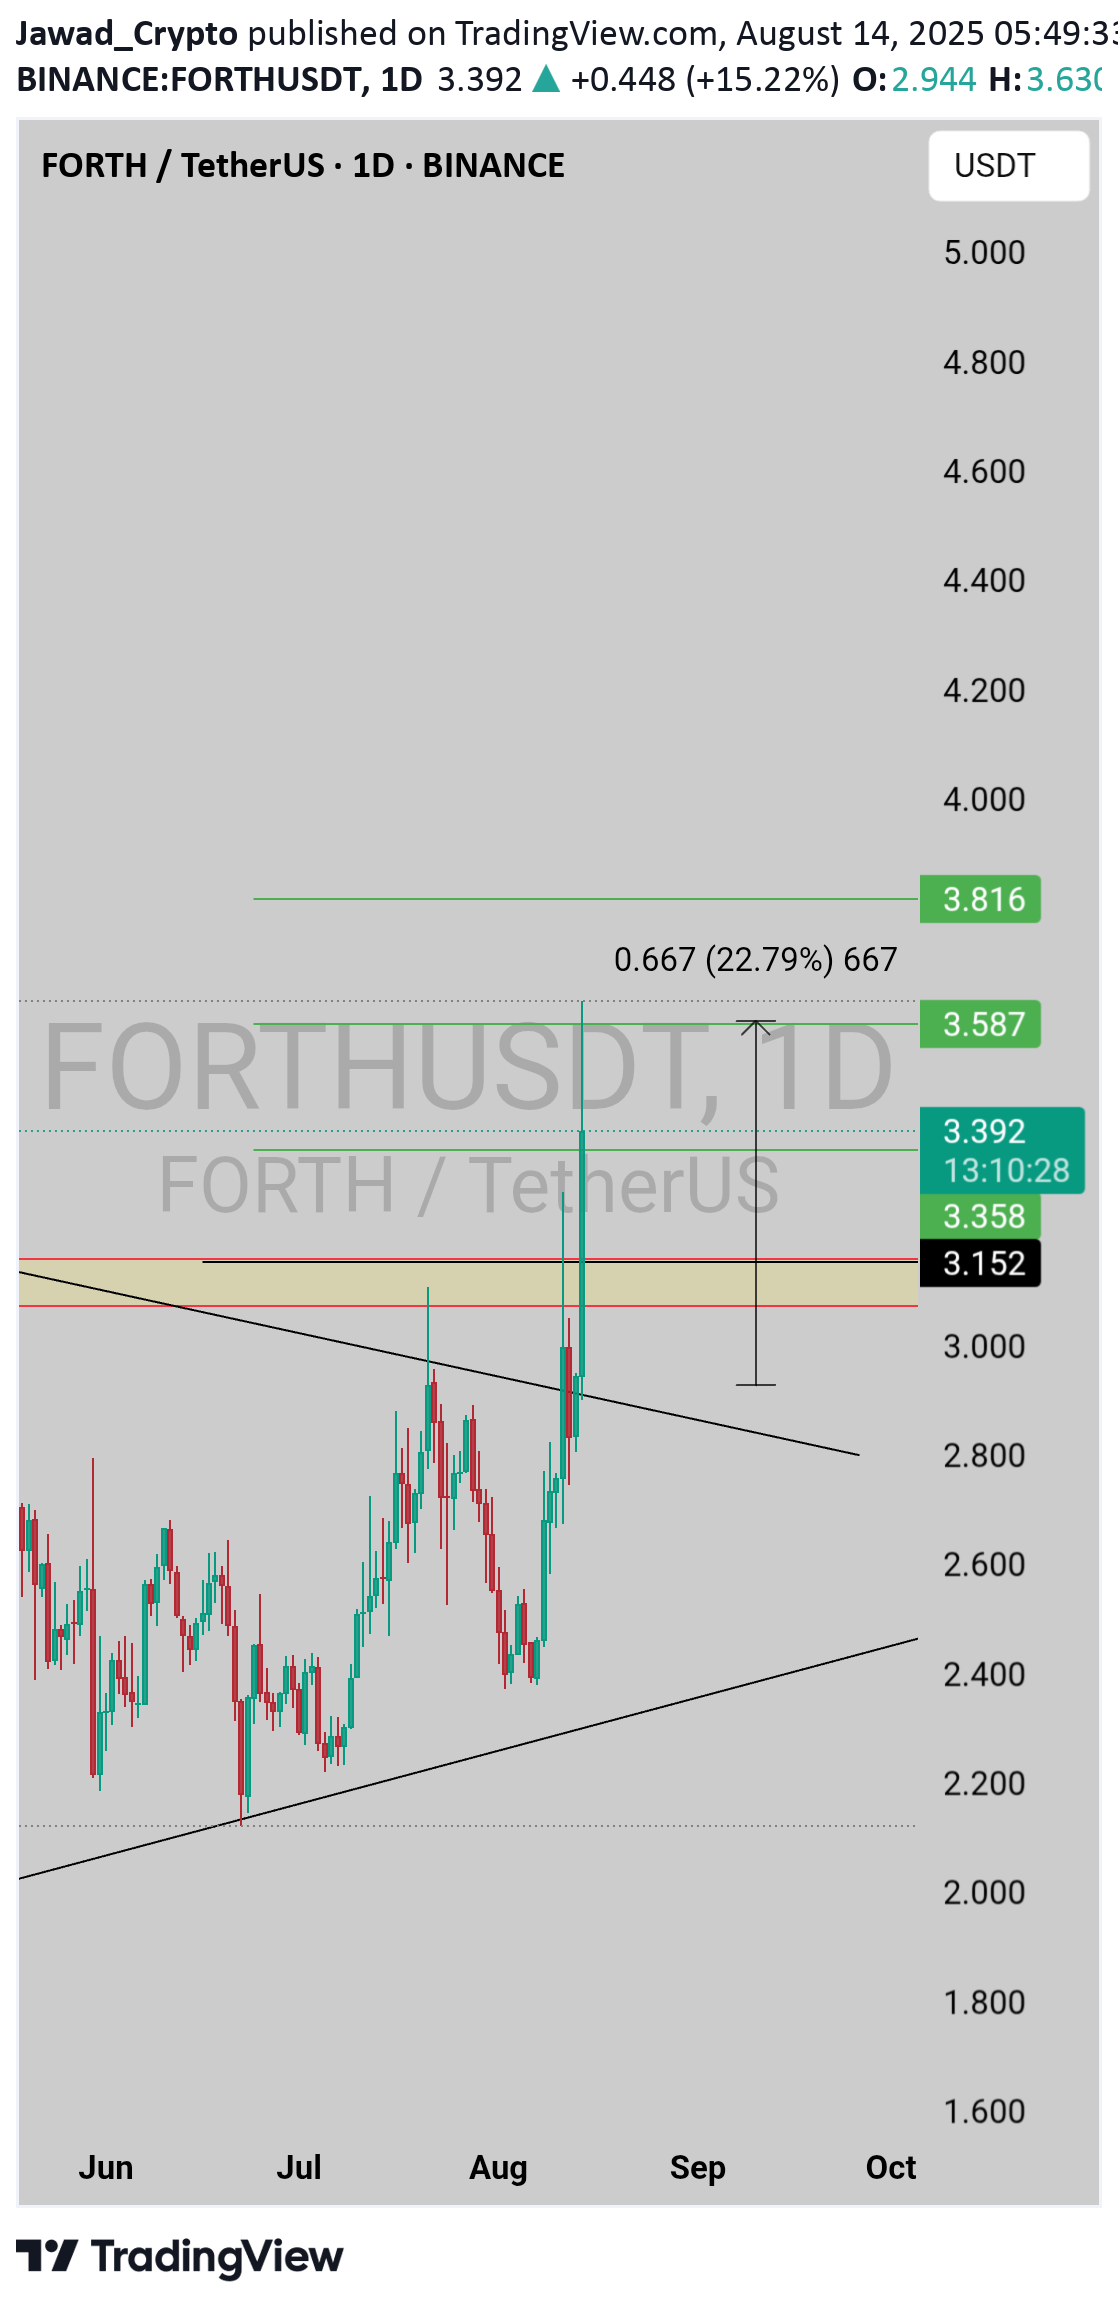
two targets hitted successful. Good setup always give return. I post this setup on telegram and X.

Crypto-by-PRIME
FORTH / USDT : Trendline breakout

FORTH has successfully broken out of a multi-month descending triangle pattern on the daily chart. This breakout is a significant development, as the price had been consolidating and forming lower highs since May. The recent strong bullish candle has closed above the upper trendline of the triangle, confirming the breakout. The measured move target for this pattern is indicated on the chart, pointing towards a potential price target of around $4.10. Key Points: * Breakout Confirmed: The daily close above the descending trendline validates the bullish move. * Target: The measured move suggests a potential target of $4.10, which would represent a substantial gain from the current level. * Support: The previous resistance trendline should now act as a support level. Any retest of this line could be seen as a buying opportunity. This breakout indicates a potential shift in momentum from bearish consolidation to a new bullish trend.

CryptoAnalystSignal
#FORTH (SPOT) to ( 2.5 $ ) ?
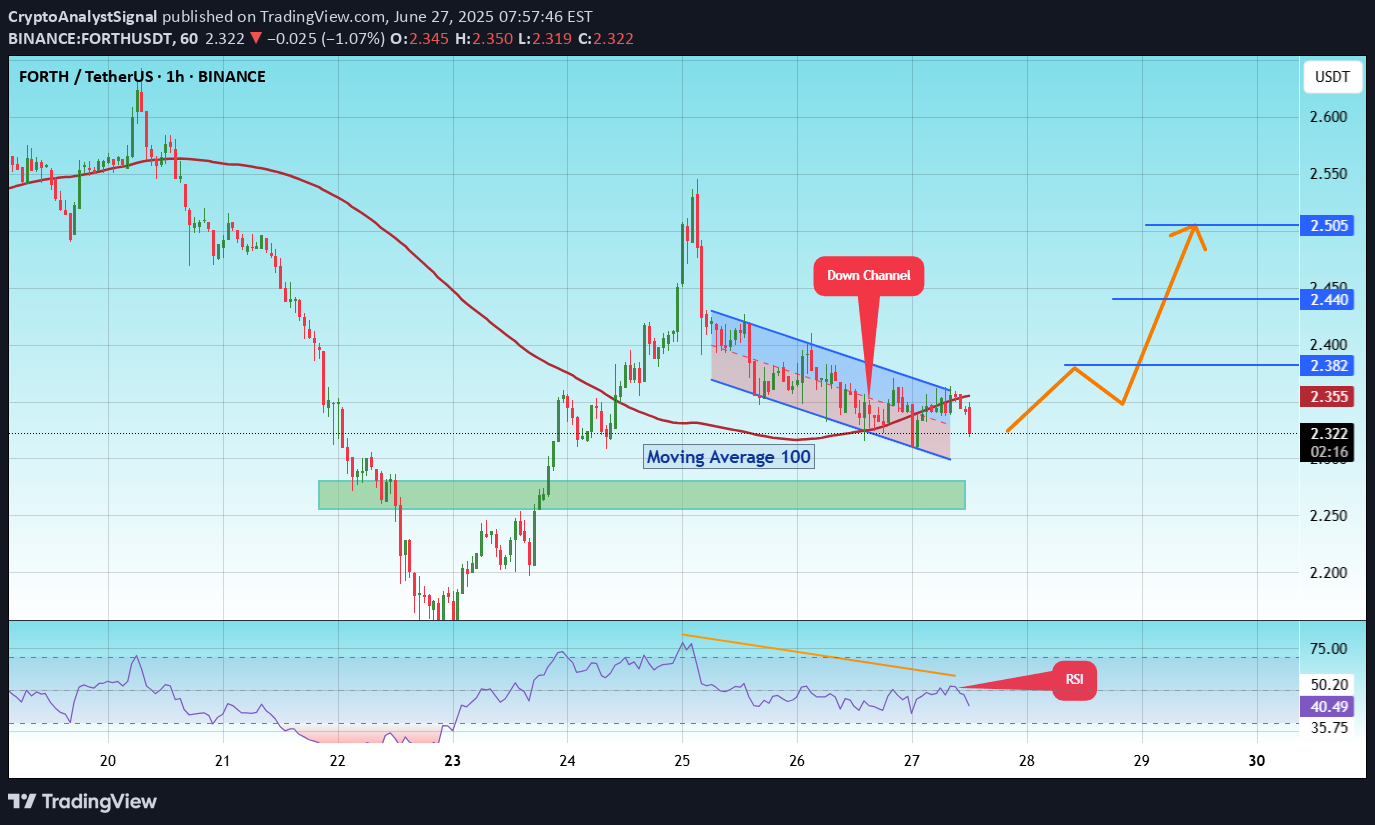
#FORTHThe price is moving within a descending channel on the 1-hour frame and is expected to break and continue upward.We have a trend to stabilize above the 100 moving average once again.We have a downtrend on the RSI indicator that supports the upward break.We have a support area at the lower boundary of the channel at 2.300, acting as strong support from which the price can rebound.We have a major support area in green that pushed the price higher at 2.260.Entry price: 2.335First target: 2.380Second target: 2.440Third target: 2.500To manage risk, don't forget stop loss and capital management.When you reach the first target, save some profits and then change the stop order to an entry order.For inquiries, please comment.Thank you.
Bithereum_io
FORTHUSDT 1D
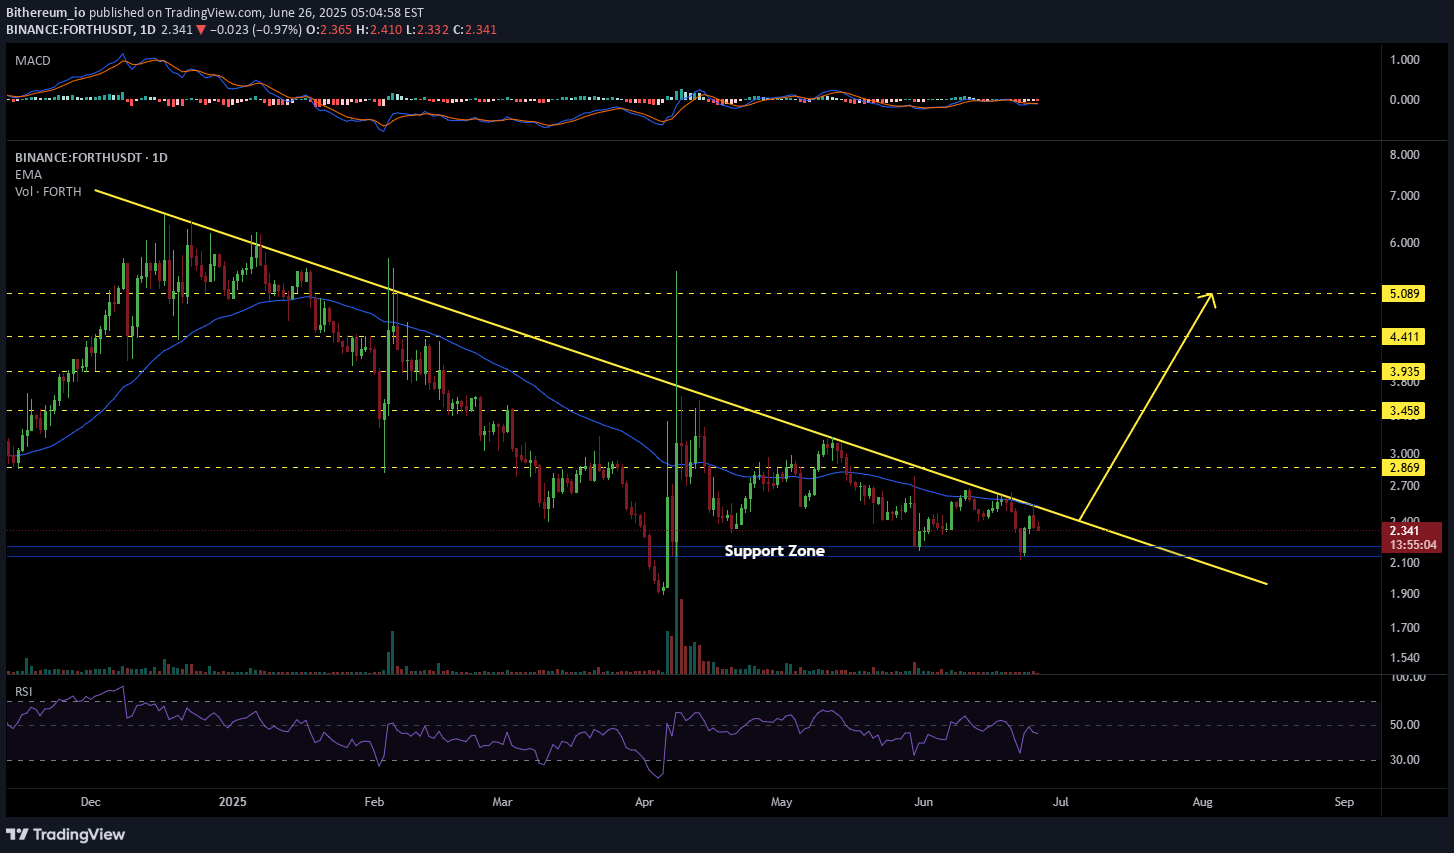
#FORTH is trading near the descending resistance.Consider buying here and near the support zone.In case of a breakout above the descending resistance and the daily EMA50, the targets are:🎯 $2.869🎯 $3.458🎯 $3.935🎯 $4.411🎯 $5.089⚠️ Always use a tight stop-loss to manage risk and protect your capital.

anilcansalgar
FORTH 4sa Omuz Baş Omuz Formasyonu

+ There is a possibility of falling from here very close to the resistance of the falling trend in the diary. After breaking the support of 4 hours of support, it can give a reaction from the 2nd 4th support and retest.

MasterAnanda
Ampleforth 200%+ Bullish Breakout Explained & 267% Target

In April, FORTHUSDT produced a 200%+ bullish breakout in just three days. The market has been sideways since, consolidating and this consolidation means preparation before the next move which can be something similar. The market is clearly bullish because of the higher low.The major burst upward in early April confirms the bottom is in. A confirmed bottom once more simply means that Ampleforth is bullish; bullish means that the next major move is not a breakdown (drop) but a bullish jump. This is all confirmed based on the action from the past two months.Knowing this, we can take action with a simple strategy of buy and hold. We buy waiting for the next market move to develop. When the market turns green, we collect profits and move on. Repeat the same process over and over, and watch your capital grow.It doesn't matter how long it takes, patience is key; what matters is to be prepared to wait for as long as it takes. If you can wait 2 weeks, 3 weeks or 6 months, you can end up with a win. Some pairs will move in a matter of days, others in a matter of months. If you can't predict which one will move next, you can use a diversification strategy. Just be prepare to win some, lose some. Not all trades can be won. But if wait for the winners to become big and keeping the losers small, that's a recipe for success.Plan ahead of time.There are countless ways to approach the market. It all depends on your trading style, your trading goals, your capital and risk tolerance... The only way to lose is to give up.Perseverance is key.Comeback for more.Namaste.

alirazamonad
Forthusdt.p

According to chart pattern forthusdt is seems to be bullish ...
Disclaimer
Any content and materials included in Sahmeto's website and official communication channels are a compilation of personal opinions and analyses and are not binding. They do not constitute any recommendation for buying, selling, entering or exiting the stock market and cryptocurrency market. Also, all news and analyses included in the website and channels are merely republished information from official and unofficial domestic and foreign sources, and it is obvious that users of the said content are responsible for following up and ensuring the authenticity and accuracy of the materials. Therefore, while disclaiming responsibility, it is declared that the responsibility for any decision-making, action, and potential profit and loss in the capital market and cryptocurrency market lies with the trader.