
ERA
Caldera
| تریدر | نوع سیگنال | حد سود/ضرر | زمان انتشار | مشاهده پیام |
|---|---|---|---|---|
No results found. | ||||
Price Chart of Caldera
سود 3 Months :
سیگنالهای Caldera
Filter
Sort messages by
Trader Type
Time Frame

Osang
سرمایهگذاری در ERA: آیا فرصت سود از دست رفته است؟ (فومو نکنید!)

Peter from NVIDIA to ERA could be something could be everything NFA not fiaicial advice

miljedtothemoon
تحلیل ERAUSDT.P: سقوط احتمالی به زیر ۰.۲۲۷۱ - آیا روند نزولی ادامه دارد؟
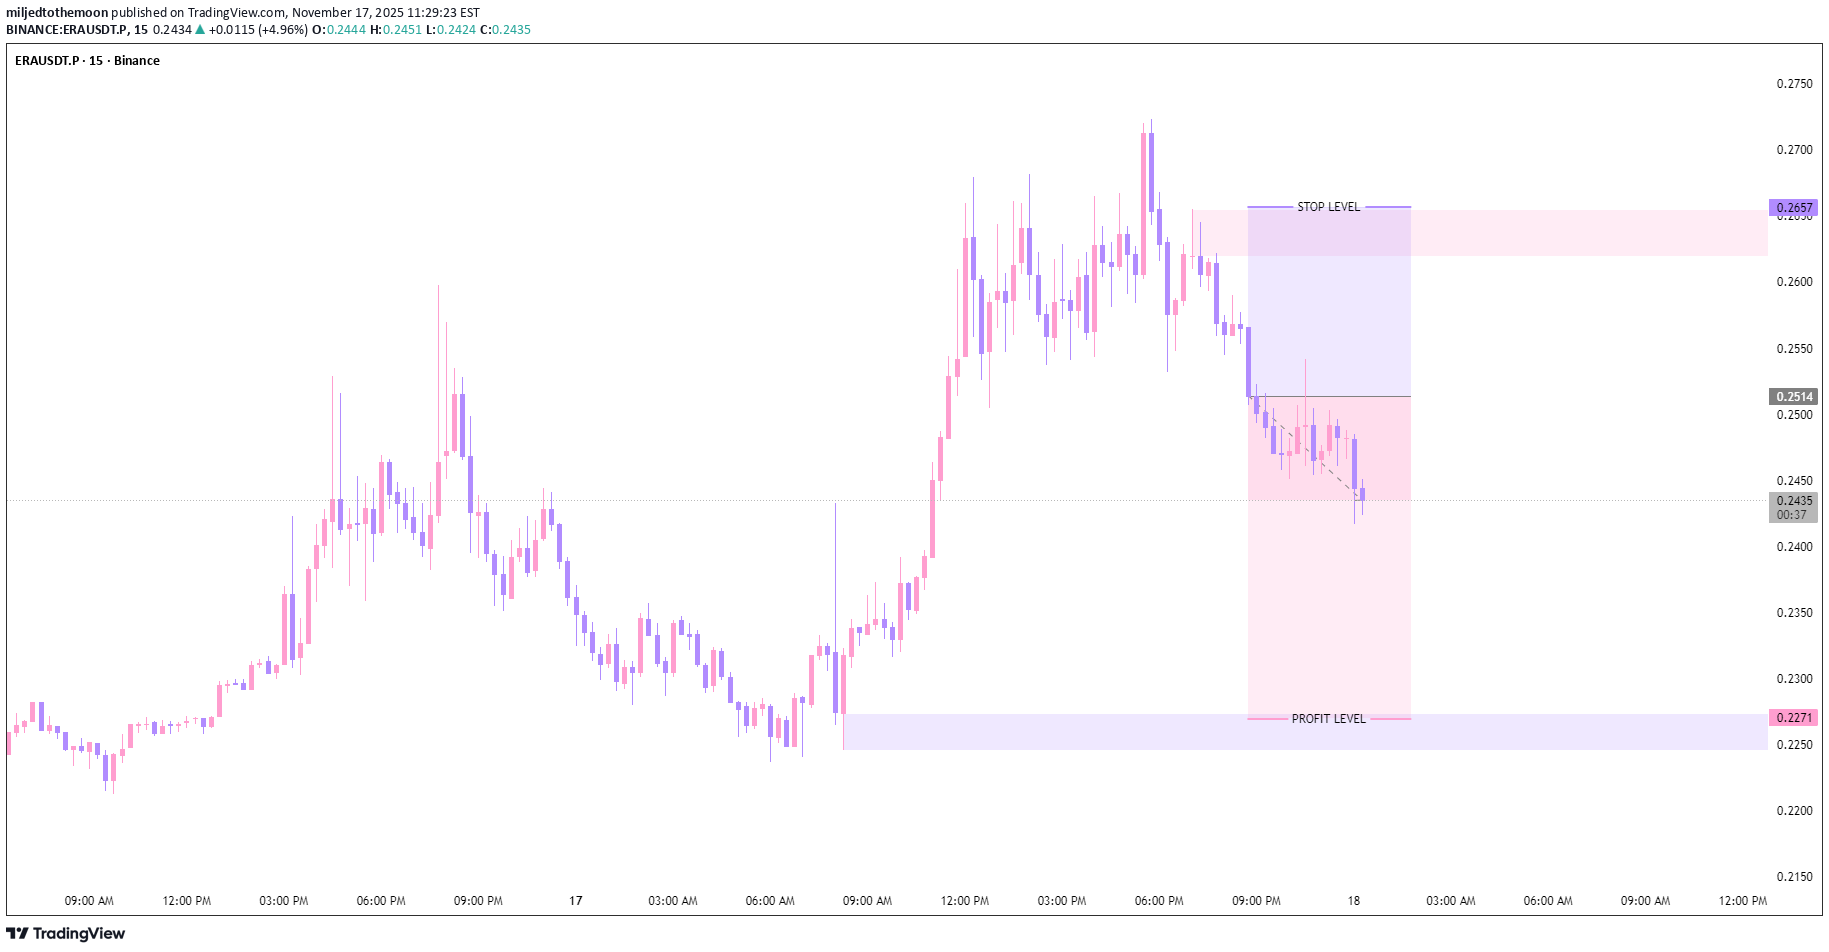
Price is pulling back from the resistance area near 0.2657 and continuing a short-term downtrend toward the next major support around 0.2271. The structure shows consistent lower highs, indicating bearish momentum.Profit level reached.

BandForBands
سقوط تاریخی یا جهش ۱۶۰ درصدی؟ راز بزرگ پشت قیمت $ERA که نباید از دست داد!
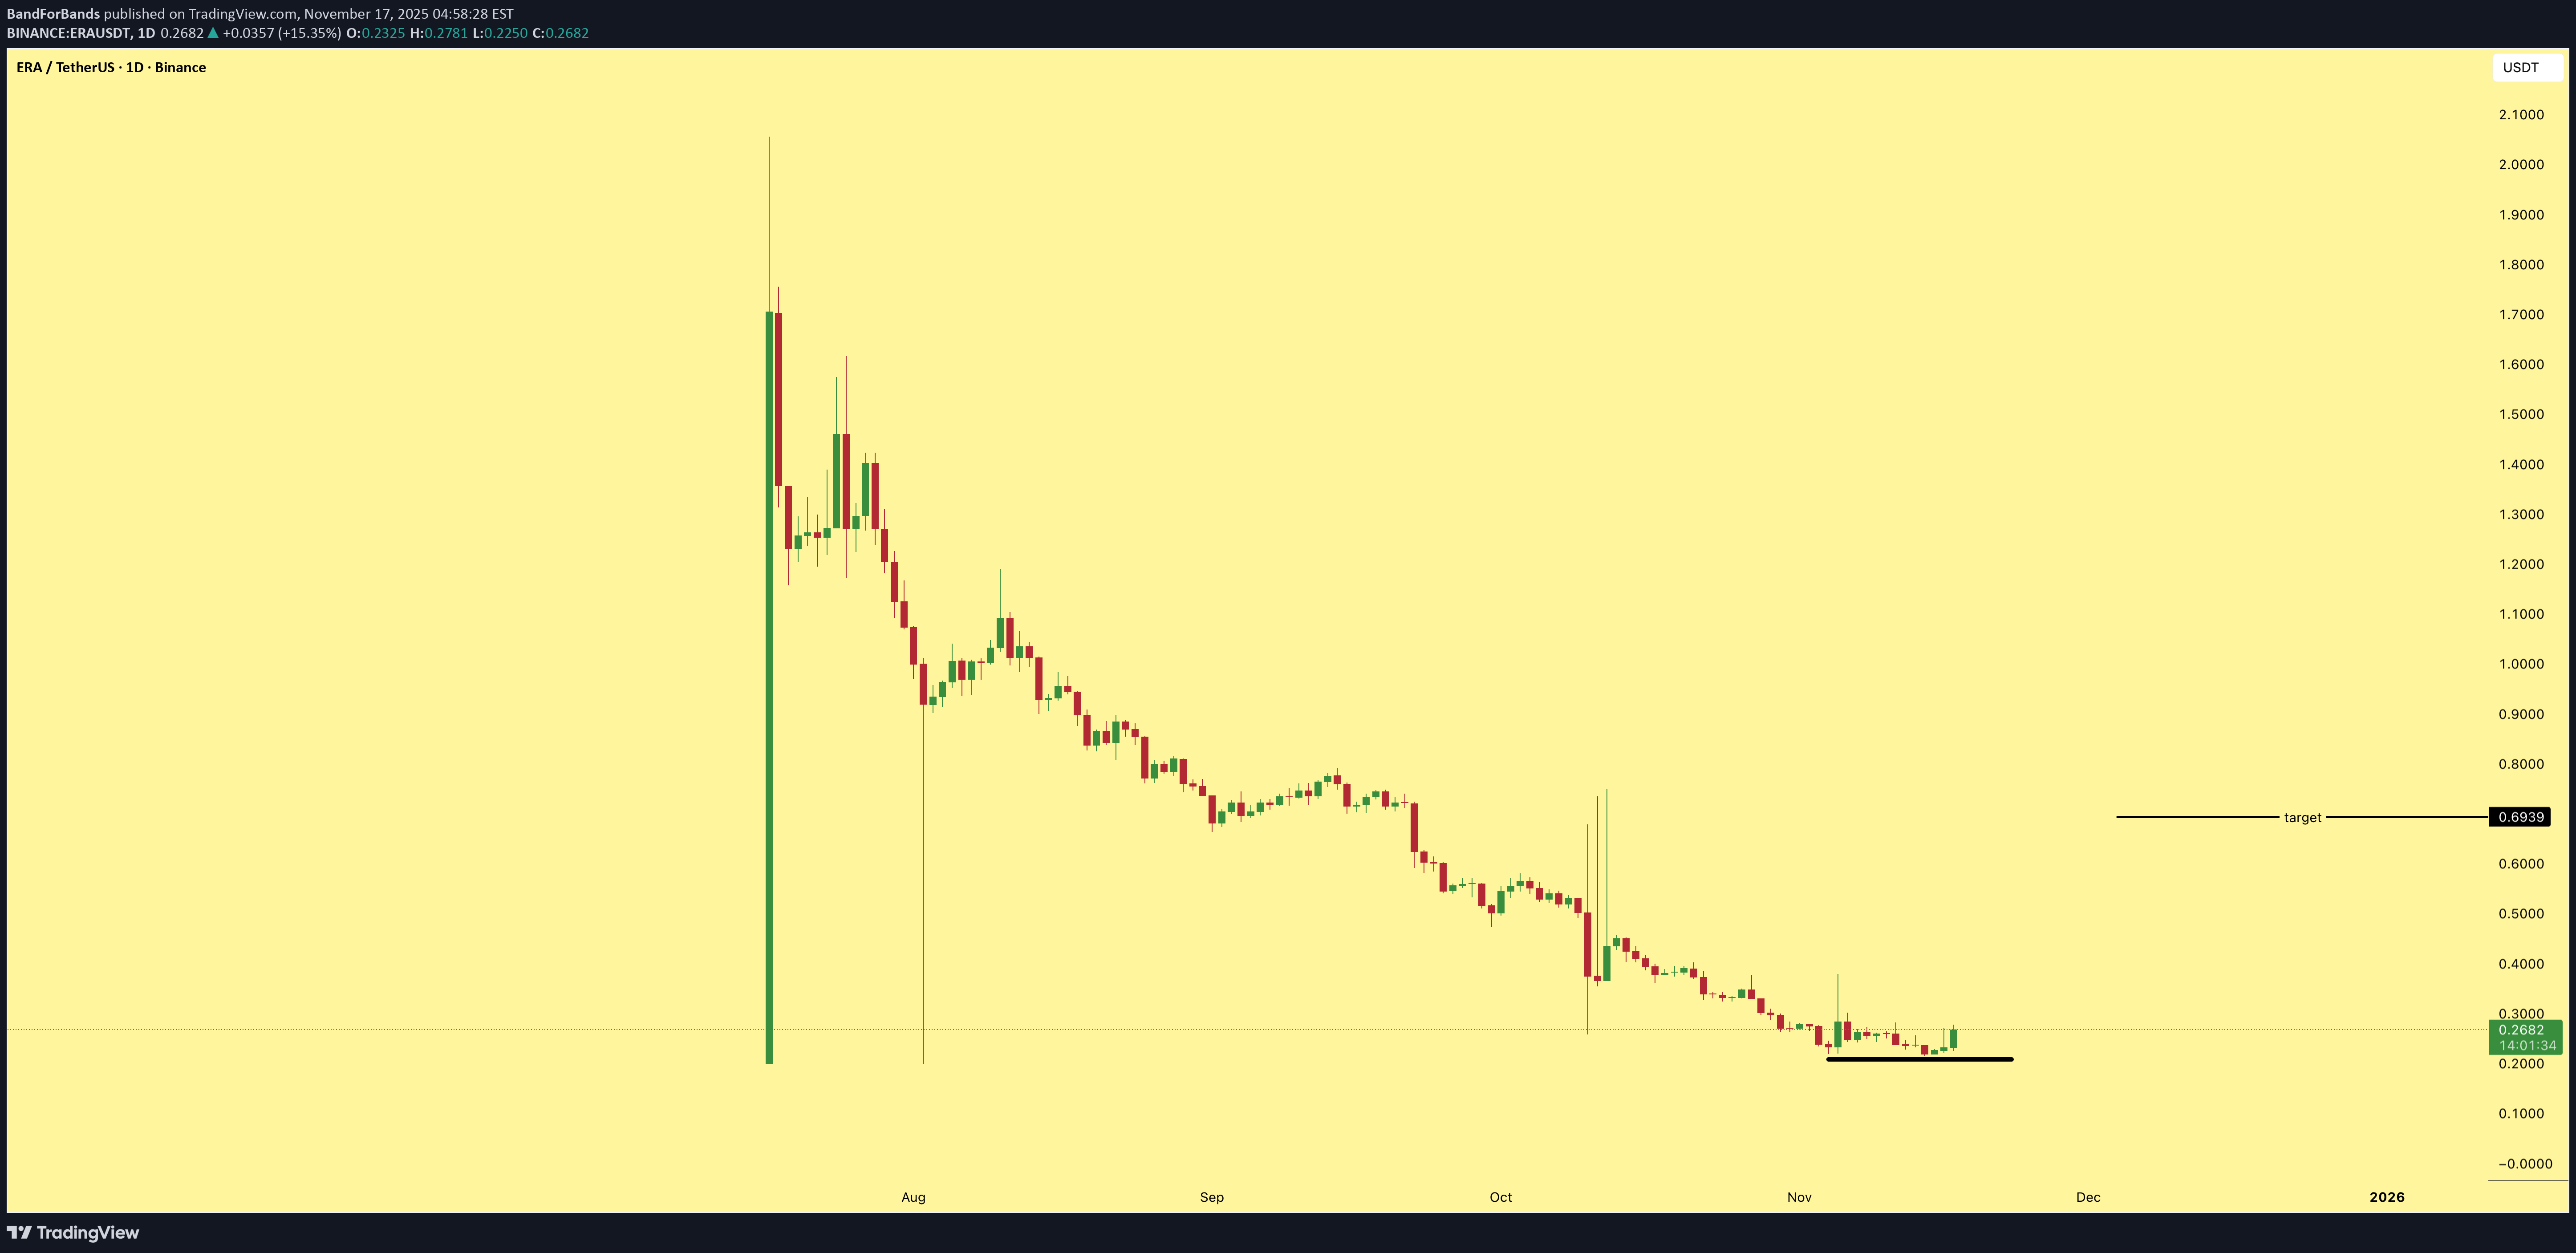
Bottom looks in for $ERA. The structure is holding well and momentum is starting to shift. From here there is a potential 160 percent move to the upside once the breakout begins.

TradingOn
سیگنال خرید قدرتمند ERA/USDT: فرصت صعود بزرگ با احتمال بازگشت سقف در بیتگت فیوچرز!
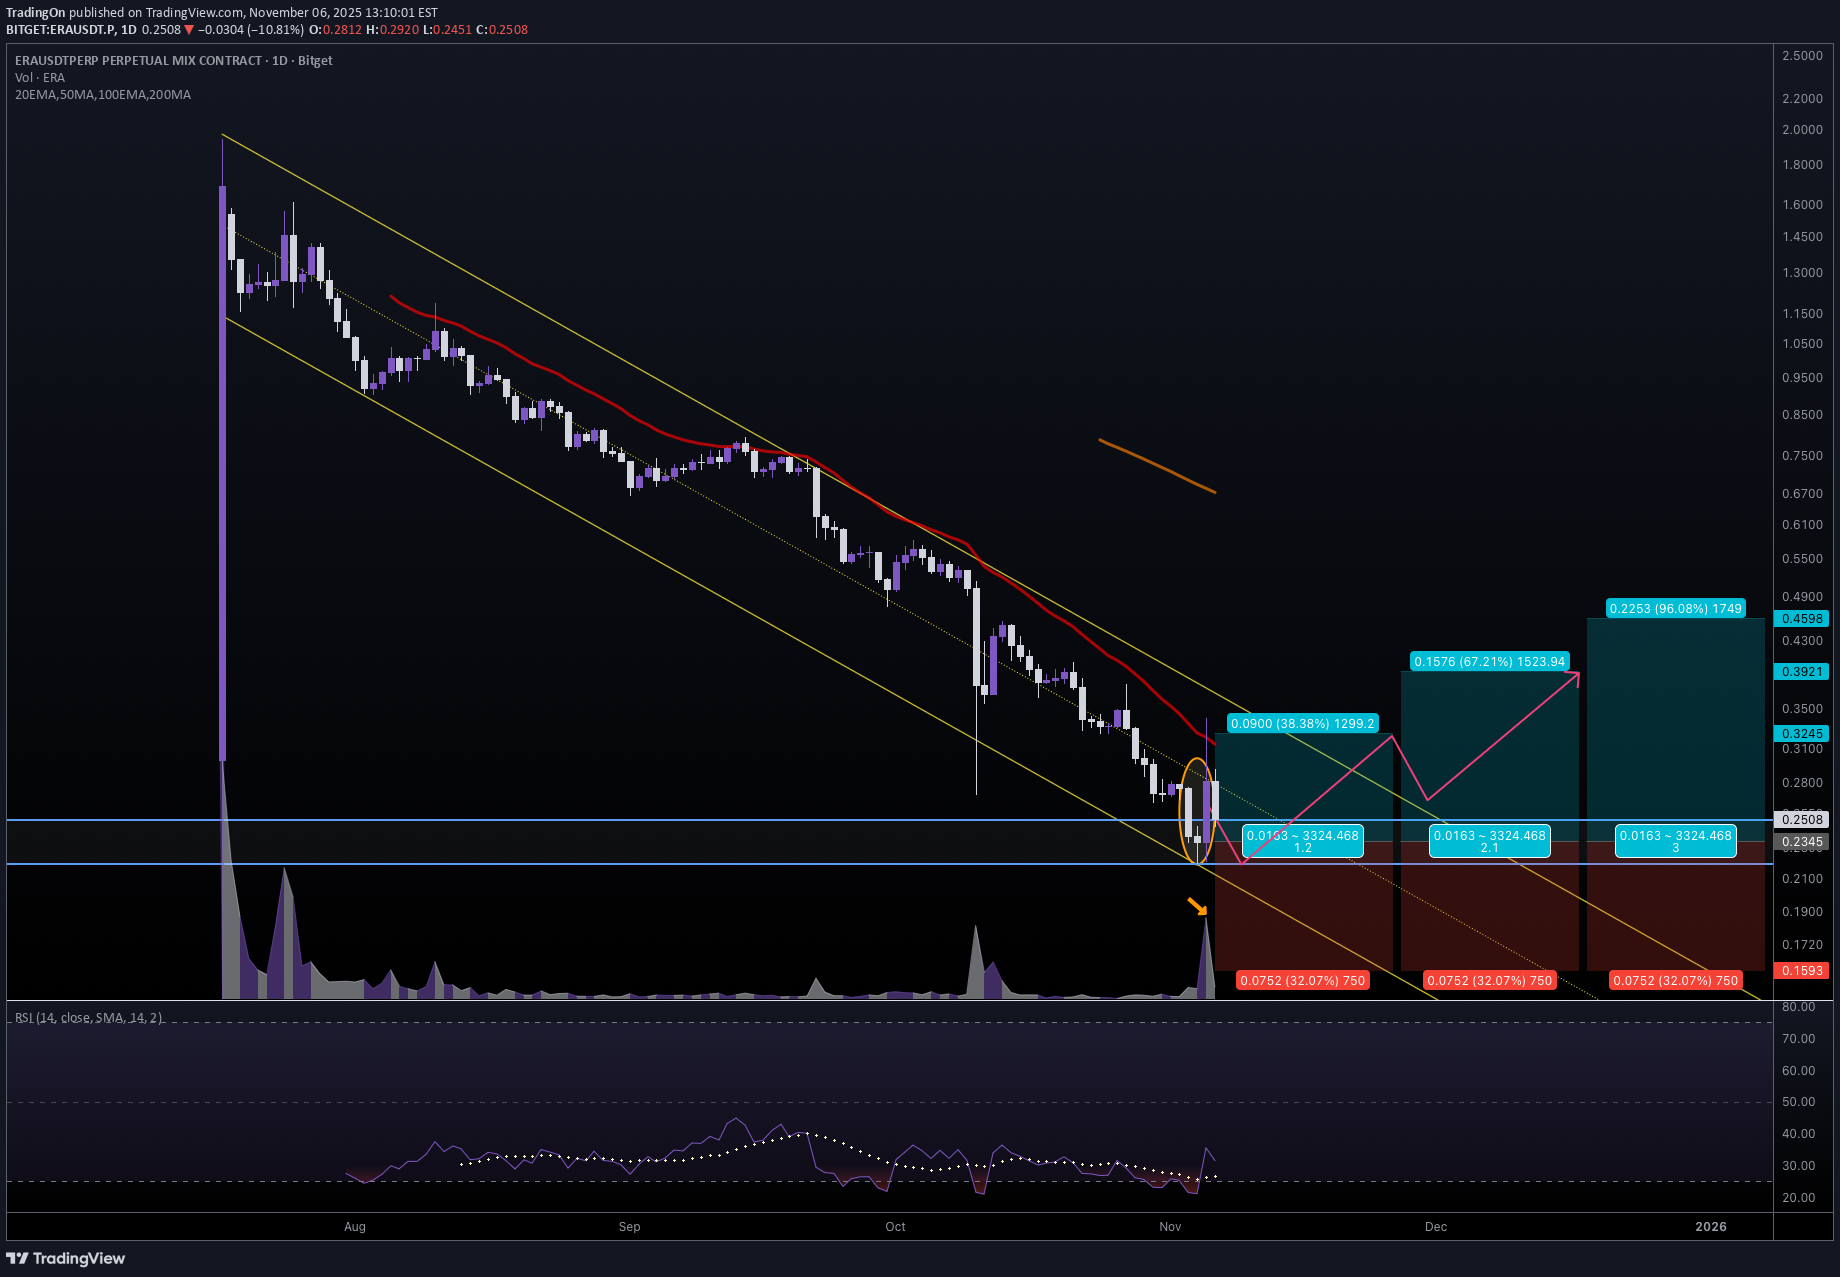
Caldera just printed a morning star on daily with good bounce back volume, bottom seems likely. ⚡️⚡️ #ERA/USDT ⚡️⚡️ Exchanges: Bitget Futures Signal Type: Regular (Long) Leverage: Isolated (1.3X) Amount: 4.8% Current Price: 0.2508 Entry Zone: 0.2503 - 0.2187 Take-Profit Targets: 1) 0.3245 2) 0.3921 3) 0.4598 Stop Targets: 1) 0.1593 Published By: @Zblaba ERA ERAUSDT.P #1D #Caldera #RaaS #Rollups #DeFi caldera.xyz Risk/Reward= 1:1.2 | 1:2.1 | 1:3.0 Expected Profit= +49.9% | +87.4% | +124.9% Possible Loss= -41.7% Estimated Gaintime= 1-2 monthsAll entries filled ERAUSDT.P Entered entry zone ✅ Period: 2 Hours 3 Minutes ⏰ ERA bounced back on support and seems to have broken out already.

vipsy6
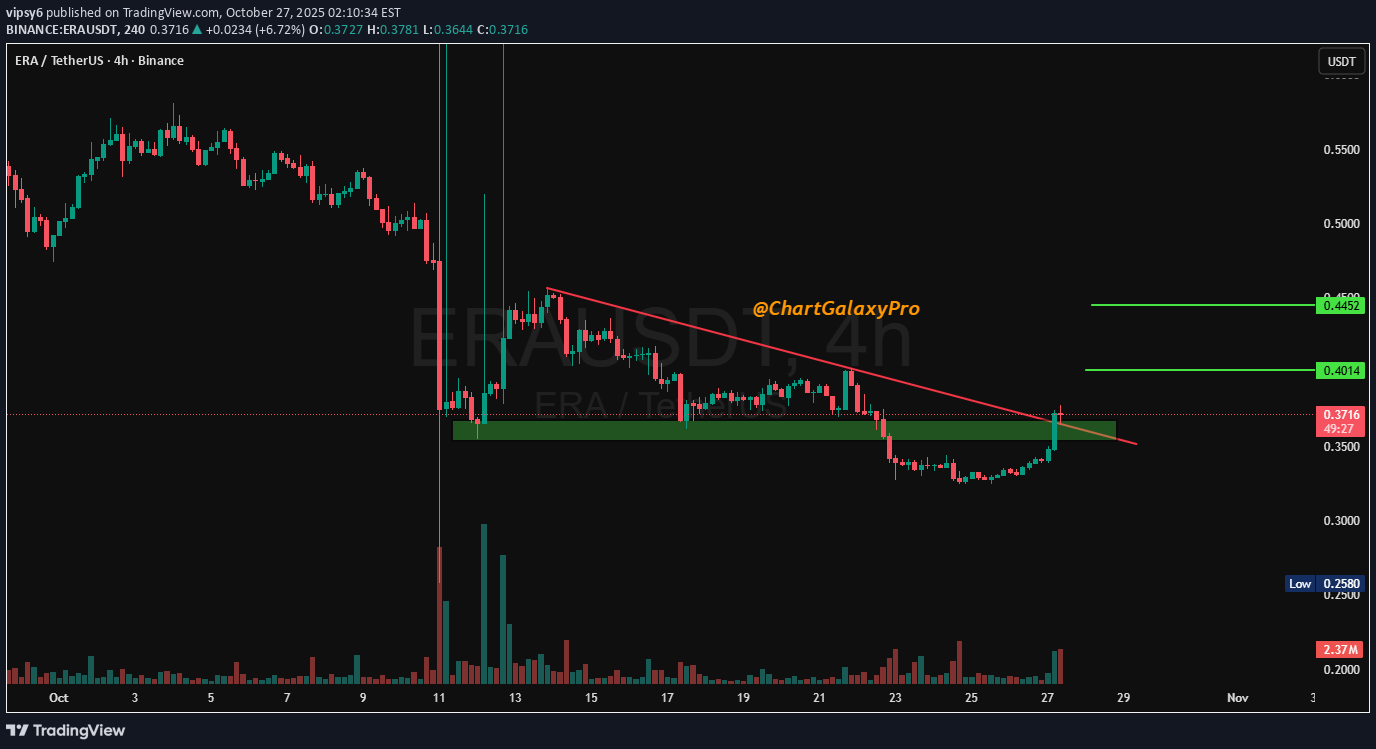
تحلیل 4 ساعته ERA: شکست خط روند و اهداف قیمتی احتمالی!

Captain-MAO
ERA/USDT – Base Support Formed & Reversal Setup
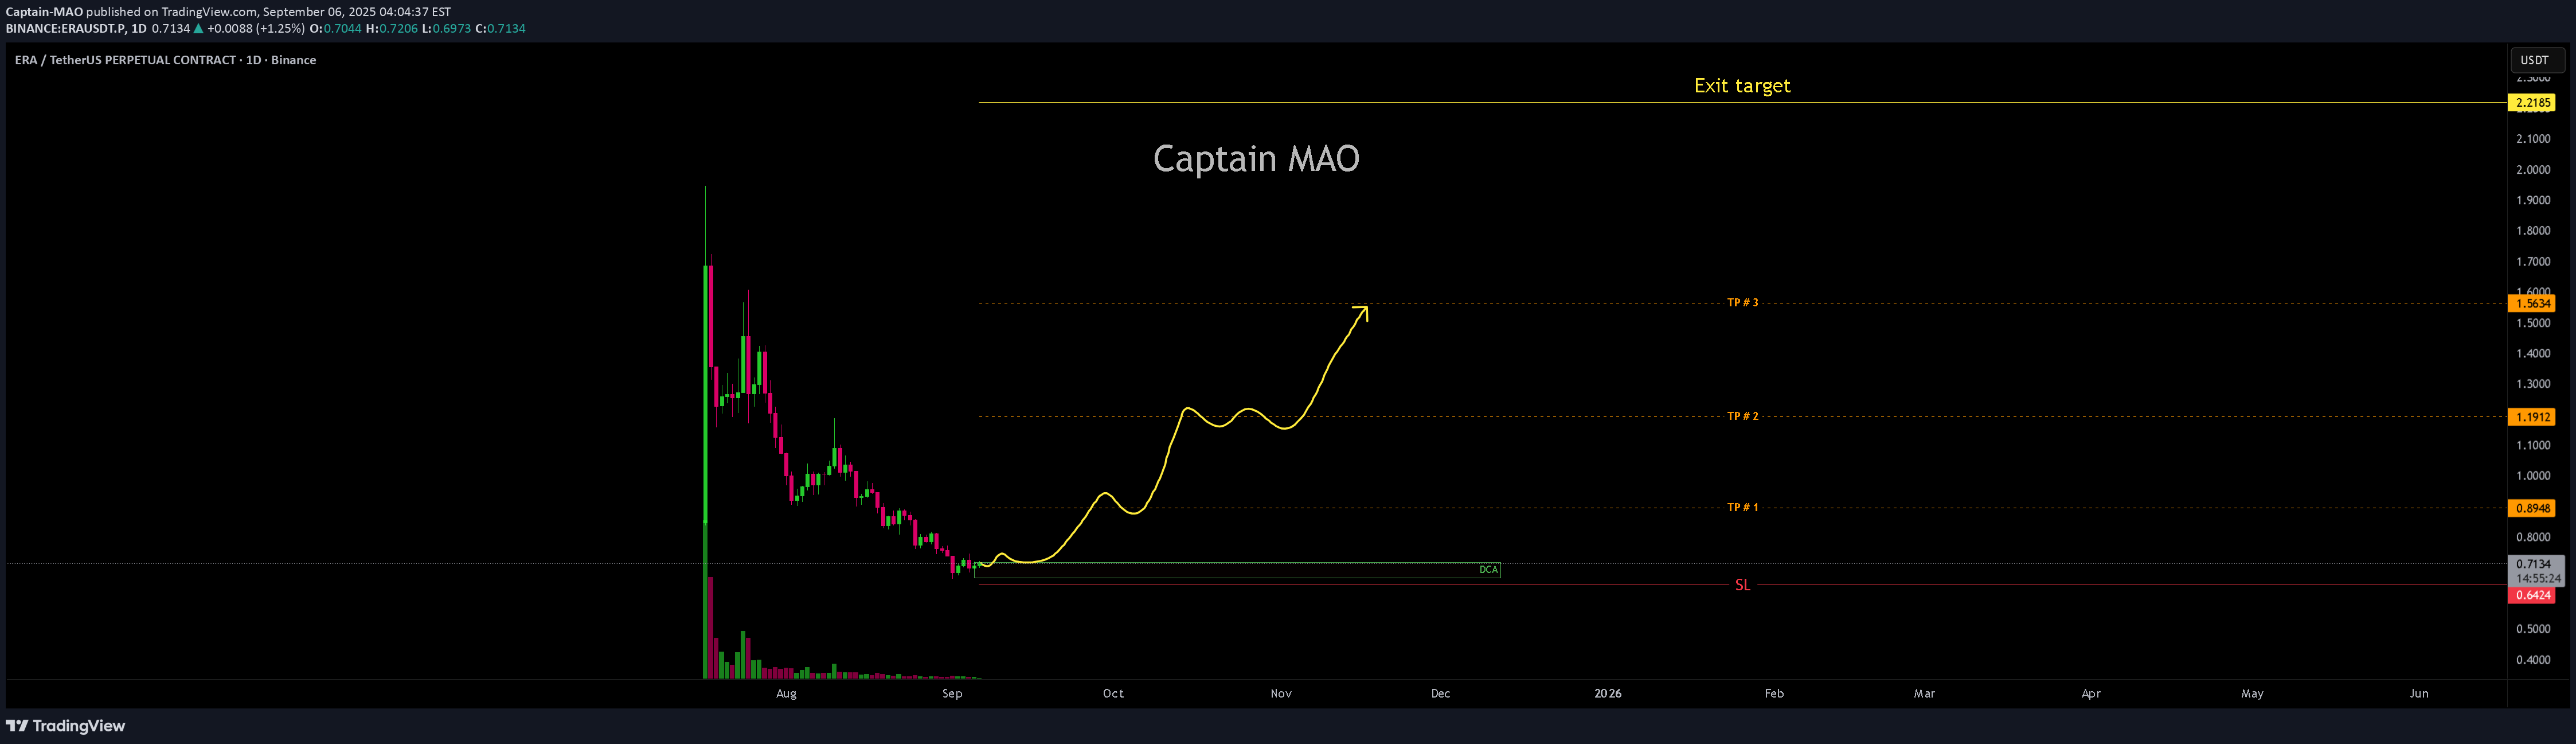
After a prolonged correction, ERA/USDT is finally showing signs of stability as price begins to form a solid base support. This consolidation zone is creating a favorable area for DCA entries inside the green box, offering excellent risk-to-reward positioning. Price action is now signaling early signs of reversal, with buyers stepping in to defend support and gradually building bullish momentum. If this structure continues to hold, the next leg up could target the previous top, with an extended move potentially reaching the $2.0–$2.2 zone.

AltcoinPiooners
Unveiling the $ERA Reversal A Deep Dive into the Chart Opportuni

ERAUSDT Unveiling the ERA Reversal: A Deep Dive into the Chart Opportunity Price Action Description Historical Trend: The price began around 1.20 USDT in late July, with initial choppy movement. A sharp decline in early August dropped it to 0.50-0.60 USDT, followed by a brief recovery to 0.80-1.00 USDT in mid-August. Another steep fall occurred in late August/early September. Recent Movement: A massive red candlestick around September 1 marks a vertical drop from 1.00-1.10 USDT to 0.60-0.70 USDT, suggesting a capitulation event or flash crash. The price has stabilized around 0.682 USDT as of 11:03 PM CEST, with smaller candles indicating reduced volatility or exhaustion. Current Price: Approximately 0.682 USDT, down 40-50% from July highs, hinting at potential oversold conditions. Volatility: High, evident from long wicks and large candle bodies, especially during drops, though volume data is absent. Key Technical Levels Entry: Set at 0.6750 USDT, the suggested point to enter a long position, slightly below the current price of 0.682 USDT, anticipating a small pullback before confirming the trade. TP (Take Profit): Targets are 0.7858 USDT for the first profit take, followed by 0.8727 USDT, 0.9338 USDT, and the highest goal at 1.1925 USDT, offering a range of exit points for potential gains. DCA: Positioned at 0.6051 USDT, a level to add to the trade if the price drops further, helping to average down the entry cost. SL (Stop Loss): Placed at 0.5342 USDT, the cutoff to exit the trade if the price falls, limiting losses and protecting the position. Fibonacci Context: These levels appear derived from a downward Fibonacci extension (e.g., -0.618, -0.786) based on the recent drop from 1.20 to 0.50 USDT, suggesting a potential reversal zone. The setup implies a long trade anticipating a bounce. Risk-Reward: Risk from 0.6750 to 0.5342 is 0.1408 USDT, with rewards to 0.7858 (0.1108, RR 0.8:1) and up to 1.1925 (0.5175, RR ~3.7:1), indicating a favorable setup if the reversal occurs. Indicators Analysis RSI (Relative Strength Index): Current value is 17.87, well below 30, signaling oversold conditions and a potential rebound. The line has trended down sharply with the price drop, showing waning momentum without visible bullish divergence yet. The RSI scale (0-100) marks overbought above 70, irrelevant here. Potential Trading Implications and Risks Bullish Case: The marked levels suggest a bottom-fishing opportunity post-crash, supported by oversold RSI. A rebound to take-profit levels is plausible if the broader crypto market stabilizes (e.g., Bitcoin trends) or if positive news emerges for ERA (e.g., gaming ecosystem updates). Bearish Case: The dominant downtrend and recent sharp drop indicate strong selling pressure. Breaking below 0.6051 (DCA) or 0.5342 (SL) could lead to further declines toward 0.40-0.50 USDT. Market Context: As of 11:03 PM CEST on September 1, 2025, check for recent events—token unlocks, hacks, or macro factors like interest rate changes affecting risk assets. Risks: High altcoin volatility, lack of volume data (limiting liquidity insight), and subjective Fib levels. Use risk management (e.g., 1-2% account risk). Suggestions: Confirm with bullish patterns (e.g., hammer or engulfing) at 0.6750 or RSI crossing above 30.ENTRY 0.6750 TARGET SCALP ✅ +8.43% PROFIT 🏋️♂️ The harder you work for something, the greater you’ll feel when you achieve it. Interested for Premium 👉 t.me/Altcoin_Piooners Follow for signals! 🔥#Crypto #Trading #CryptoSignals #ERA #Altcoins

abuzer0234
pozitif hareket üzel kazanç
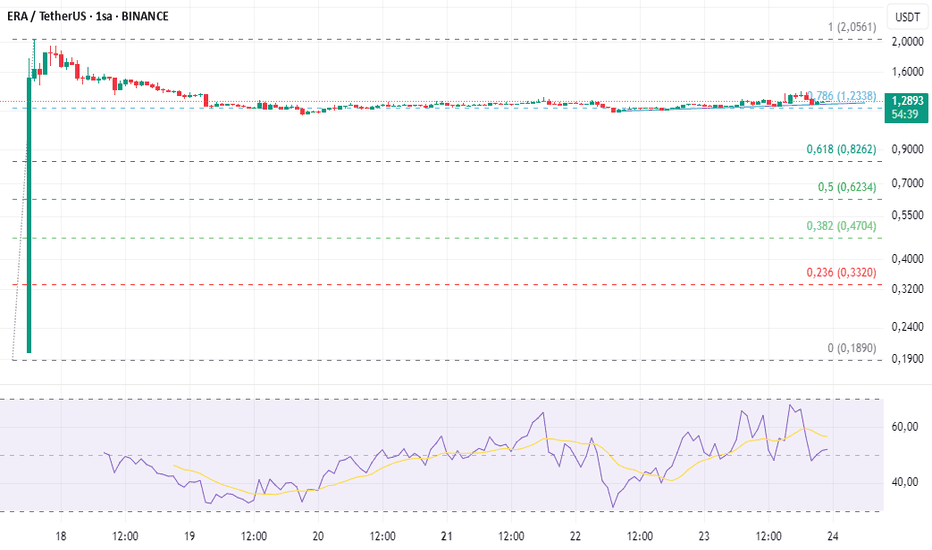
This new crypto 1.28 levels of at least 3x promises beautiful earnings. I will stay in the process for 4 days ... YTD
Disclaimer
Any content and materials included in Sahmeto's website and official communication channels are a compilation of personal opinions and analyses and are not binding. They do not constitute any recommendation for buying, selling, entering or exiting the stock market and cryptocurrency market. Also, all news and analyses included in the website and channels are merely republished information from official and unofficial domestic and foreign sources, and it is obvious that users of the said content are responsible for following up and ensuring the authenticity and accuracy of the materials. Therefore, while disclaiming responsibility, it is declared that the responsibility for any decision-making, action, and potential profit and loss in the capital market and cryptocurrency market lies with the trader.