
DYDX
dYdX
| تریدر | نوع سیگنال | حد سود/ضرر | زمان انتشار | مشاهده پیام |
|---|---|---|---|---|
 SergioRichiRank: 1219 | خرید | حد سود: ۱٫۲۵ حد ضرر: تعیین نشده | 9/16/2025 | |
 CryptoNuclearRank: 1002 | خرید | حد سود: ۰٫۸۱۸۲ حد ضرر: تعیین نشده | 9/2/2025 | |
 CryptoWithJamesRank: 1613 | خرید | حد سود: ۲٫۴ حد ضرر: تعیین نشده | 17 hour ago | |
 Alpha-GoldFXRank: 499 | خرید | حد سود: ۱٫۱ حد ضرر: تعیین نشده | 8/24/2025 | |
 MasterAnandaRank: 30 | خرید | حد سود: ۲٫۷۲ حد ضرر: تعیین نشده | 8/1/2025 |
Price Chart of dYdX and dYdX Signal Trend
سود 3 Months :
Who made the most profit from dYdX?

WaveRiders2

sadraag

younes79
CryptoWithJames
CryptoNuclear
خلاصه سیگنالهای dYdX
سیگنالهای dYdX
Filter
Signal Type
Trader Type
Time Frame
CryptoWithJames
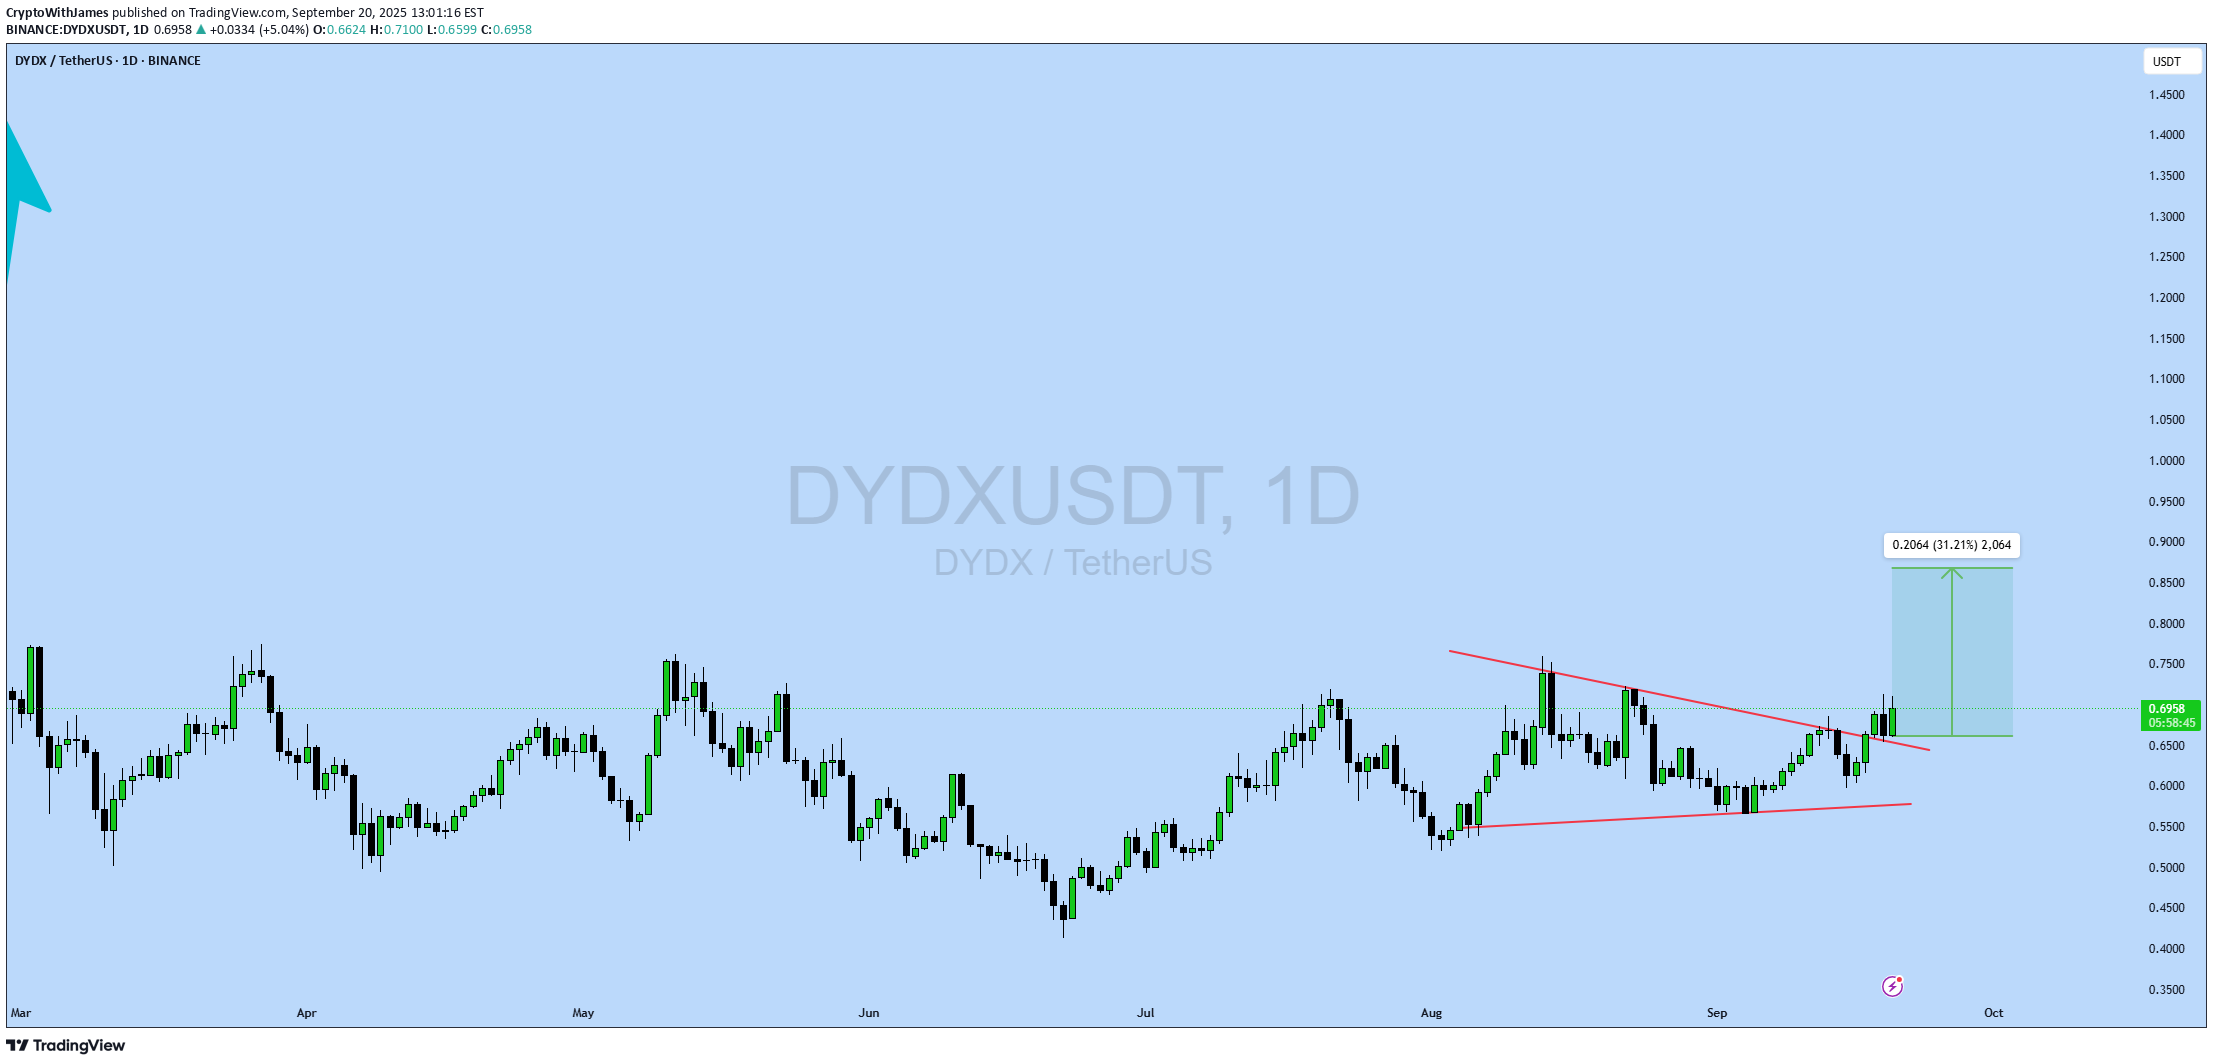
#DYDX UPDATE DYDX Technical Setup Pattern: Bullish Falling Wedge Pattern Current Price: $1.92 Target Price: $2.40 Target % Gain: 25.22% DYDX is breaking out of a falling wedge pattern on the 1D timeframe. Current price is $1.92 with a target near $2.40, showing about 25% potential upside. The breakout confirms bullish momentum with structure favoring continuation. Always use proper risk management. Time Frame: 1D Risk Management Tip: Always use proper risk management.

SergioRichi
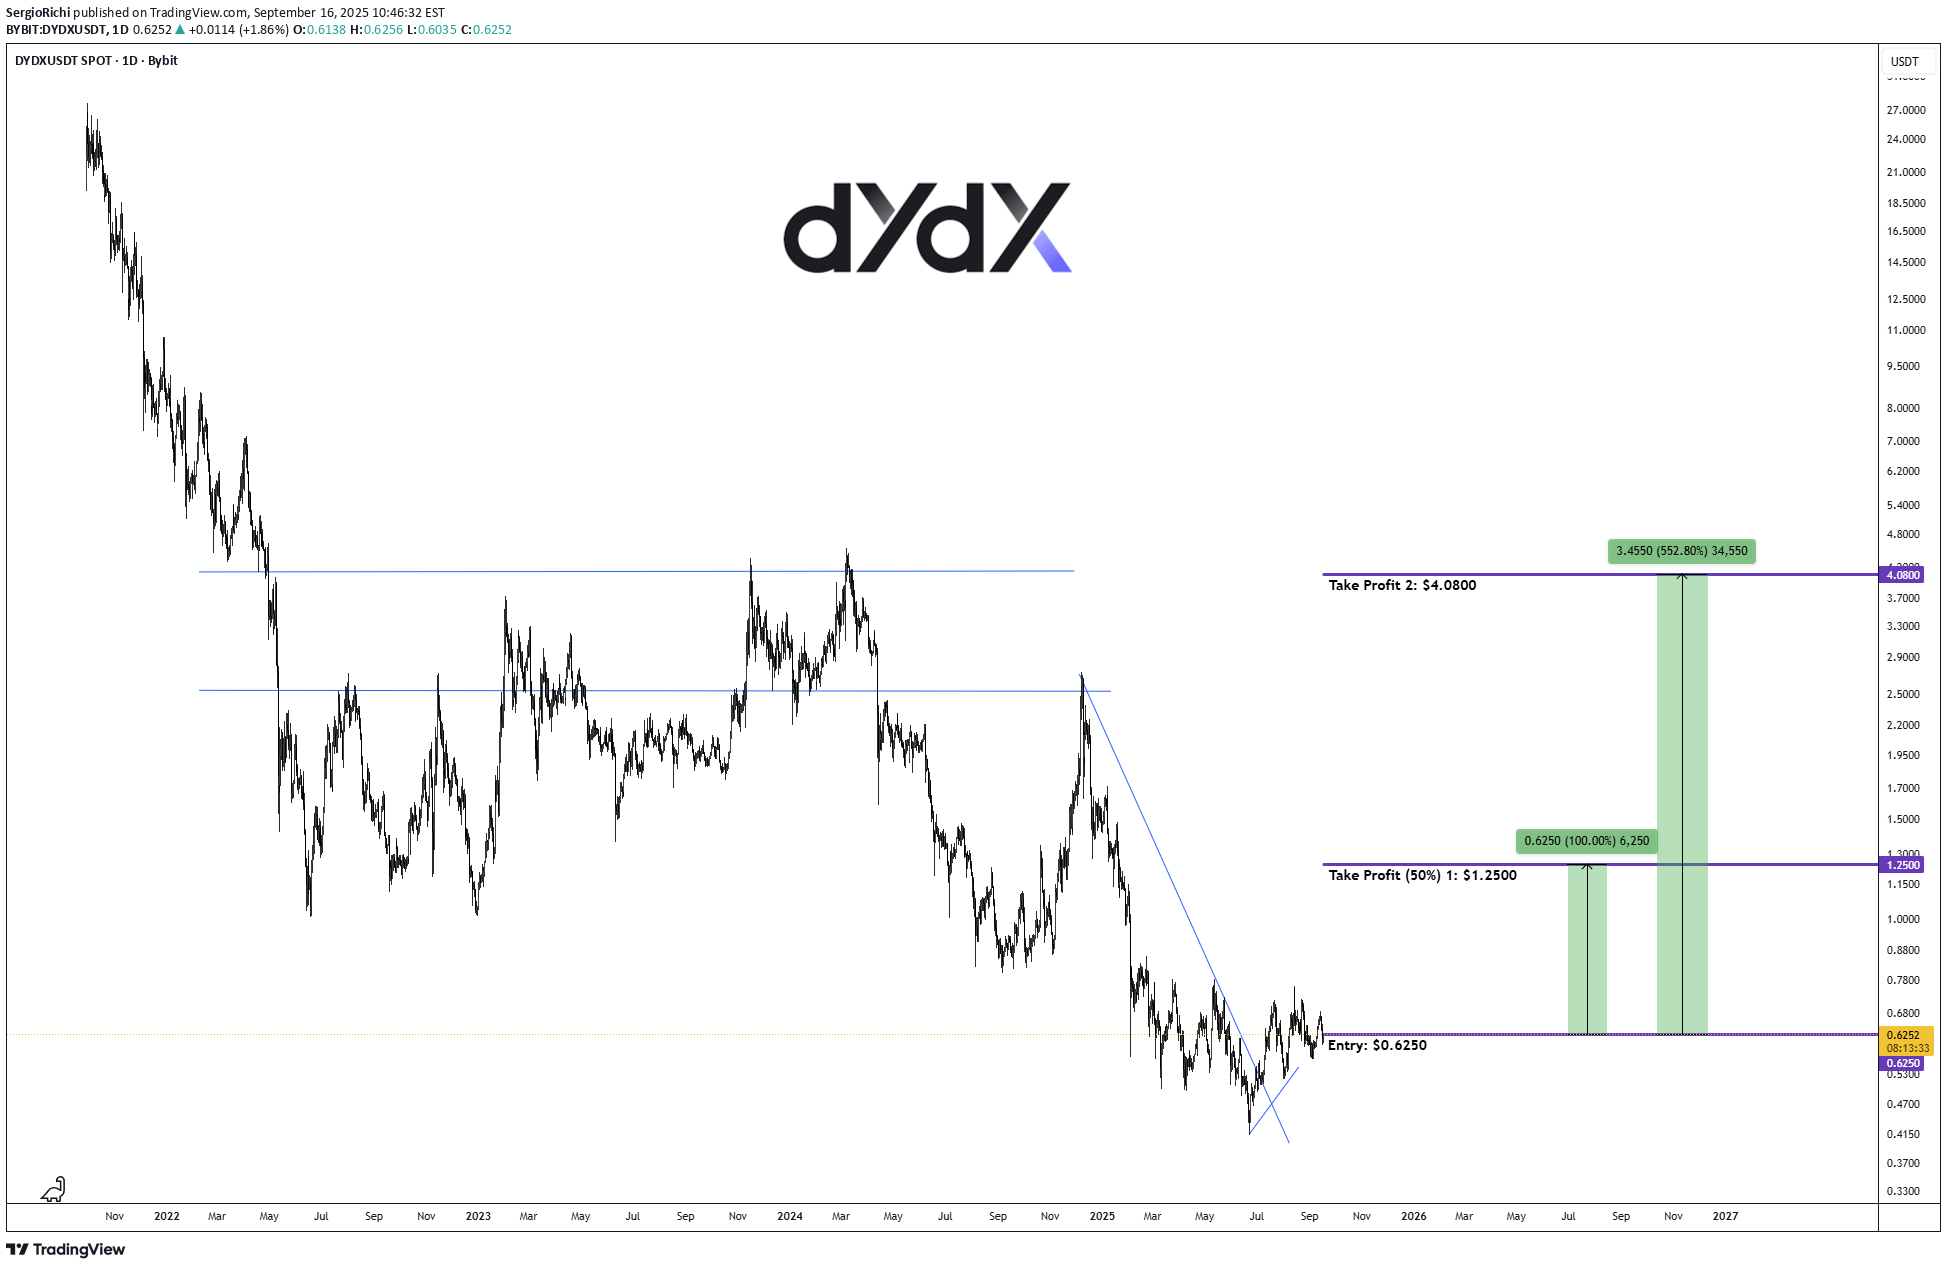
DYDX #Crypto — September 16, 2025. Price (Sept 16, 2025): $0.6250 Who’s in the Ring? DYDX's Top Competitors 🥊 DYDX rules the perp DEX space with its Ethereum L2 speed and zero-gas trades, but it's not alone in the octagon: • GMX (Key Strengths) : Low fees, multi-chain (Arbitrum/Avalanche), real-yield model ➖ Why DYDX Edges Them Out: DYDX offers better leverage (up to 20x) and governance perks; GMX lacks spot markets. • Hyperliquid (Key Strengths) : Lightning-fast execution, high-leverage perps, ecosystem grants ➖ Why DYDX Edges Them Out: DYDX's Telegram integration and ETP could steal retail thunder; Hyperliquid's still niche. • Vertex Protocol (Key Strengths) : Cross-margin, orderbook DEX, low latency. ➖ Why DYDX Edges Them Out: DYDX's community governance and upcoming upgrades give it broader utility; Vertex is newer. • ApeX Protocol (Key Strengths) : Privacy-focused, zk-rollups for speed. ➖ Why DYDX Edges Them Out: DYDX crushes on volume ($ billions traded) and institutional backing like the new ETP. • Drift (Key Strengths) : Solana-based, fast perps and lending. ➖ Why DYDX Edges Them Out: DYDX's Ethereum roots mean better DeFi composability; Solana outages hurt Drift's rep. If DYDX nails its upgrades, it could lap the field. Insider Scoops and Big Catalysts on Deck 🕵️♂️ • Telegram Trading Launch: Slated for late September 2025 – trade perps right in Telegram with seamless cross-platform execution and a growth incentive program. This could onboard millions of retail users, spiking volume like we saw with TON's mini-apps. • Major Chain Upgrade This Fall: Expect spot markets, $8M grants relaunch for devs, and Coinbase integration to supercharge liquidity. • Broader DeFi Boom: CEO's predicting a September surge, with DYDX positioned as the derivatives king amid rising institutional interest. Chart (1D): • bybit.com/en/trade/spot/DYDX/USDT?affiliate_id=46971&group_id=1452401&group_type=1 💡 Entry & Exit: Entry: $0.6250 🎯 Take Profit 1: $1.2500 (50%) (+100.00%) 🎯 Take Profit 2: $4.0800 (+559.13%) ⚠️ Risks: Regulatory Heat: DeFi's in the SEC's crosshairs; any perp trading crackdown could spook volumes. Plus, competition from GMX/Hyperliquid eroding market share. Portfolio Allocation Recommendation: Keep it tight – no more than 5-10% of your crypto bag in this trade. My View: Super interesting project. It’s been in accumulation for months. The recent correction wiped out long traders’ stop losses, and I think the path is clear for a rally.

SpartaBTC
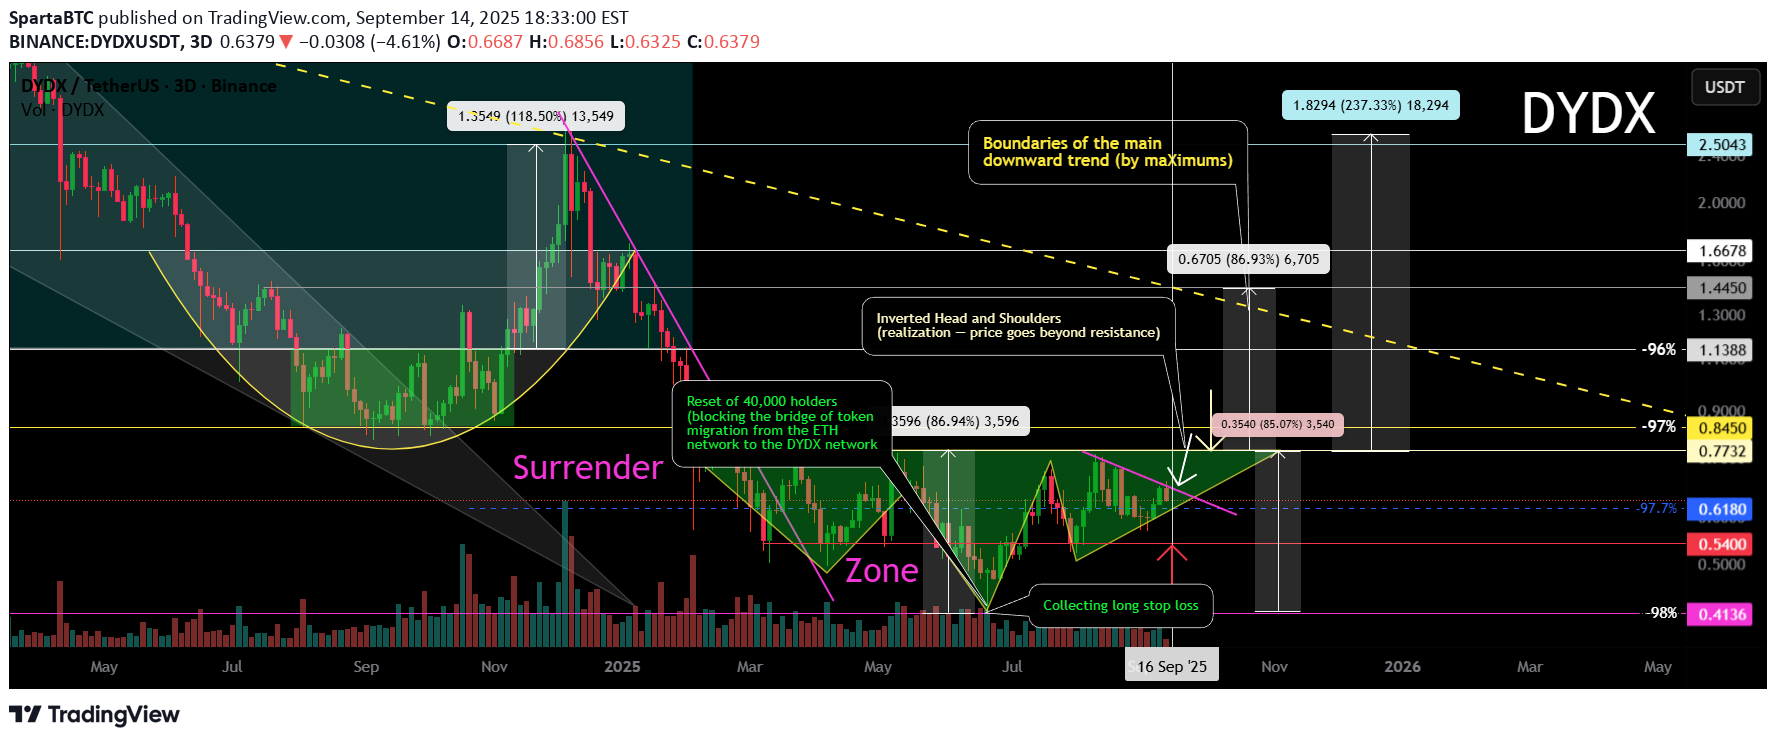
Logarithm 3 days. In the capitulation zone on the super negative, a reversal pattern of an inverted head and shoulders is formed. Its implementation of goals is to enter when the price overcomes the resistance of the pattern. Main trend. -98%. DYDX Main trend. 30 08 2024 15 09 2025 Manipulations from the project developers. Most recently in June (trend minimum, negative) - the developments froze (turned to zero) the tokens of about 40,000 DYDX holders. They blocked the token migration bridge from the ETH network to the DYDX network. In other projects, such migration is always open (for example, from the fact that I have EWT (EWTB), because many holders, after purchasing an asset and withdrawing it to a wallet, do not particularly follow the events of the projects. But, with DYDX, this did not work. Balances on wallets, and already a super depreciated token (from the peak of pumping, a natural -98% depreciation in liquidity), literally turned into zero. Probably, it is more offensive not to the hamsters who bought on the listing, news and hype, but to those people who gained from supporting a long-term downward channel. There are rumors that for 10% of the cost, developers make an exchange of network tokens. If this is true, then from the standpoint of the morality of the developers, this is the moral bottom.
CryptoWithJames
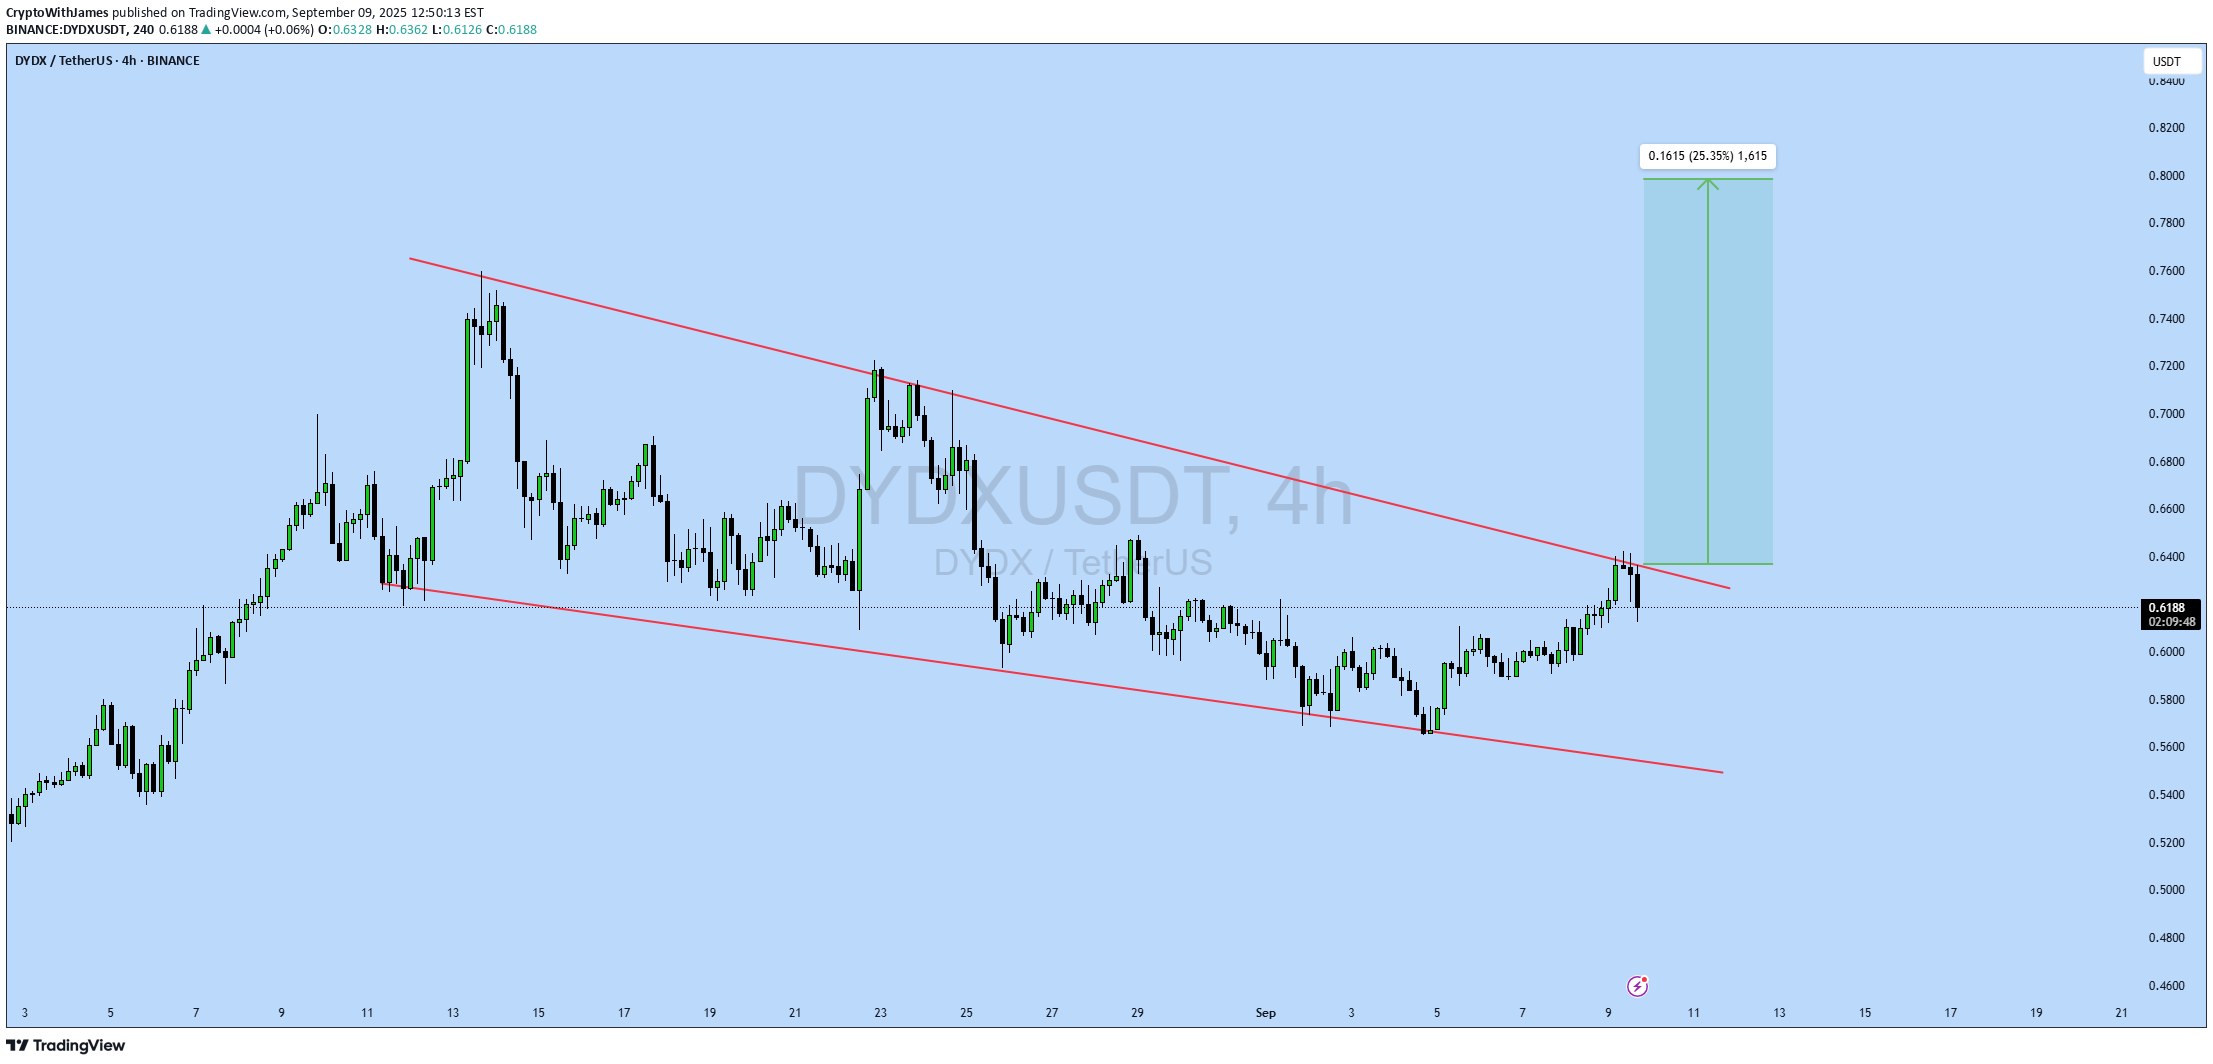
#DYDX UPDATE DYDX Technical Setup Pattern : Bullish Falling Wedge Pattern Current Price: $0.6186 Target Price: $0.78 Target % Gain: 25.35% Technical Analysis: DYDX has broken out of a falling wedge on the 4H chart, confirming bullish momentum. The structure shows strong breakout with potential continuation towards $0.78 as long as price holds above the breakout zone. Time Frame: 4H Risk Management Tip: Always use proper risk management.

Dydx has reached a key support , which holds the potential for upward move from this area. It is suitable for long-term buying. Disclaimer: This is not financial advice. Please do your own research before making any investment decisions.

CryptoAnalystSignal
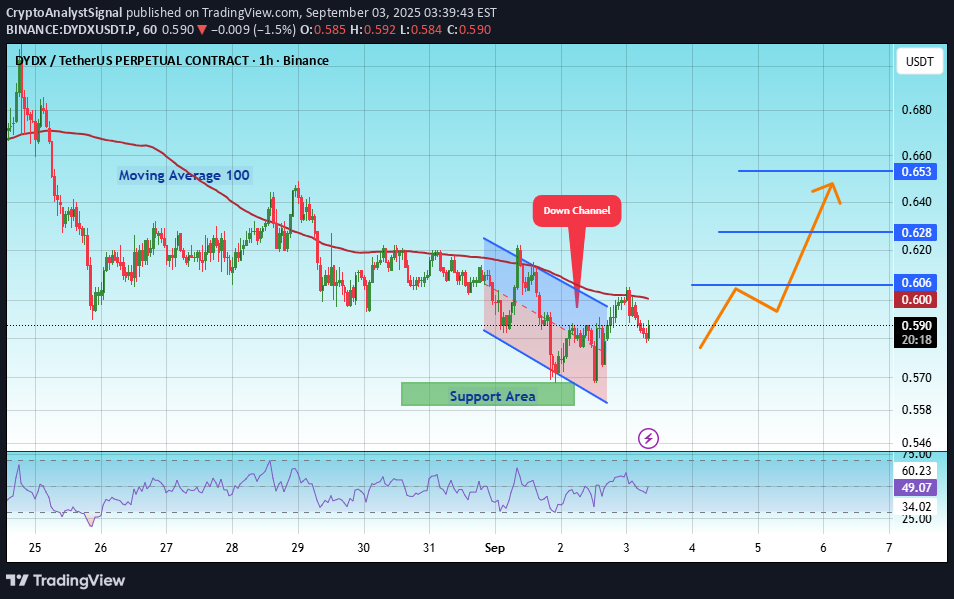
#DYDX The price is moving within a descending channel on the 1-hour frame, adhering well to it, and is heading for a strong breakout and retest. We have a bearish trend on the RSI indicator that is about to be broken and retested, which supports the upward breakout. There is a major support area in green at 0.563, which represents a strong support point. For inquiries, please leave a comment. We are in a consolidation trend above the 100 moving average. Entry price: 0.588 First target: 0.600 Second target: 0.628 Third target: 0.653 Don't forget a simple matter: capital management. When you reach the first target, save some money and then change your stop-loss order to an entry order. For inquiries, please leave a comment. Thank you.#DYDX First target: 0.600 Reached Second target: 0.628 Reached#DYDX First target: 0.600 Reached Second target: 0.628 Reached Third target: 0.653 Reached

BitcoinGalaxy

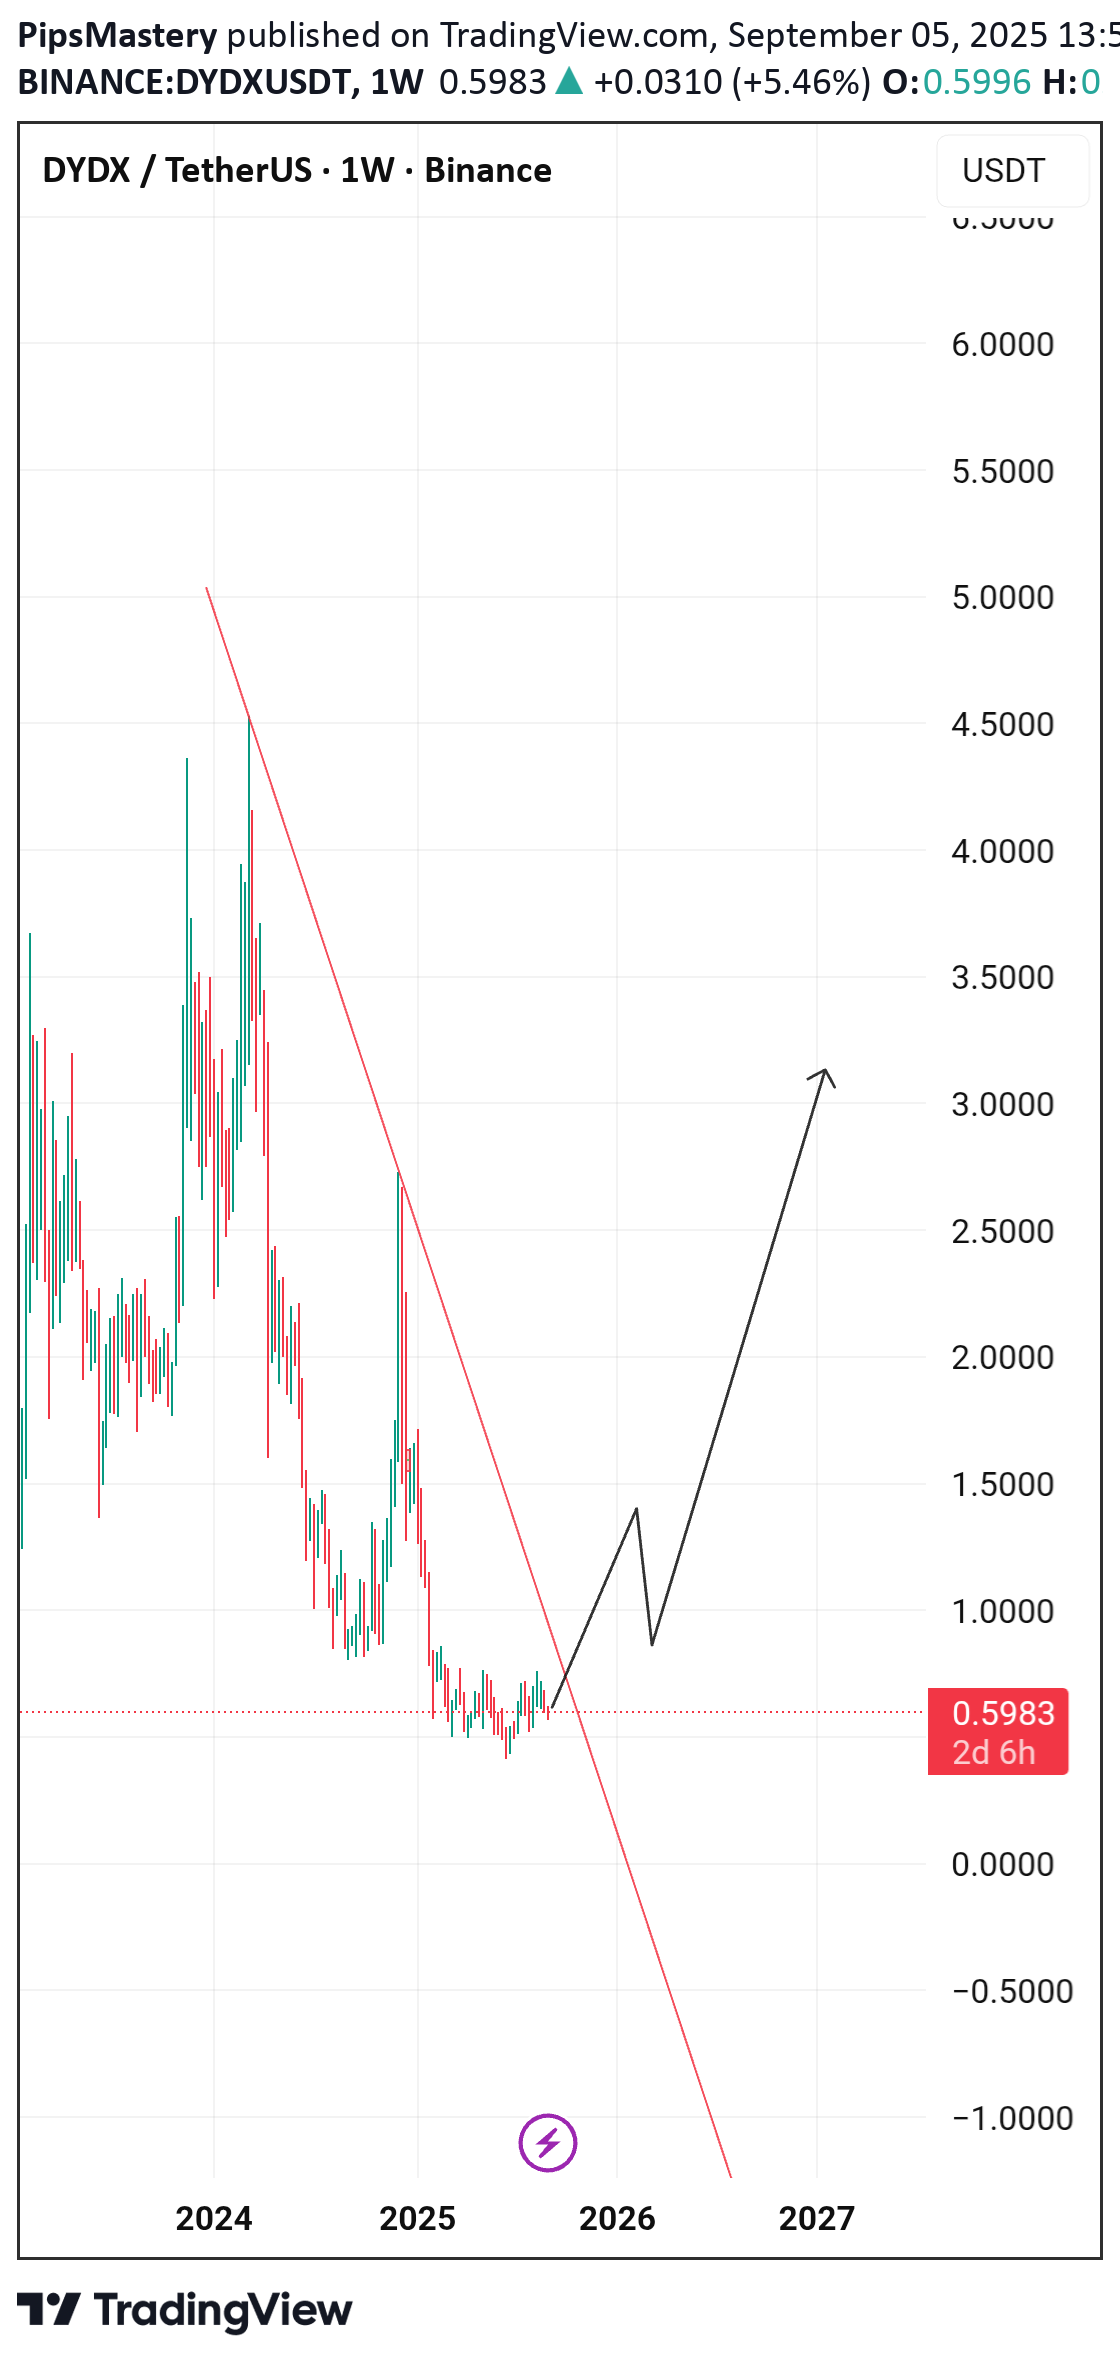
I think $0.40 is the bottom for DYDX, and with alt season, it can easily reach $11.
WaveRiders2
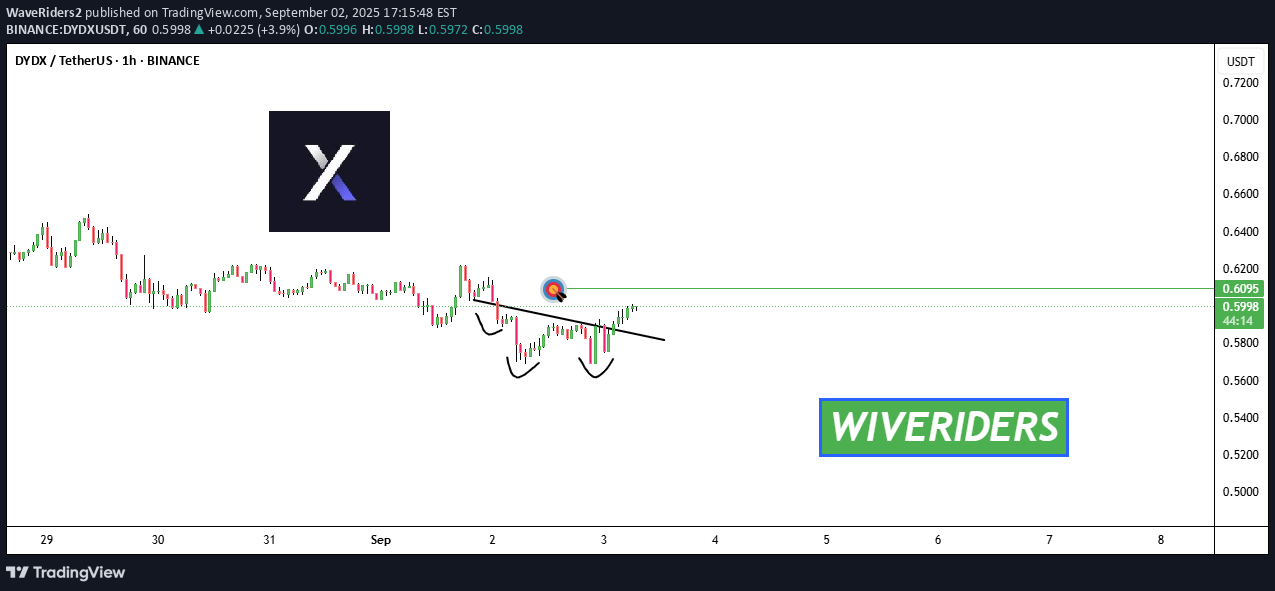
🚨 $DYDX Breakout Alert! 🚨 $DYDX has already broken out above the neckline of its inverted Head & Shoulders pattern ✅ 👉 The first target is now the green line level 🎯 ⚠️ Key point: Watch for retests of the neckline to confirm strength. 👉 This breakout signals bullish continuation with buyers firmly in control 📈
CryptoNuclear
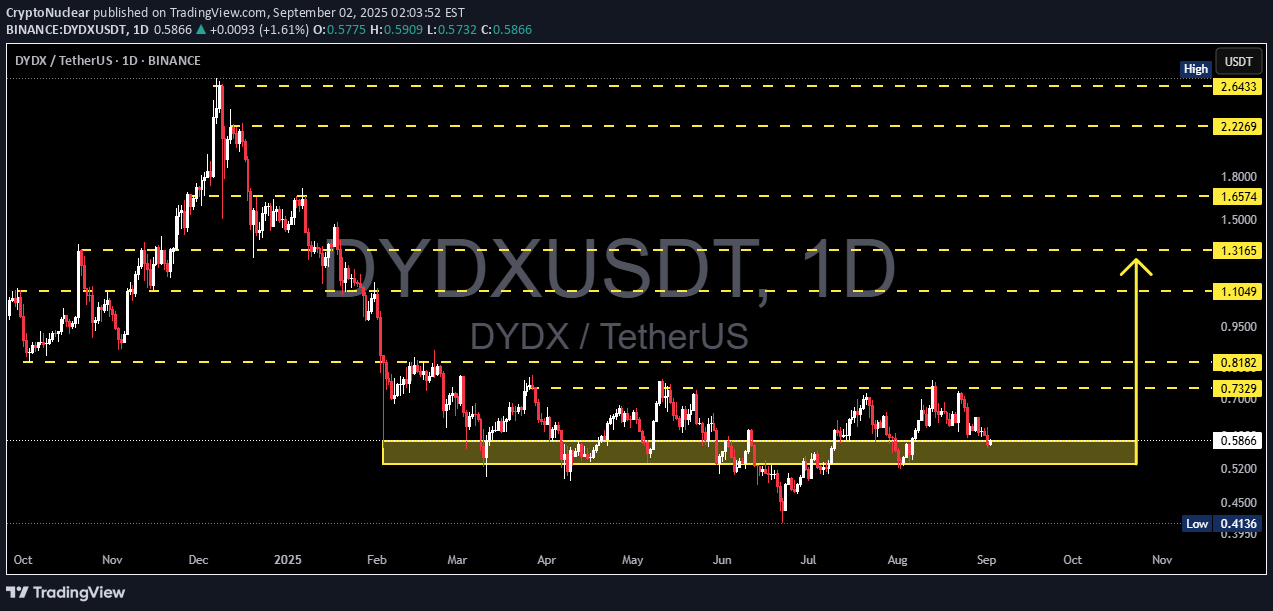
Full Analysis: DYDX is currently standing at a critical decision point. The chart shows price retesting the demand zone $0.50–$0.59 (yellow box), which has acted as strong support multiple times since March, June, and August 2025. This zone remains the last stronghold before price revisits the previous low at $0.41. On the macro view, DYDX is still in a downtrend since the peak at $2.64 (Dec 2024). However, in the mid-term, price is moving sideways inside a broad range of $0.41–$0.82, suggesting accumulation or consolidation before the next major directional move. --- 🔹 Bullish Scenario If the $0.50–$0.59 zone holds once again, a strong rebound is possible. Early confirmation: a daily close above $0.64–$0.68, showing buyer rejection at the demand area. Next resistance targets: $0.73 (range high) → if broken, extension targets are $0.82 → $1.10 → $1.31. Additional bullish signals: long lower wick candles around support, increasing buy volume, and formation of higher lows. 📈 Swing strategy (bullish): accumulate around $0.52–$0.59, stop-loss below $0.48, profit targets at $0.73–$0.82. --- 🔻 Bearish Scenario If price fails and closes daily below $0.50, a confirmed breakdown is in play. Downside targets: $0.41 (previous low), with further bearish continuation possible if that level breaks. Breakdown of this zone will confirm a continuation of the macro downtrend, likely forming new lower lows. Additional bearish confirmations: strong daily close below $0.50, heavy sell volume, repeated lower highs pattern. 📉 Swing strategy (bearish): short after breakdown & failed retest of $0.50–$0.52, stop-loss above $0.60, first target $0.41. --- 🔍 Pattern & Market Structure Range-bound: DYDX has been consolidating within $0.41–$0.82 for months. Demand Zone in Play: The $0.50–$0.59 zone has been tested three times — each test weakens it, but also increases chances of a strong bounce if buyers step in. Decision Point: Price action here will decide whether DYDX forms a base for reversal or continues its macro bearish trend. --- 📌 Conclusion DYDX is testing a critical historical support at $0.50–$0.59. Holding this zone could spark a rebound toward $0.73–$0.82, but a confirmed breakdown below $0.50 would likely extend the bearish trend toward $0.41. Traders should wait for daily close confirmation before committing, as this area is the true “battle zone” between bulls and bears. ⚠️ Disclaimer: This analysis is not financial advice. Always manage risk and use stop-loss according to your strategy. #DYDX #DYDXUSDT #Crypto #Altcoins #TechnicalAnalysis #SwingTrading #SupportResistance #PriceAction

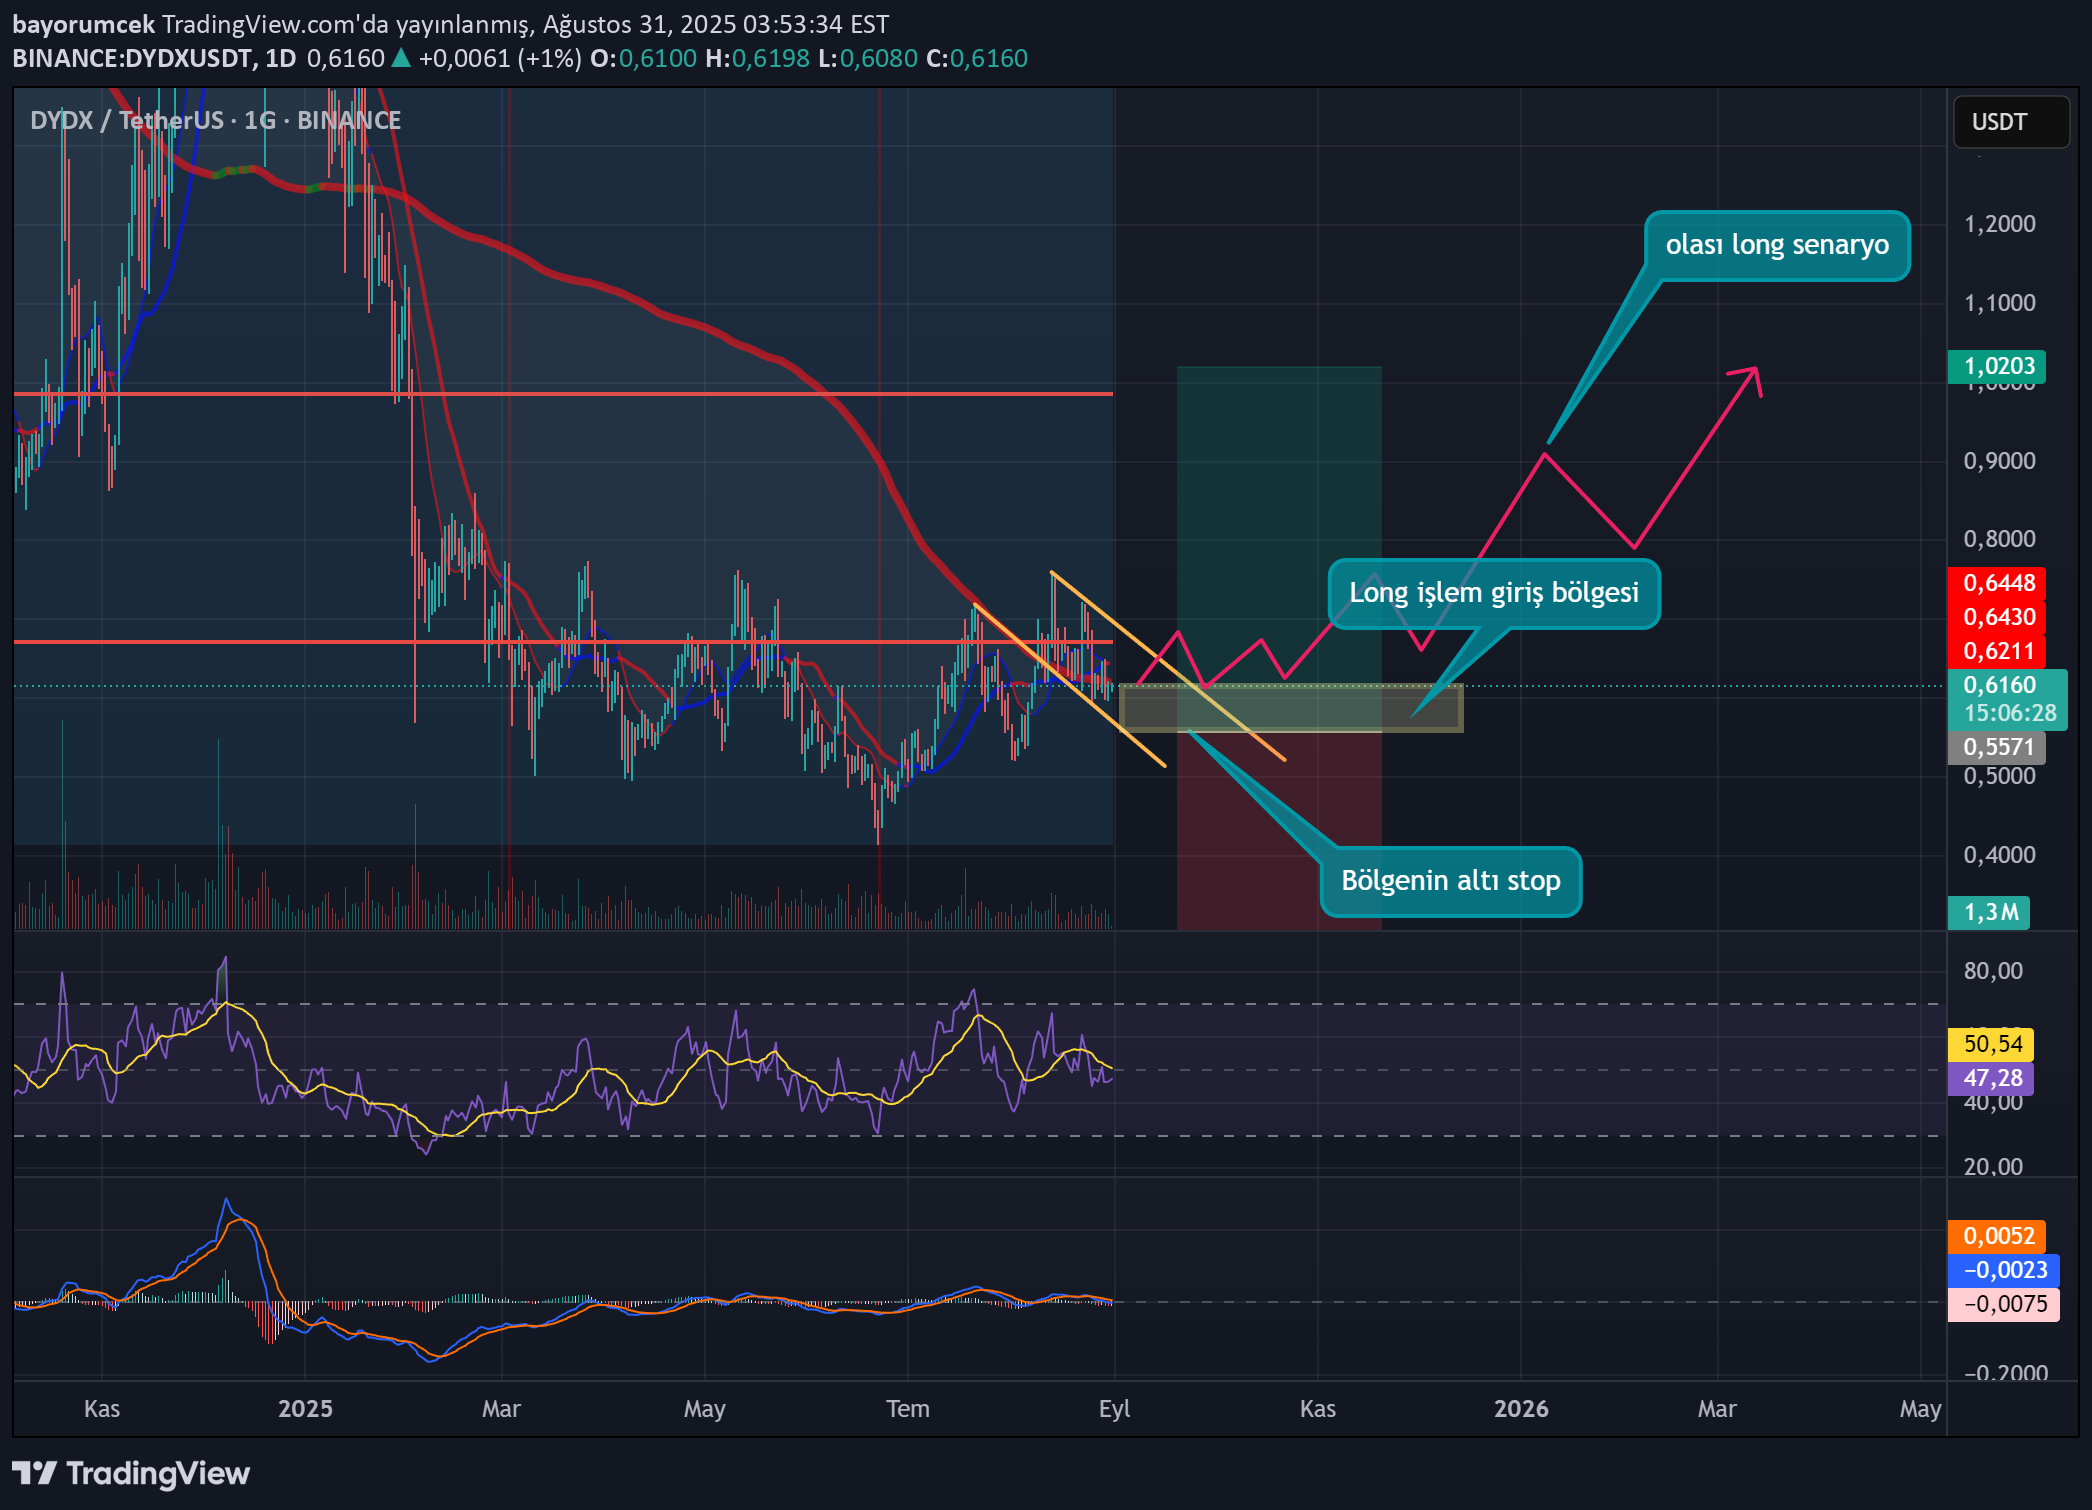
DYDXUSDT is indicated in the possible purchase zone, possible stop zone and possible target graph during daily time period These ideas are only for educational purposes Absolutely not an investment or transaction advice! Take your transaction and investment decisions only based on your own analysis!
Disclaimer
Any content and materials included in Sahmeto's website and official communication channels are a compilation of personal opinions and analyses and are not binding. They do not constitute any recommendation for buying, selling, entering or exiting the stock market and cryptocurrency market. Also, all news and analyses included in the website and channels are merely republished information from official and unofficial domestic and foreign sources, and it is obvious that users of the said content are responsible for following up and ensuring the authenticity and accuracy of the materials. Therefore, while disclaiming responsibility, it is declared that the responsibility for any decision-making, action, and potential profit and loss in the capital market and cryptocurrency market lies with the trader.