
DRIFT
Drift
| تریدر | نوع سیگنال | حد سود/ضرر | زمان انتشار | مشاهده پیام |
|---|---|---|---|---|
No results found. | ||||
Price Chart of Drift
سود 3 Months :
سیگنالهای Drift
Filter
Sort messages by
Trader Type
Time Frame

Tealstreet
Drift V3: آینده درخشان دیفای سولانا یا مقاومت حیاتی در $0.25؟
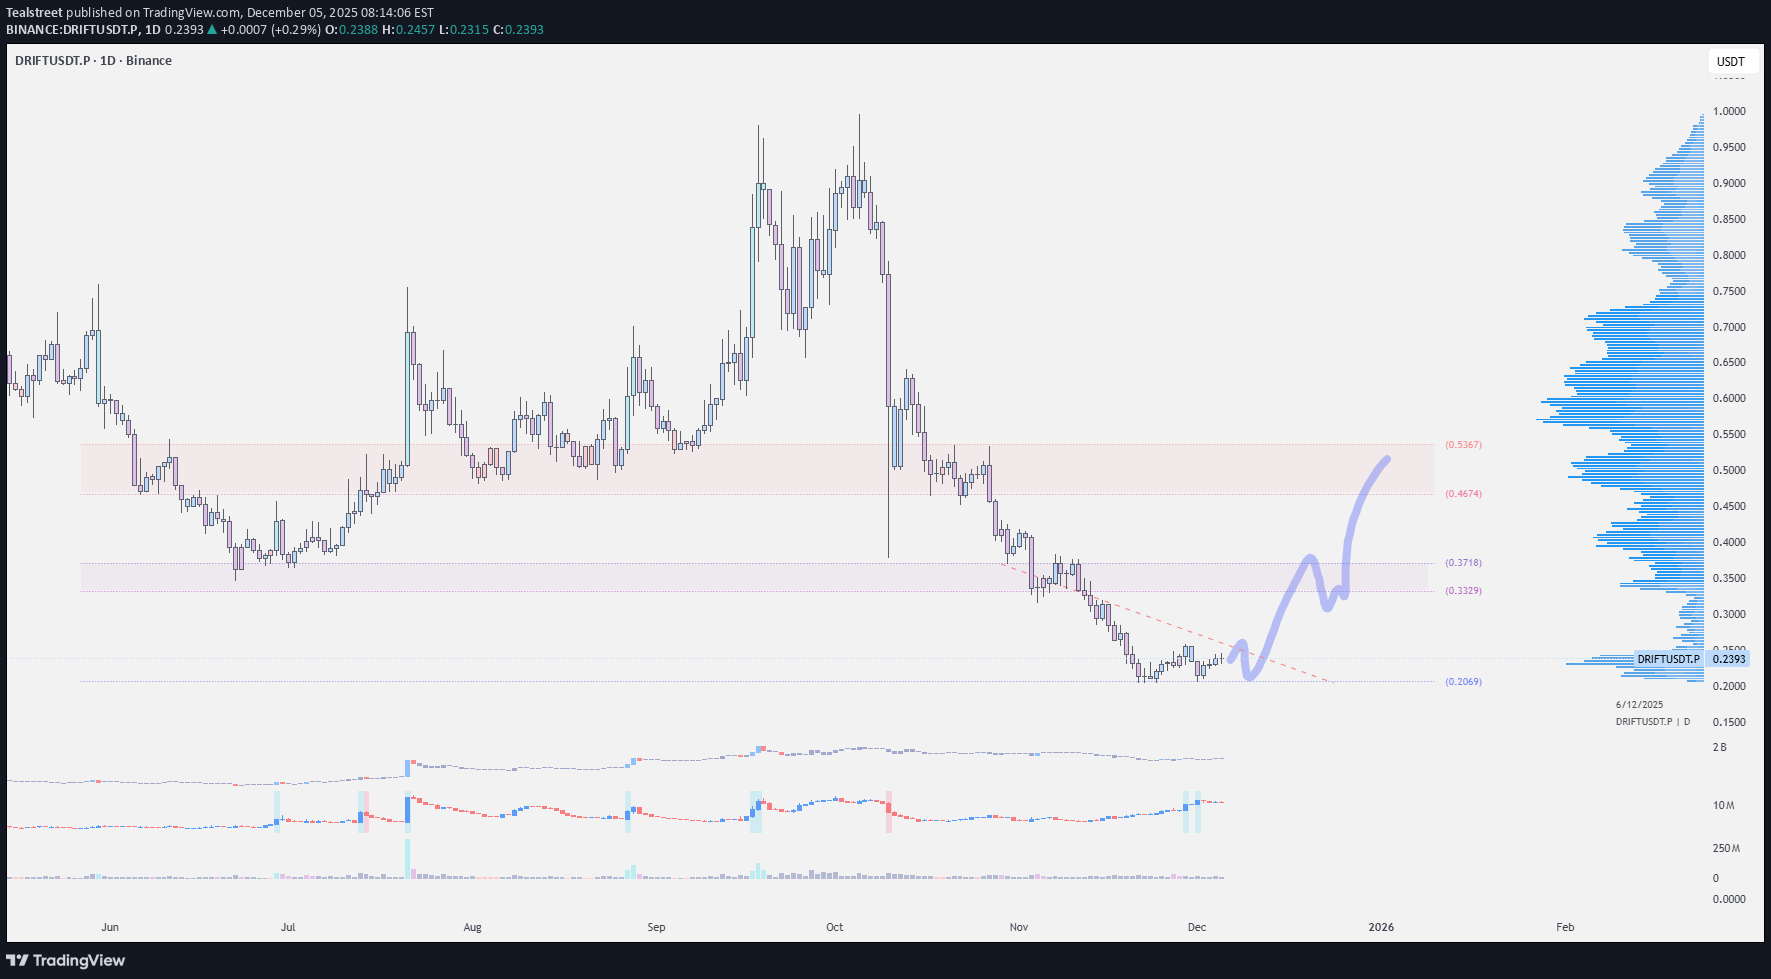
Drift v3 is now live. Drift has kept building through every market phase with one clear aim: deliver a stronger trading experience. The v3 release introduces a modern redesign and much faster execution. Technical View: Price is currently testing the $0.25 diagonal resistance, and with Bitcoin struggling to hold 91k heading into the weekend, I’m not expecting DRIFT to break through here. If the $0.20 area holds with steady strength, it could set up a long opportunity toward the $0.35–$0.40 zone, which lines up with the previous value area low. Ideally, we want to see BTC find support around the 87–86k region.

WepensTrading
نقطه ورود حساس: آیا بیت کوین از حمایت ۰.۷۸۶ به سوی ۱ دلار میجهد؟

A bounce off the 50EMA on the BTC 4hr chart could coincide with a bounce off the rising support on DRIFT, for a break above $1 Long entry - 0.786 SL - 0.7 TP - TBDBTC hit resistance. Will either re-enter a long position lower, or on the other side of the resistance, at the same position size

Crypto-by-PRIME
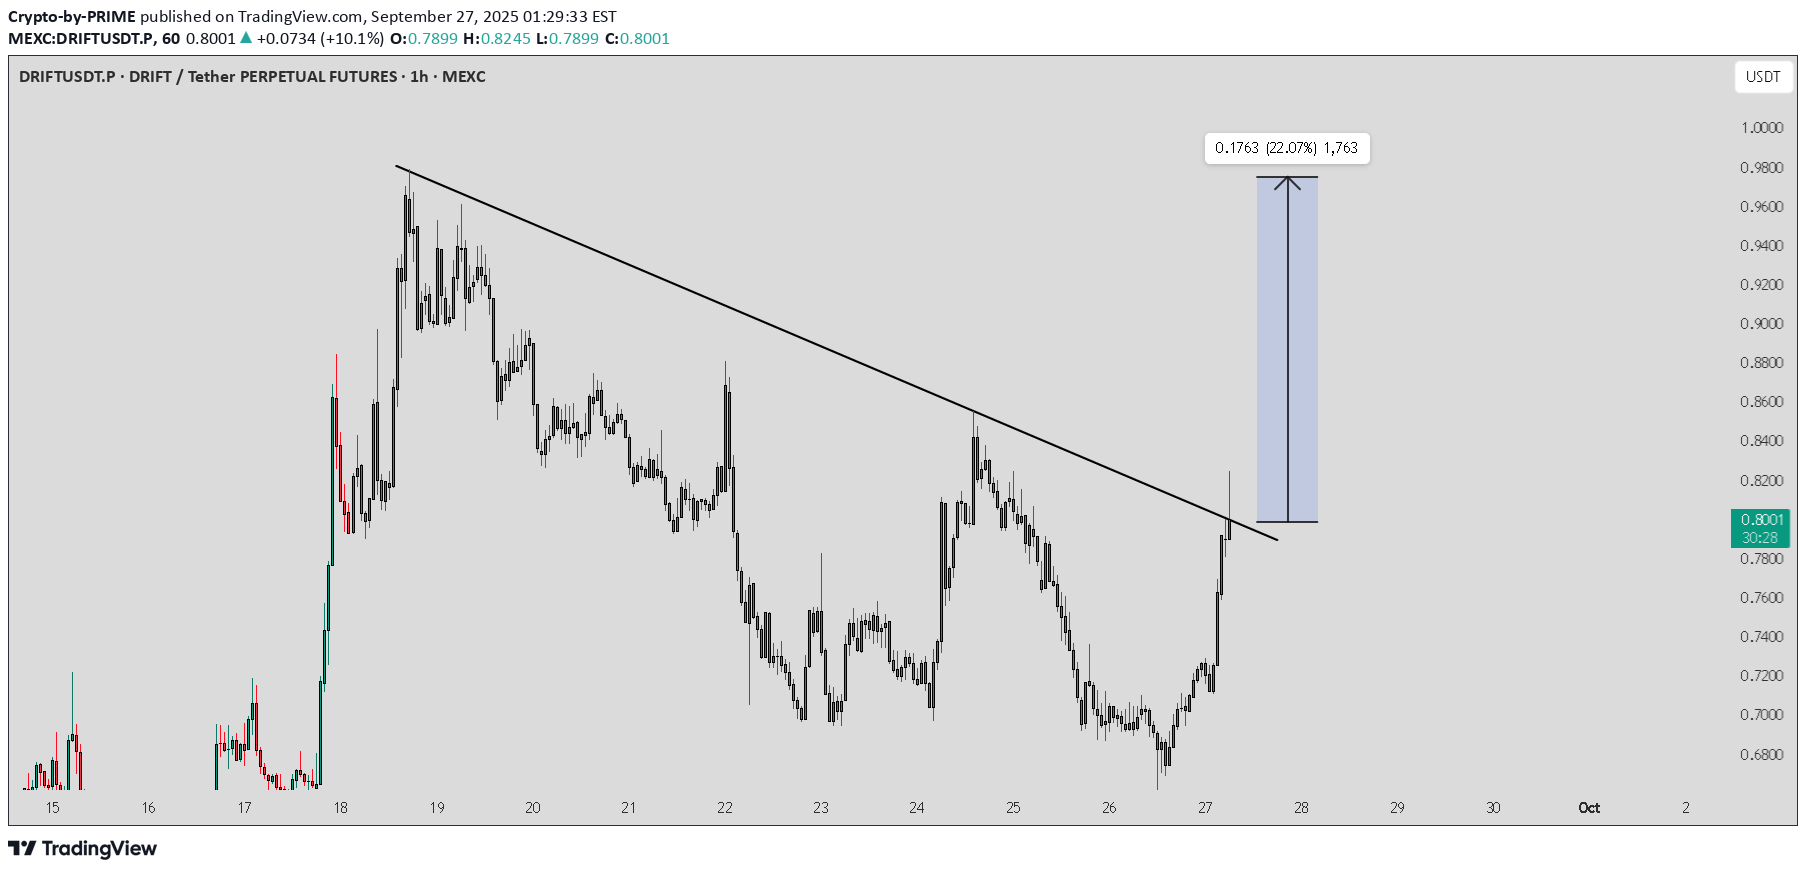
DRIFT / USDT : Trying to breakout with potential

Bijan2002
DRIFT LONg
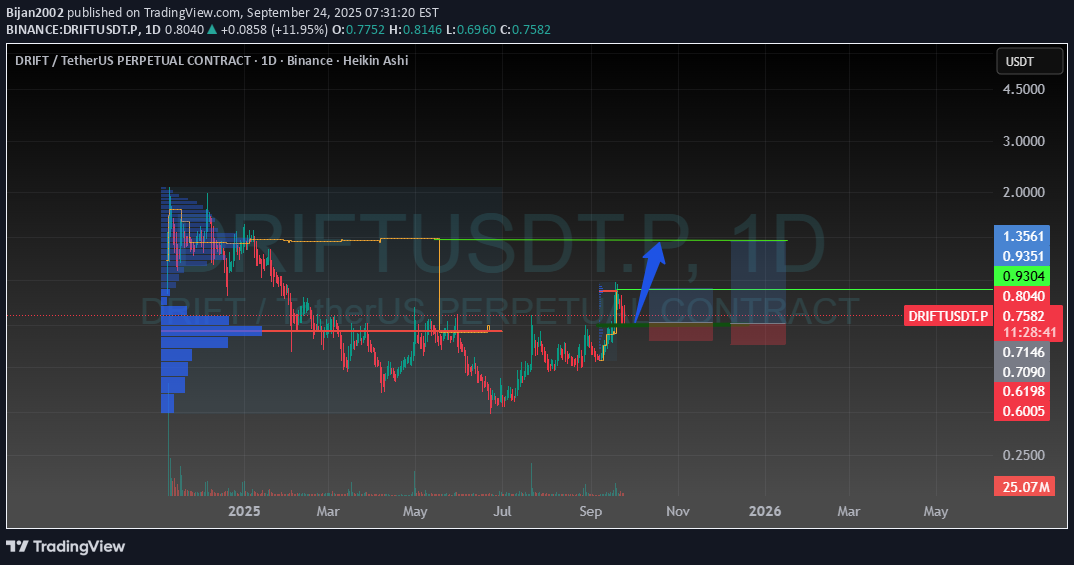
With the chart it has, we can get a good growth from it. Everything is clear and supported by the price and I expect growth this week. Finally with leverage 2

Richtv_official
DRIFT Breakout Setup – Higher High + Retest in Play
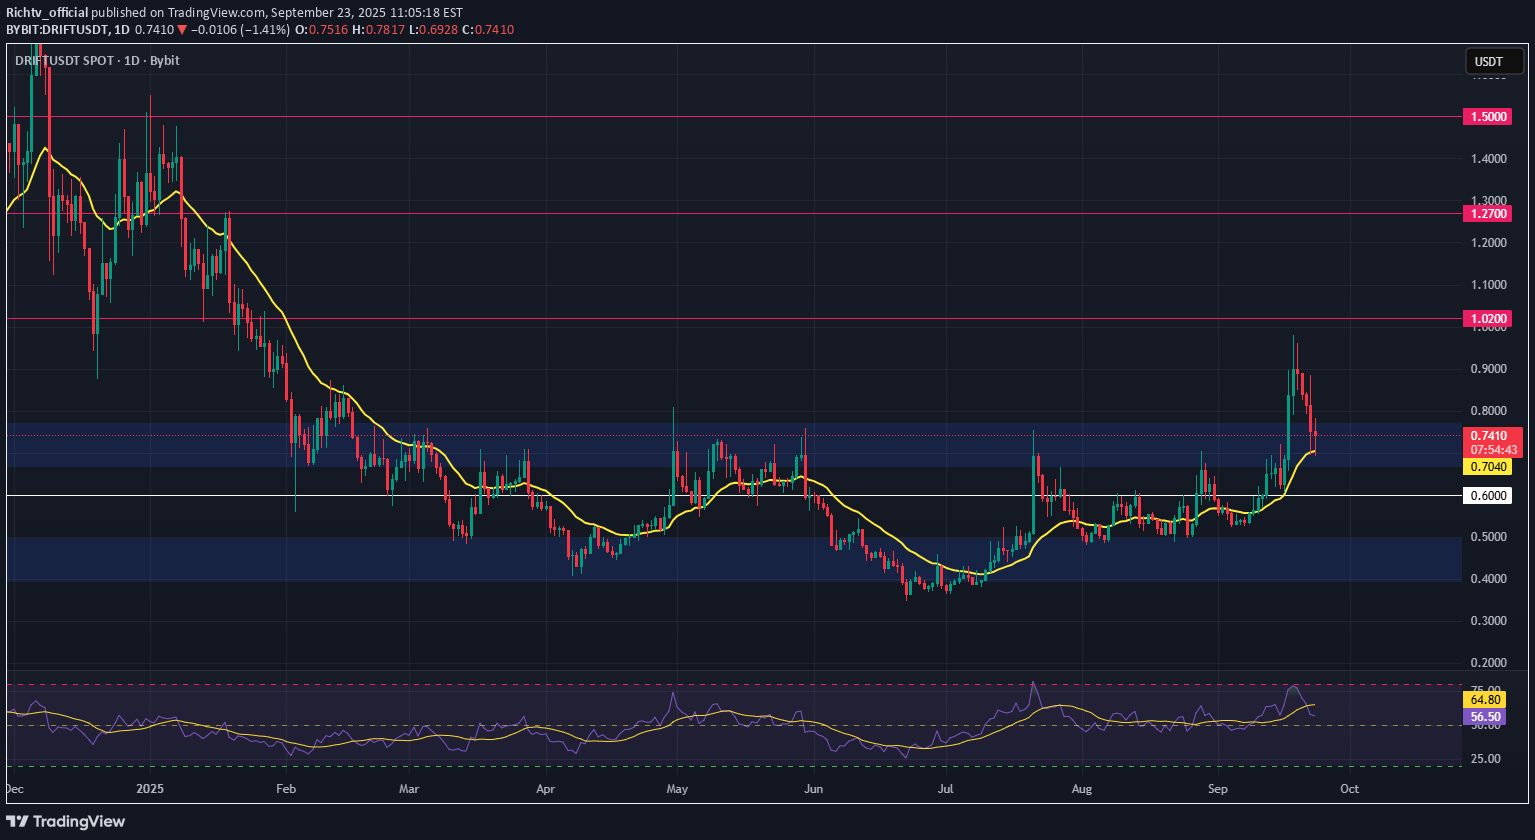
DRIFT is showing strong bullish momentum after months of accumulation. The token has broken out, printed a higher high, and is now retesting the previous range high as support — a classic setup for continuation. With price hovering near the 21-day EMA, this zone could act as a launchpad if sentiment holds. The structure supports a potential leg higher, making this a high-reward, low-risk opportunity for swing traders. 🔹 Trade Setup Entry Zone: $0.68 – $0.72 Take Profit Targets: 🥇 $1.02 🥈 $1.27 🥉 $1.50 Stop Loss: Daily candle close below $0.60 📊 Keep an eye on volume confirmation and overall market sentiment. A clean bounce from this support zone could validate the setup. 📌 Like, comment, or share your thoughts below! 🔔 Follow for more crypto setups and technical insights.

RiskandReward
Drift
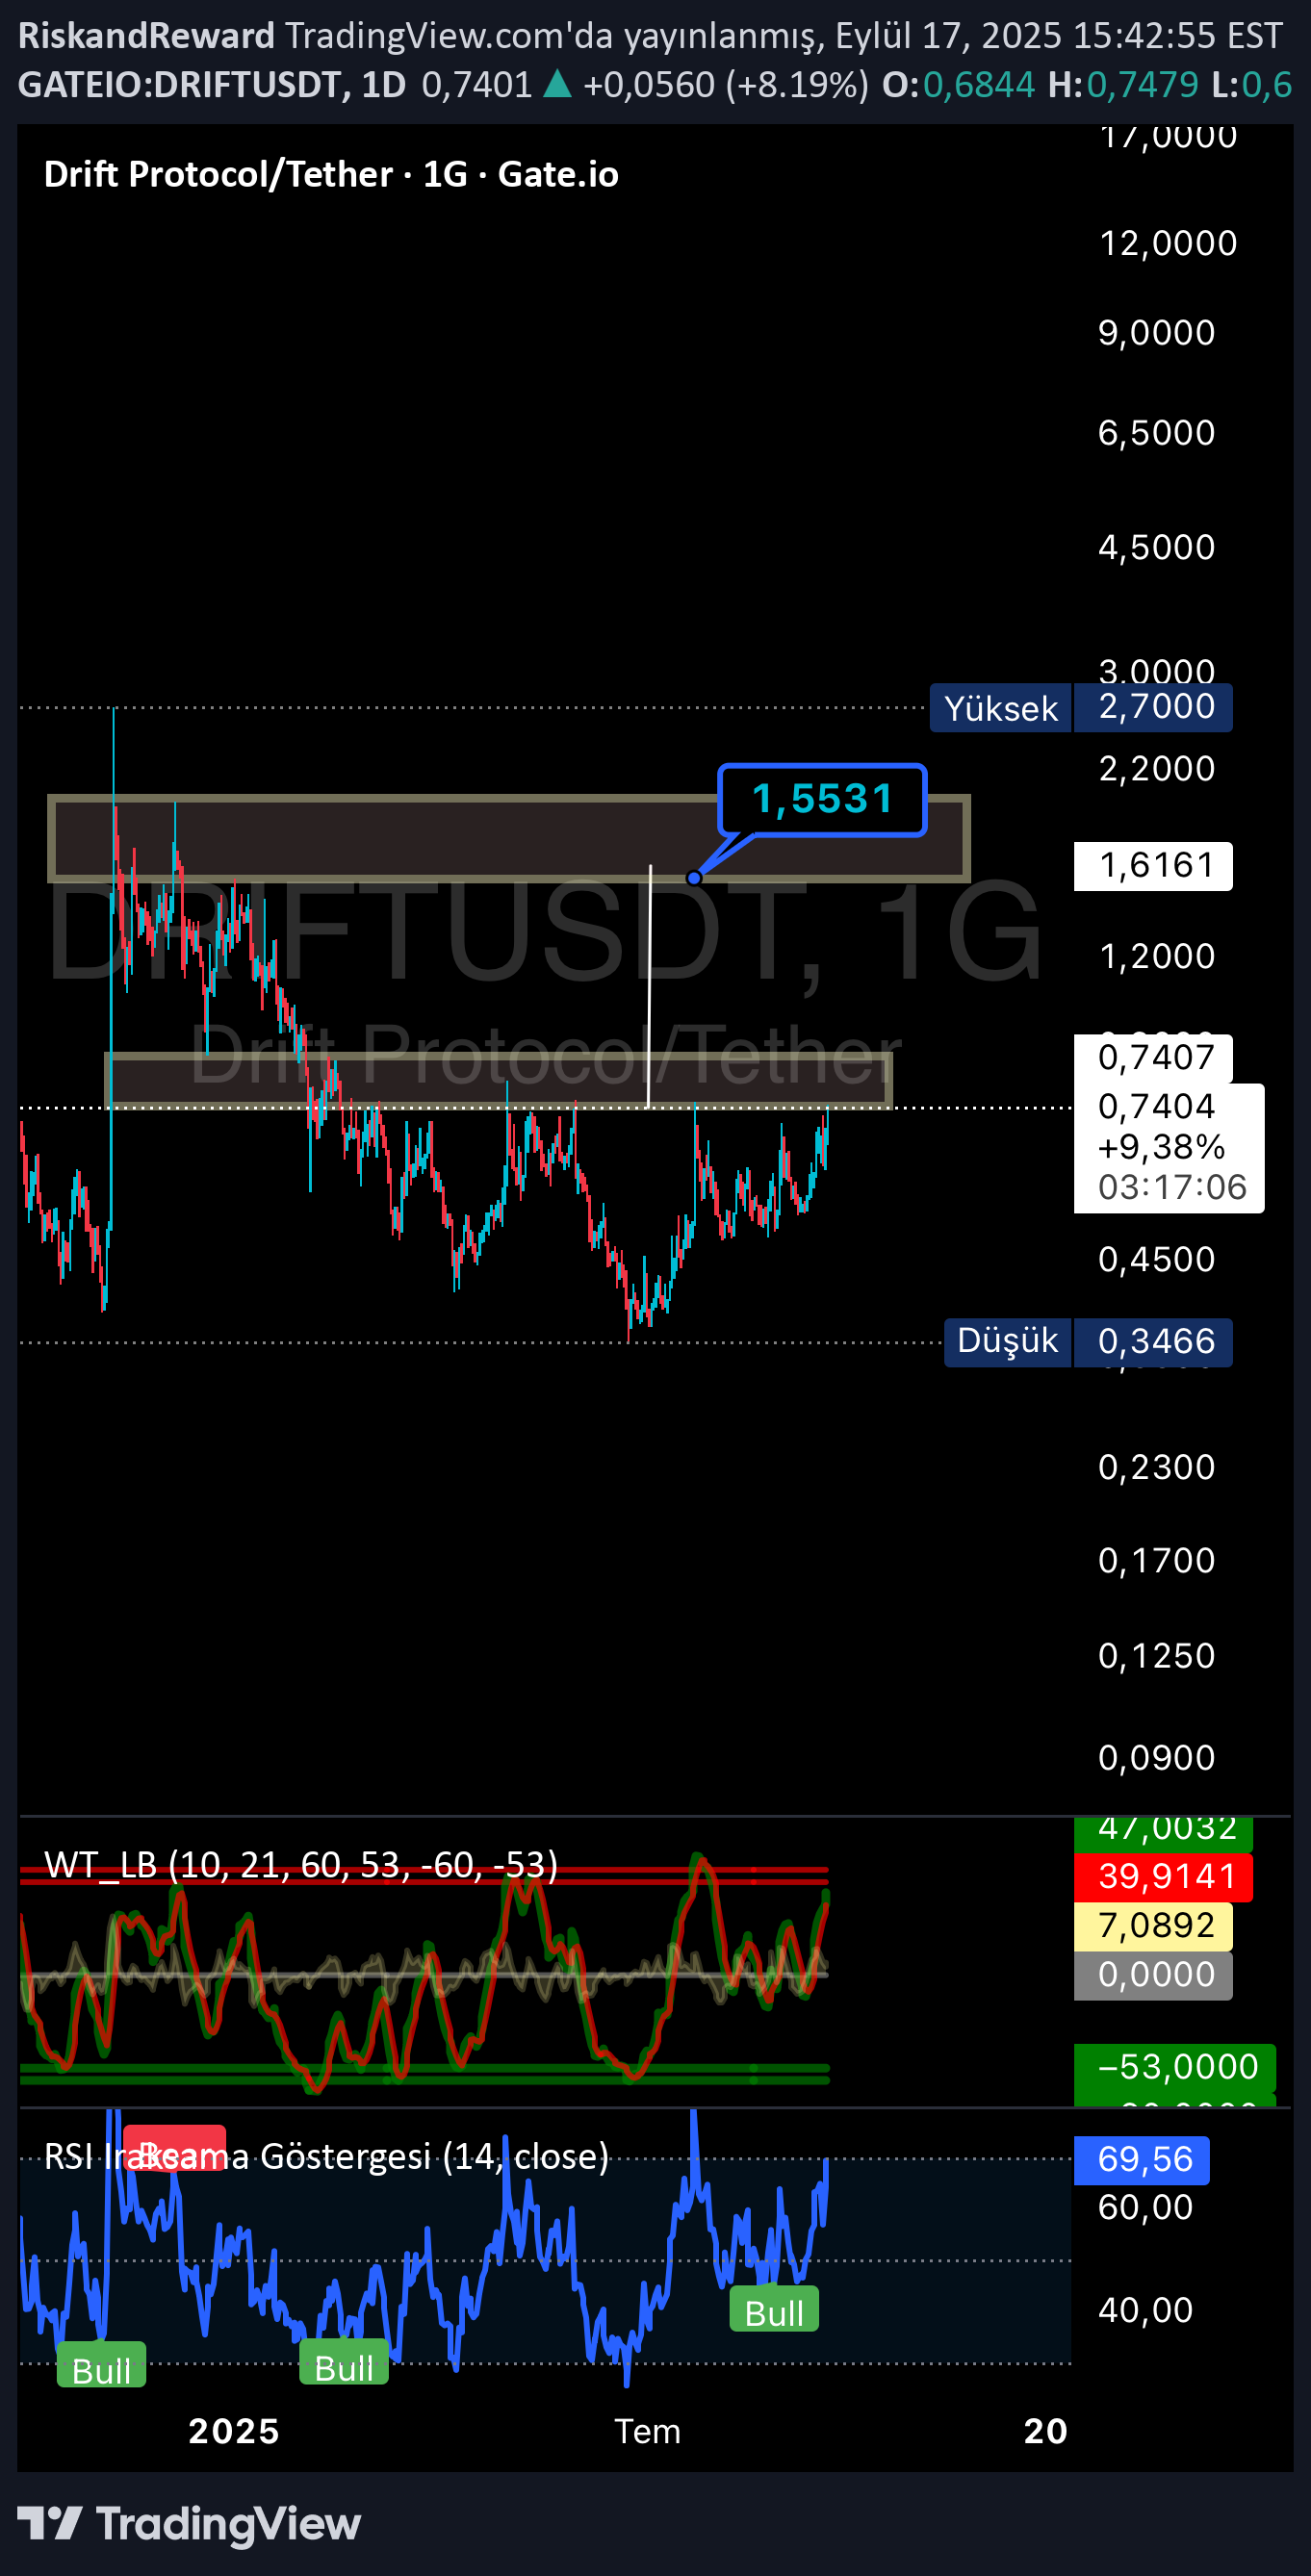
There is a very nice TOBO structure toobo voluminous now if it holds on 0.90, the toobo depth as the opposite of the opposite can go to 1.5. YTD

WSSIGNALS
DRFIT Inverse Head and Shoulders pattern!
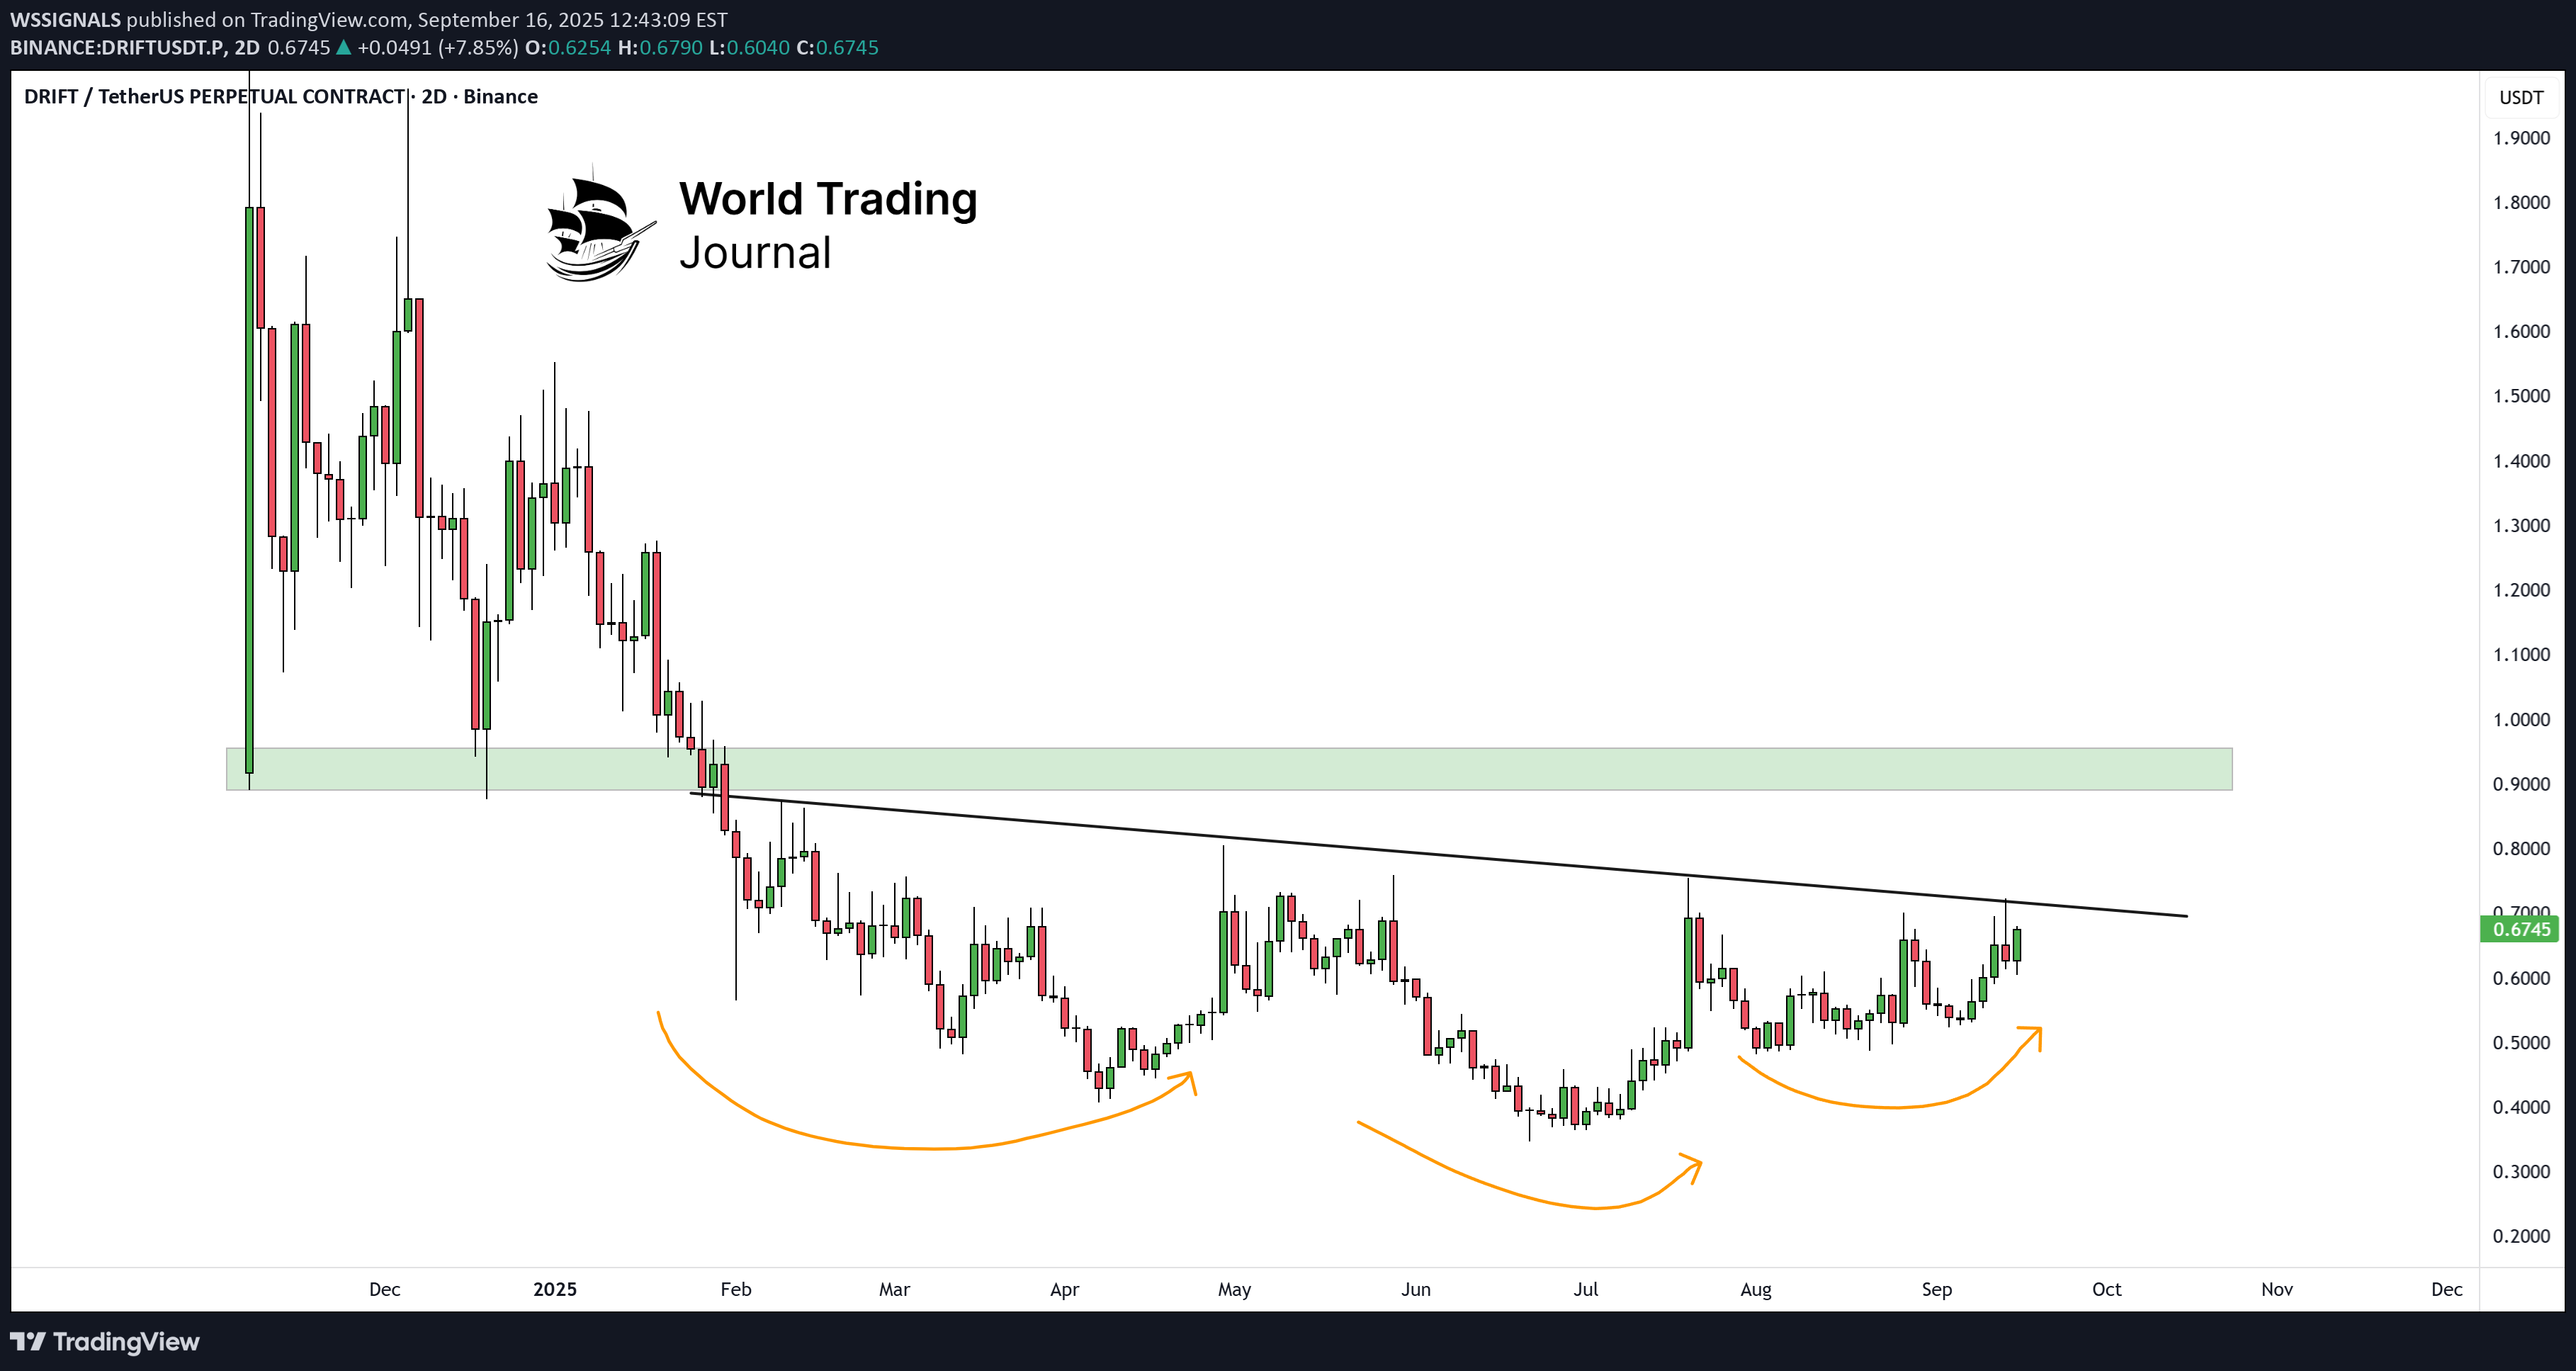
DRFIT Inverse Head and Shoulders pattern! You only get a few of these per cycle! Watch for Breakout

SiDec
DRIFT — No More Drifting, Breakout Imminent
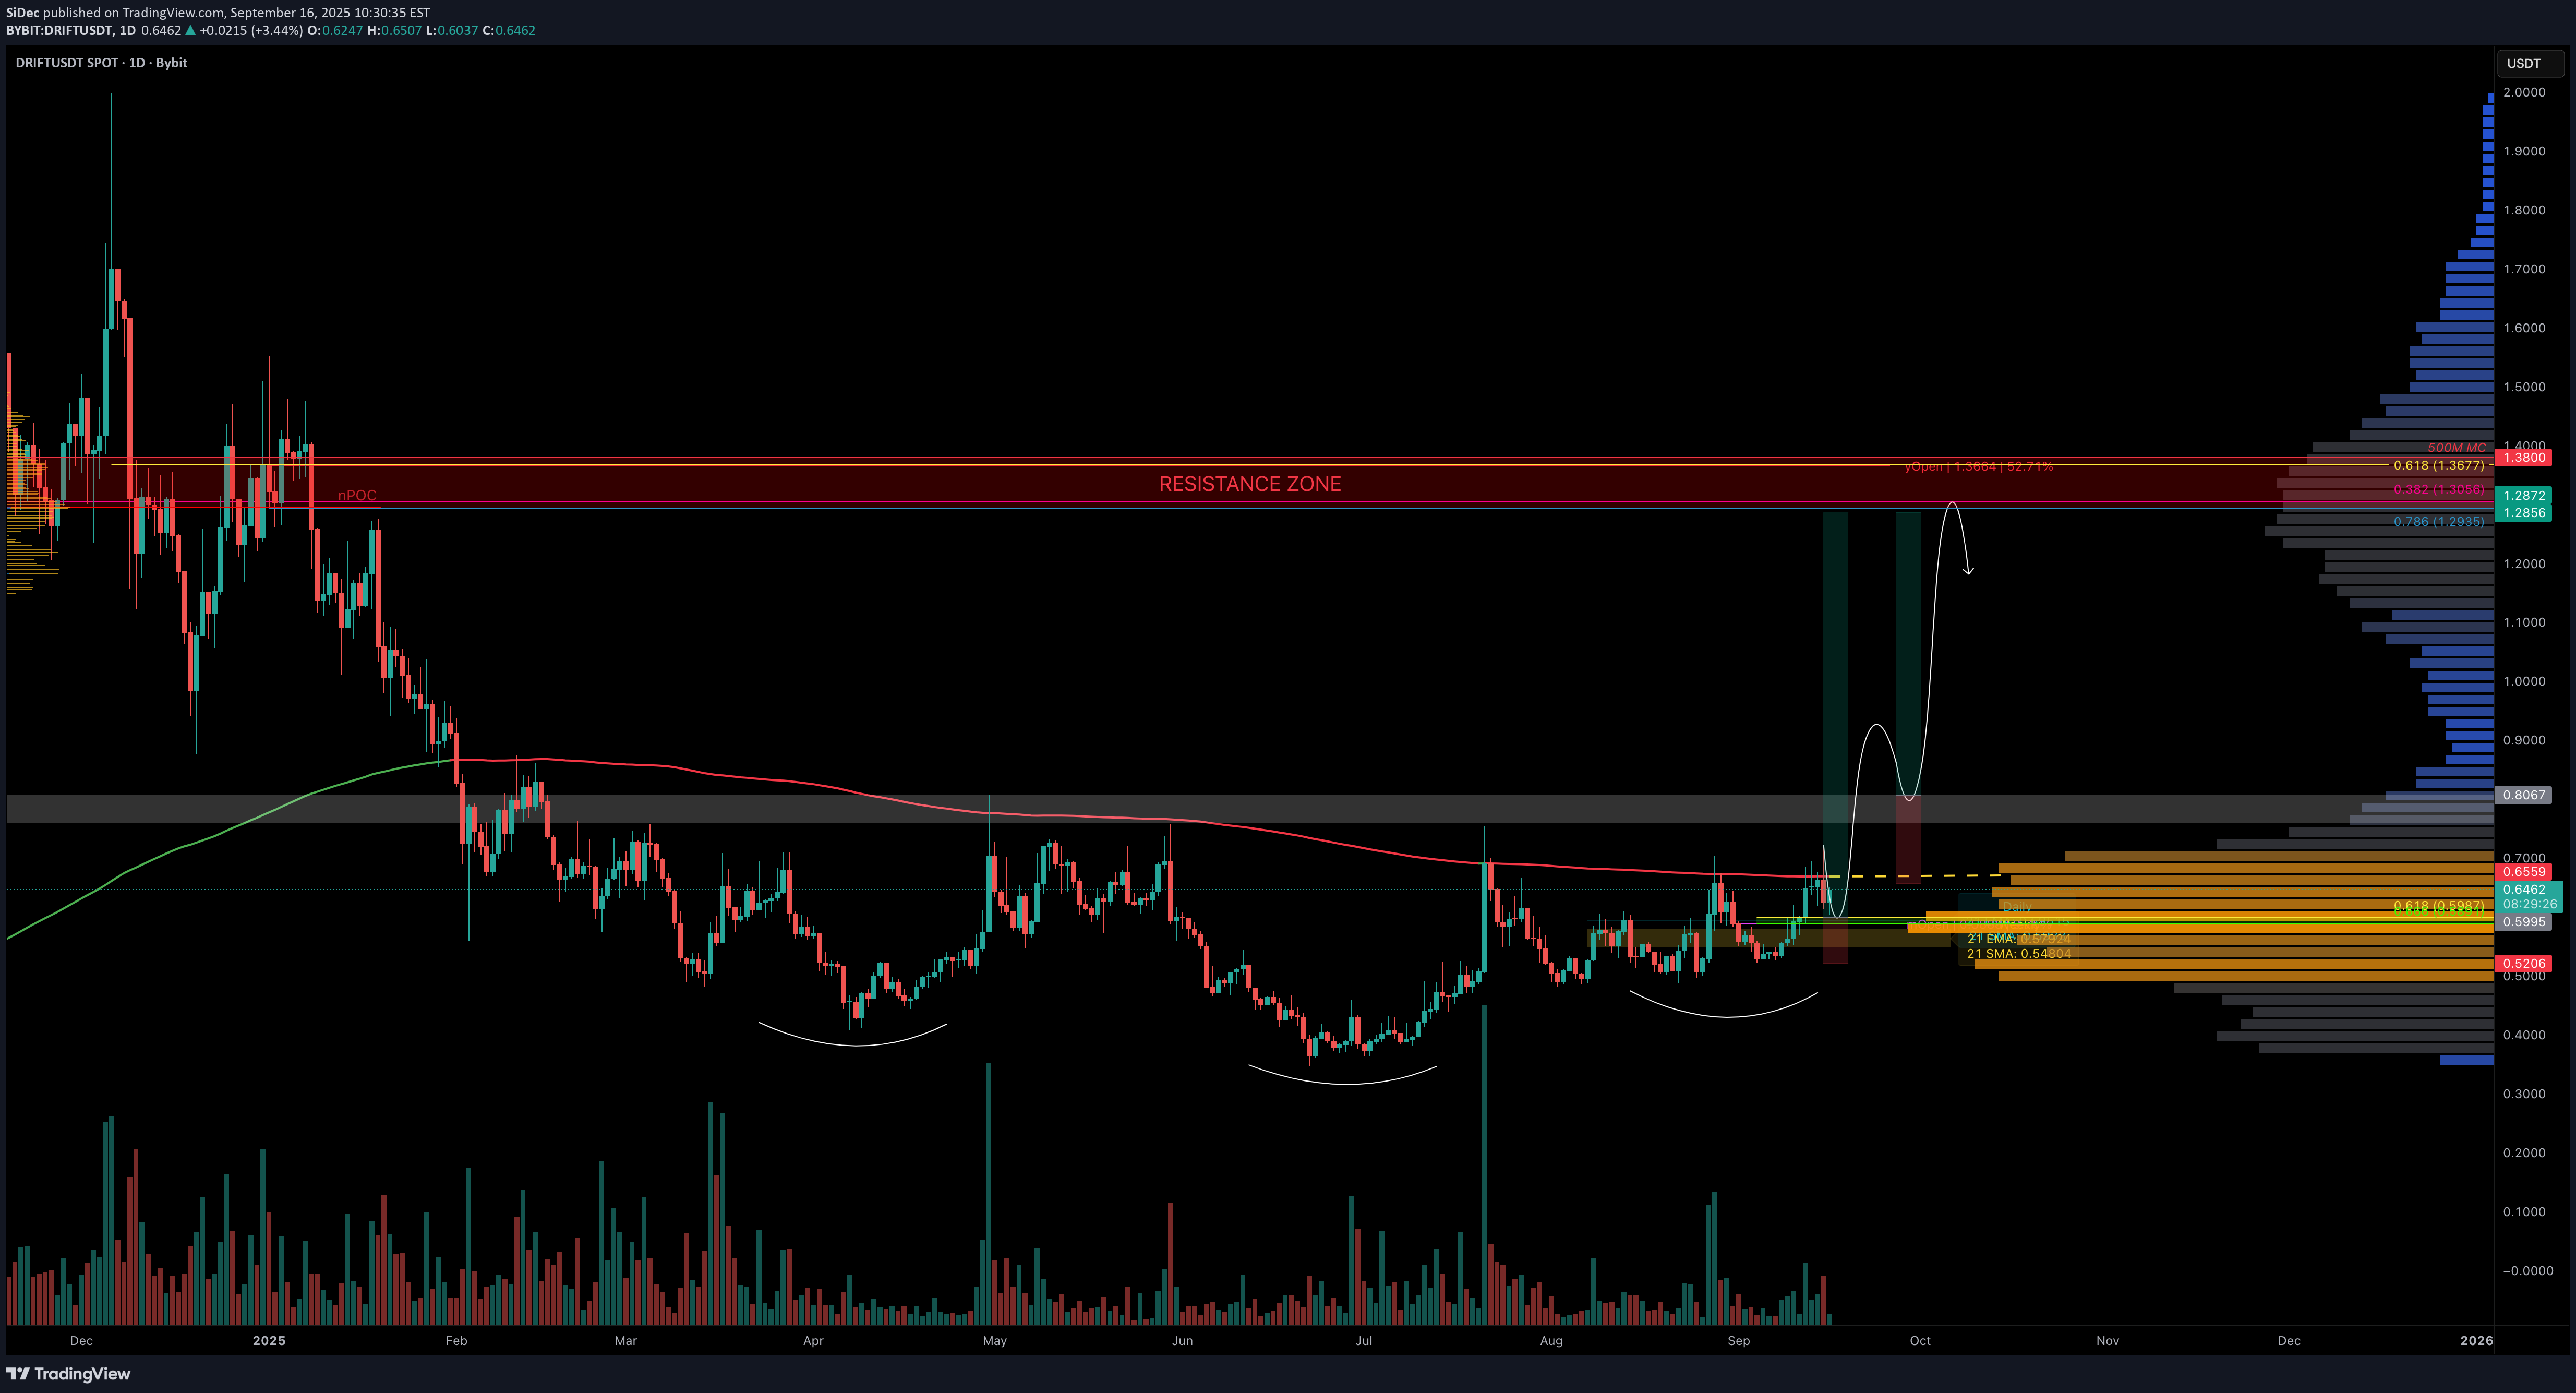
DRIFT has been trading sideways in a 226-day range, capped by resistance at $0.75. The POC of this entire range sits at $0.6, and price is currently trading above it at $0.62. Volume spikes within the range show solid participation, and the structure is starting to resemble a Head & Shoulders formation with a neckline at $0.75 that needs to break. Bullish Confluence (Support Zone) Trading above: 21 Daily EMA ($0.593) / SMA ($0.592) 21 Weekly EMA ($0.577) / SMA ($0.549) 200 Daily EMA ($0.5828) / SMA ($0.5483) Monthly Open → $0.5888 0.618 Fib retracement of current move → $0.5987 (long trigger) Clear invalidation: below weekly 21 SMA ($0.549) / daily 200 SMA ($0.5483) Resistance Confluence (Target Zone $1.3–$1.38) nPOC of the end 2024 / early 2025 trading range → $1.3 0.786 Fib retracement → $1.2935 0.382 Fib retracement of entire downtrend → $1.3056 0.618 Fib retracement of smaller wave → $1.3677 Yearly Open → $1.3664 500M Market Cap → $1.38 📌 This creates a resistance cluster between $1.3–$1.38, an ideal take-profit zone and potential short opportunity. 🟢 Long Setup Idea Entry: $0.62–$0.60 (ladder in near confluence with Fib + support levels) Stop: Below $0.55 (weekly 21 SMA/ daily 200 SMA invalidation) Targets: TP1: $1 TP2: $1.3 Potential Gain: +115% Quick Take If $0.75 breaks, DRIFT could move quickly toward $1.3–$1.38, a zone stacked with resistance and confluences, the perfect place to secure profits/look for a short setup. Key Levels Support: $0.62–$0.60 (Fib + POC + EMAs) Resistance: $0.75 neckline, then $1.3–$1.38 (confluence cluster) 🔍 Indicators used LuxAlgo — Liquidity Sentiment Profile (Auto-Anchored) DriftLine — Pivot Open Zones [SiDec] → For identifying key yearly/monthly/weekly/daily opens that act as major S/R reference points Multi Timeframe 8x MA Support Resistance Zones [SiDec] → to identify support and resistance zones such as the weekly 21 EMA/SMA. Fair Value Trend Model [SiDec] → Calculates a regression-based fair value curve ➡️ Available for free. You can find it on my profile under “Scripts” and apply it directly to your charts for extra confluence when planning your trades. _________________________________ 💬 If you found this helpful, drop a like and comment!

HexaTrades
DRIFTUSDT Approaching Key Breakout Zone
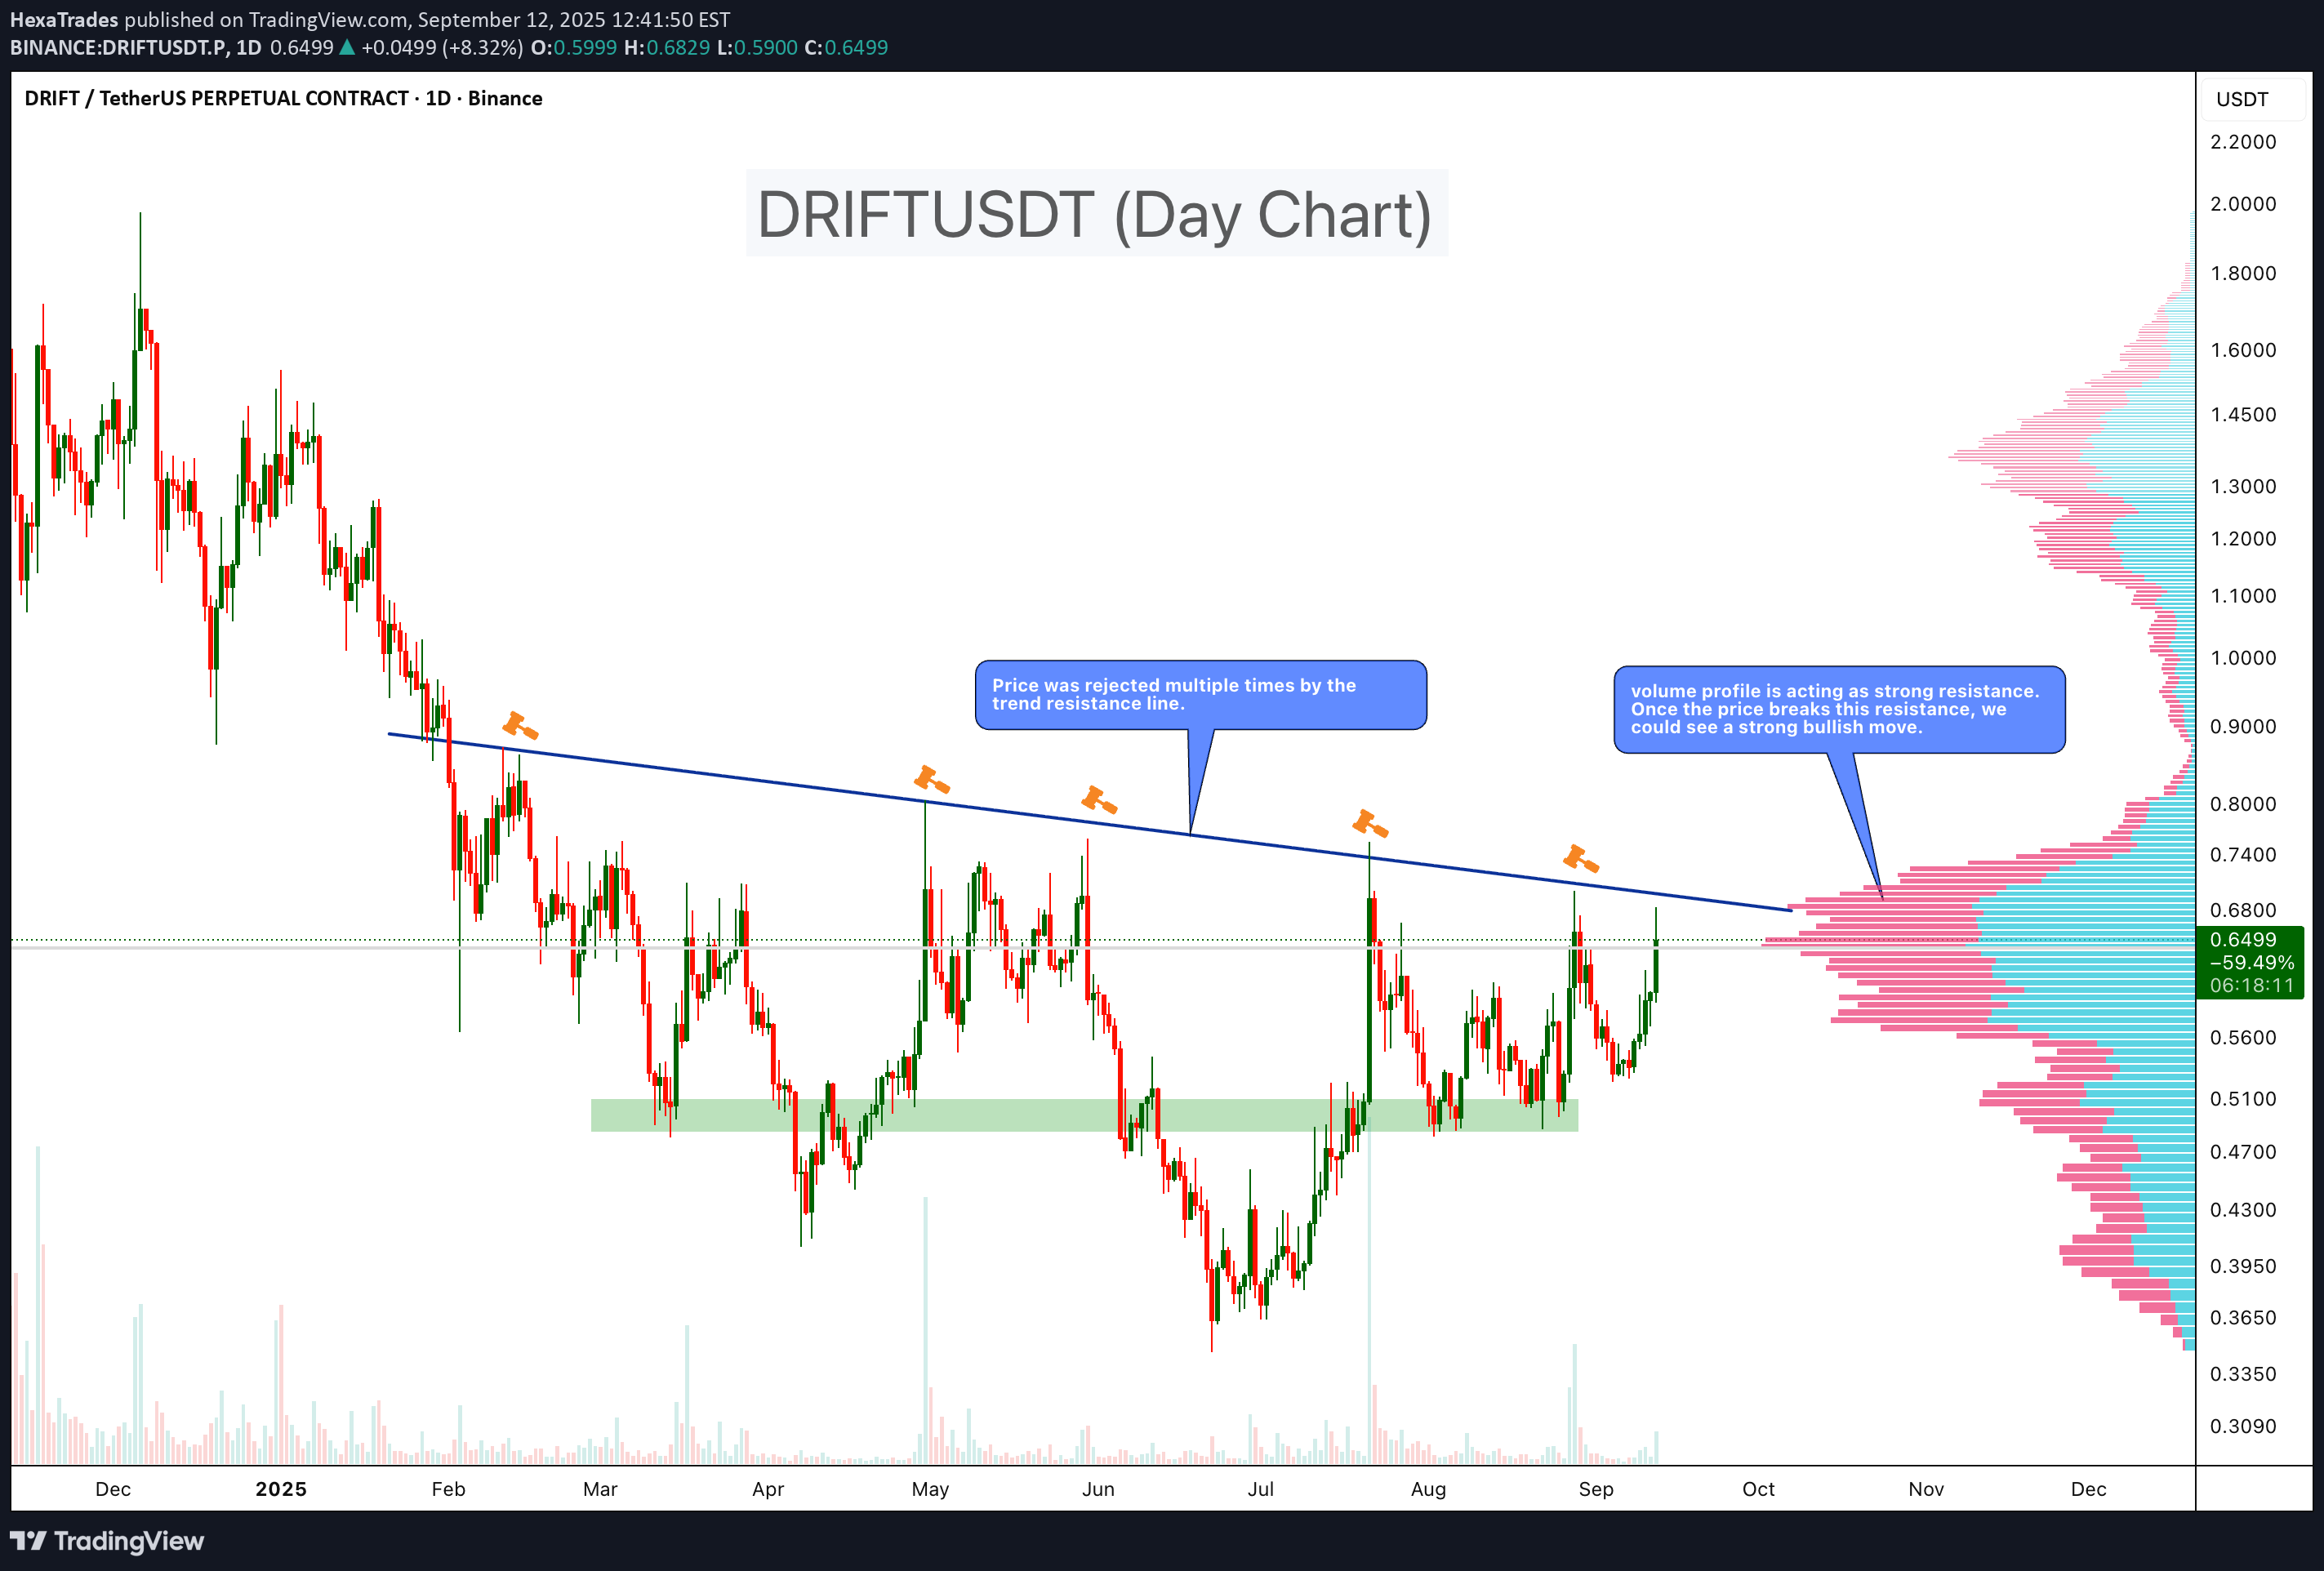
DRIFT has been consolidating for months under a strong descending trendline. Price has been rejected multiple times at this resistance, showing how significant this level is. Key Points - Trendline Resistance: Price is retesting the descending resistance line after several failed attempts. - Volume Profile: A heavy resistance zone is visible on the VPVR, capping upside moves so far. - Support Zone: Strong accumulation area formed around $0.45–$0.50, providing a solid base. - Breakout Potential: If price manages to close above $0.69–$0.70 with volume, a strong bullish continuation move could follow. Trading Plan Entry Zone: Watching for breakout confirmation (above $0.70.) Target (TP): $1.20 – $1.35 mid-term; higher levels possible if momentum builds. Stop-Loss (SL): Below $0.52 Cheers HexaDRIFTUSDT 40%+ gain after breakout

SatochiTrader
DRIFT/USDT CAN ENTER ANY MOMENT THE BREAK OF $1

Dirft shows on low time interesting uptrend volume, what can get confirmed in the coming hours. we expect there is a possiblity for $1 break in the coming time.
Disclaimer
Any content and materials included in Sahmeto's website and official communication channels are a compilation of personal opinions and analyses and are not binding. They do not constitute any recommendation for buying, selling, entering or exiting the stock market and cryptocurrency market. Also, all news and analyses included in the website and channels are merely republished information from official and unofficial domestic and foreign sources, and it is obvious that users of the said content are responsible for following up and ensuring the authenticity and accuracy of the materials. Therefore, while disclaiming responsibility, it is declared that the responsibility for any decision-making, action, and potential profit and loss in the capital market and cryptocurrency market lies with the trader.