
SiDec
@t_SiDec

What symbols does the trader recommend buying?
Purchase History
پیام های تریدر
Filter
SiDec
Algorithmic Trading vs Manual Trading

Why the Edge Is Shifting And Why 2026 May Be a Turning Point As this year comes to an end, it’s the perfect moment to slow down, zoom out, and ask an uncomfortable but necessary question: Are we trading the markets — or are the markets trading us? Whether you are in your first year of trading or have spent a decade studying charts, there comes a moment of clarity where you ask yourself: “If I know what to do… why don’t I always do it?” Beginners ask this after their first emotional mistake. Experienced traders ask it after their hundredth. The market does not punish ignorance as harshly as it punishes inconsistency. Most traders don’t fail because they lack knowledge. They fail because they are human. We all know this pattern: The entry is clear but hesitation creeps in The stop is defined but gets adjusted “just a little” The trend is obvious yet profits are taken too early The system says don’t trade but emotions say this time is different At the end of the day, trading is not a battle against the market. It’s a battle against ourselves. And that’s exactly where algorithmic (systematic) trading enters the game. Not as a shortcut, not as a holy grail, but as an evolution of execution. Now, with AI evolving rapidly and tools becoming accessible to retail traders, something big is happening: The same systematic edge institutions used for years is now available to individuals. That raises a powerful question: Can a system (without emotion, instinct, or fear) trade better than a human? After spending the last 6–8 months deeply immersed in algorithmic trading, intense backtesting, rule-building, and system refinement, I came to a conclusion: Algorithmic trading is not just the future, it’s the logical evolution of trading itself. And I strongly believe 2026 will be a major turning point. Let’s break this down properly. Manual Trading (Human Trading) → The Strengths & The Silent Killers Manual trading is where almost everyone starts and for good reason. What humans do exceptionally well Pattern recognition Context awareness and regime interpretation Macro, narrative, and sentiment understanding Adaptation during abnormal market conditions For experienced traders, discretion often becomes earned intuition. But here’s the uncomfortable truth: The better you get, the more painful your mistakes become. Why? Because you know better yet still break your own rules. Humans are great at ideas. But trading success doesn’t come from ideas. It comes from execution → repeated thousands of times. And this is where humans struggle most. The Complete List of Human Trading Failures (The Real Reason Most Traders Lose) Regardless of experience, humans share the same failure modes. Here’s the part most people avoid talking about. Emotional failures Fear when price approaches entry Greed when price runs in profit Panic after one losing trade Overconfidence after a winning streak Revenge trading to “get it back” Execution & discipline failures Moving stop losses too early Widening stops to avoid realizing a loss Taking profit early because “it’s green now” Ignoring your system once emotions kick in Changing rules mid-trade Cognitive biases (even in professionals) Confirmation bias (seeing only what supports your bias) Recency bias (overweighting the last trade) Anchoring to entry price Counter-trading the trend because price “feels extended” Lifestyle & state-based issues Trading tired Trading stressed Trading distracted Trading emotionally impacted by life events The classic question every trader has asked: “Why did I take profit so early when the trend was obvious?” Or: “Why did I counter-trade when the moving averages clearly showed downside momentum?” These aren’t skill problems. They are human problems. The Hard Truth: Trading Is an Execution Game Markets reward: Consistency Repetition Risk control Statistical edge They do not reward: Creativity during execution Emotional intelligence in drawdowns Smart excuses Execution quality determines outcomes and execution is precisely where humans are weakest. Algorithmic Trading → What Changes When Rules Take Control Algorithmic trading removes the weakest link in trading: The trader. A system: Doesn’t feel fear, stress, fatigue, or boredom Doesn’t reinterpret rules mid-trade Doesn’t revenge trade Doesn’t move stops Doesn’t second-guess Doesn’t hesitate It follows rules. Every single time. Key advantages of algorithmic trading Processes multiple data points simultaneously Executes instantly during fast price action Trades 24/7 without fatigue Applies identical risk rules every trade Can be objectively tested and measured There is no emotional deviation. And that alone is a massive edge. “But Humans Have Instinct” — The Big Myth Instinct is just pattern recognition shaped by experience. And patterns can be quantified. If a trader can explain why they take a trade that logic can be turned into rules. And rules can be executed better by machines. Win Rate Reality — How High Can It Really Go? When I began researching existing algo traders: Some had ~60% win rates with solid returns Some reached 70–80% That sparked a question I wrote down and circled: “Is a 90% win rate even possible?” So I tested. Started with swing trading systems Moved to intraday Then scalping Simplified rules instead of complexity Tested only what truly mattered After months of backtesting and refinement: Achieving high-precision win rates of 80–90% across various asset classes, with drawdowns kept to an absolute minimum. It proved something deeper: Precision trading is possible when emotion is removed. Important Reality Check (Especially for Experienced Traders) High win rate does not automatically mean profitability. What truly matters: Risk-to-reward Drawdowns Expectancy Consistency Longevity over multiple market regimes A system must survive: Trending markets Ranging markets High volatility Low volatility Durability beats elegance. Always. The Real Future of Trading (2025–2030) Here’s how I see it: More traders will become system builders, not button clickers Manual trading will shift toward monitoring & strategy design AI will assist in: Data filtering Pattern discovery Optimization Hybrid approaches will dominate: Machines execute Humans supervise Manual trading won’t disappear but manual execution will. My Personal Conclusion Manual trading becomes validation Algorithmic trading becomes execution Humans decide what to trade Systems decide how to trade That’s evolution. Final Thoughts — End of Year Message 🎄 As the year comes to an end, take time to reflect: What worked What didn’t Where emotions interfered Where rules could replace decisions Trading is a long-term game. The goal isn’t to trade more it’s to trade better. Merry Christmas to everyone! May the next year bring clarity, discipline and growth — both in trading and in life. The edge is shifting. And those who adapt early will lead. Would love to hear your thoughts: Are you trading fully manual? Hybrid approach? Or already building systems? _________________________________ 💬 If you found this helpful, drop a like and comment!
SiDec
هشدار سقوط نصفه قیمت ZEC: آیا منتظر ریزش به ۲۵۰ دلار باشیم؟
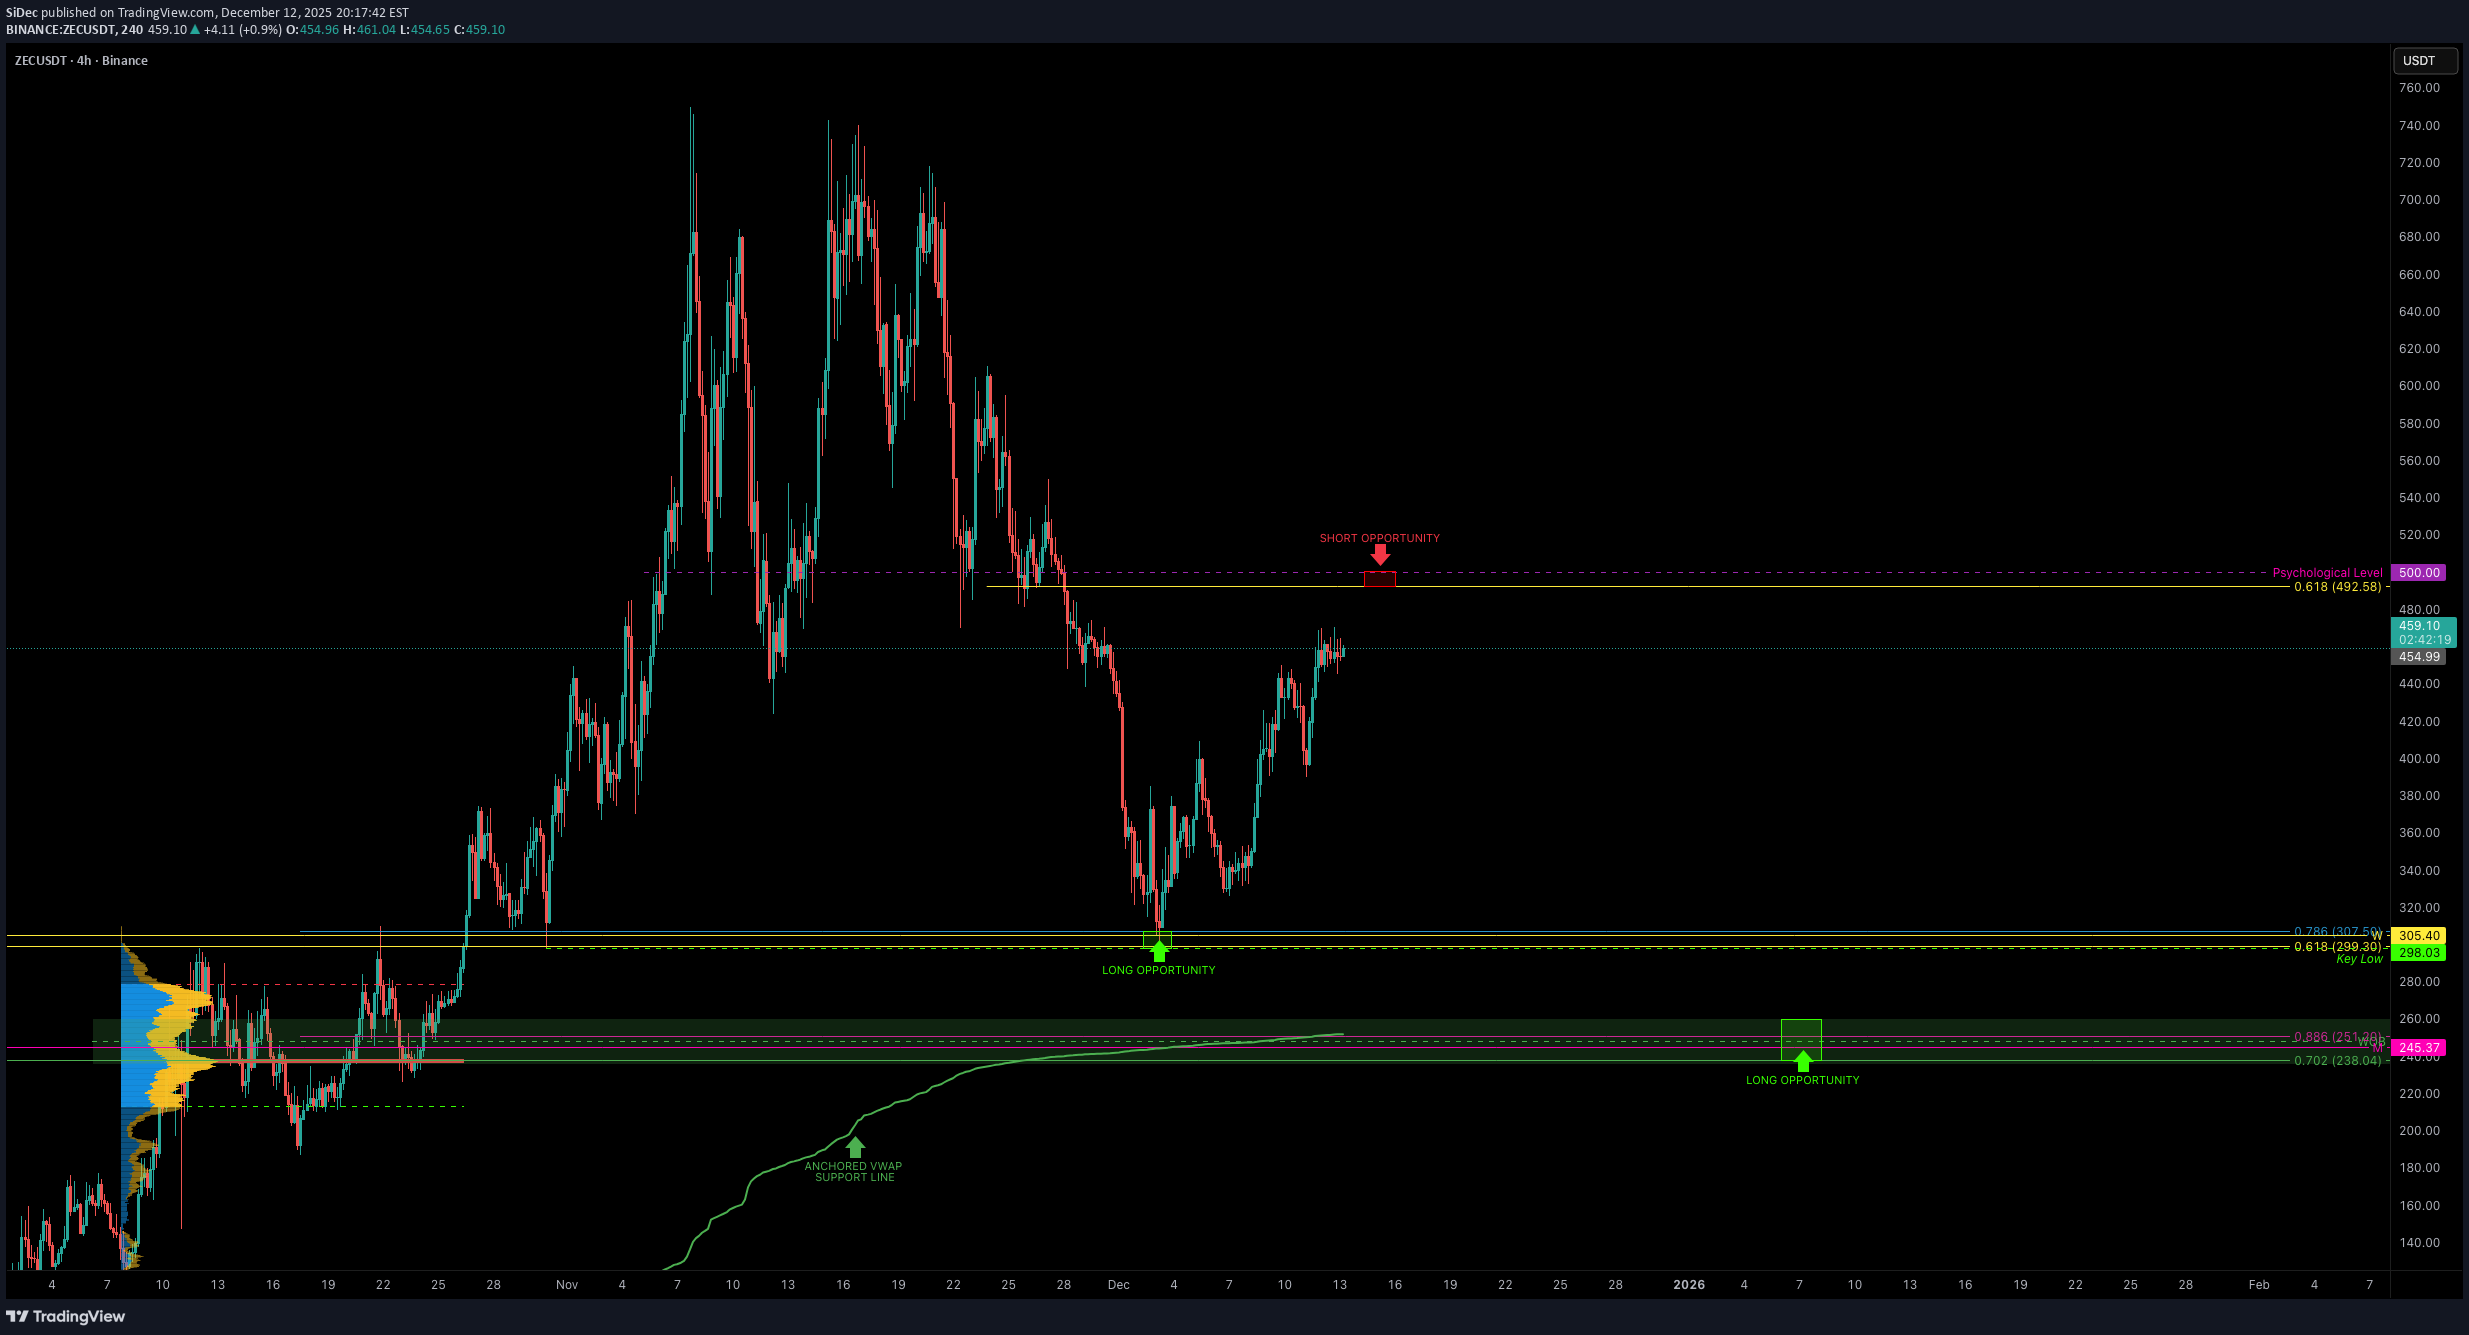
ZEC has had one of the wildest runs this year, a +2000% explosion from August to November, all in just 80 days, before topping out at $750. Moves that go vertical like this tend to unwind just as aggressively, and ZEC did exactly that: a sharp –60% correction back into the $300 support zone. That reaction wasn’t random, $300 was a major confluence level: 0.618 Fib retracement of the entire +2000% move Weekly level lining up cleanly 0.786 Fib of the smaller impulsive wave Altogether, an ideal spot for a bounce and that’s exactly what we saw. Looking at the current structure, here’s what I’d like to see next: 1. A move toward $500 → Short opportunity $500 should now act as a psychological resistance level and would be the perfect area for a rejection. 2. A drop into the $250 region → Long opportunity This zone is stacked with confluence: 0.702 Fib sweet-spot entry of the entire move 0.886 Fib retracement (deep retrace zone) Weekly order block Anchored VWAP Monthly level POC This makes $250 a very attractive long-entry, with a simple target back toward $300. Educational Insight Parabolic moves like ZEC’s +2000% rally in such a short time almost never resolve sideways. When price accelerates this fast, the market typically needs time to rebalance value. This usually happens through deep retracements and distribution structures. The first major retrace to the 0.618 Fib often acts as a relief bounce, which we already saw around $300. This bounce doesn’t mean the trend is healthy again it usually represents short covering and dip-buyers stepping in early. Structurally, these bounces often lead to lower highs, forming patterns like Head & Shoulders or broader distribution ranges. Deeper retracement levels such as the 0.786 and 0.886 Fib tend to be where strong hands accumulate, especially when they align with: Anchored VWAPs (fair value over time) High-volume nodes (POC) Higher-timeframe order blocks Monthly or weekly levels This is why the $250 zone stands out. It’s not just “another support”, it’s where multiple market participants agree on value, which increases the probability of a meaningful reaction. On the flip side, psychological levels like $500 often attract late buyers and breakout traders during corrective rallies. When momentum fades into these areas, they frequently become ideal zones for short entries, especially if volume dries up or rejection wicks form. Key takeaway: Instead of chasing fast moves, focus on where value is likely to be defended or rejected. High-probability trades are built where structure, Fibonacci, volume, and VWAP all align. In summary: ZEC is offering two solid setups → one on the short side near $500, and one long near $250. Set alerts on both levels and wait for the reaction. _________________________________ 💬 If you found this helpful, drop a like and comment!
SiDec
تحلیل انفجاری SUI: منطقه خرید طلایی با ریسک به ریوارد 1 به 6 کجاست؟
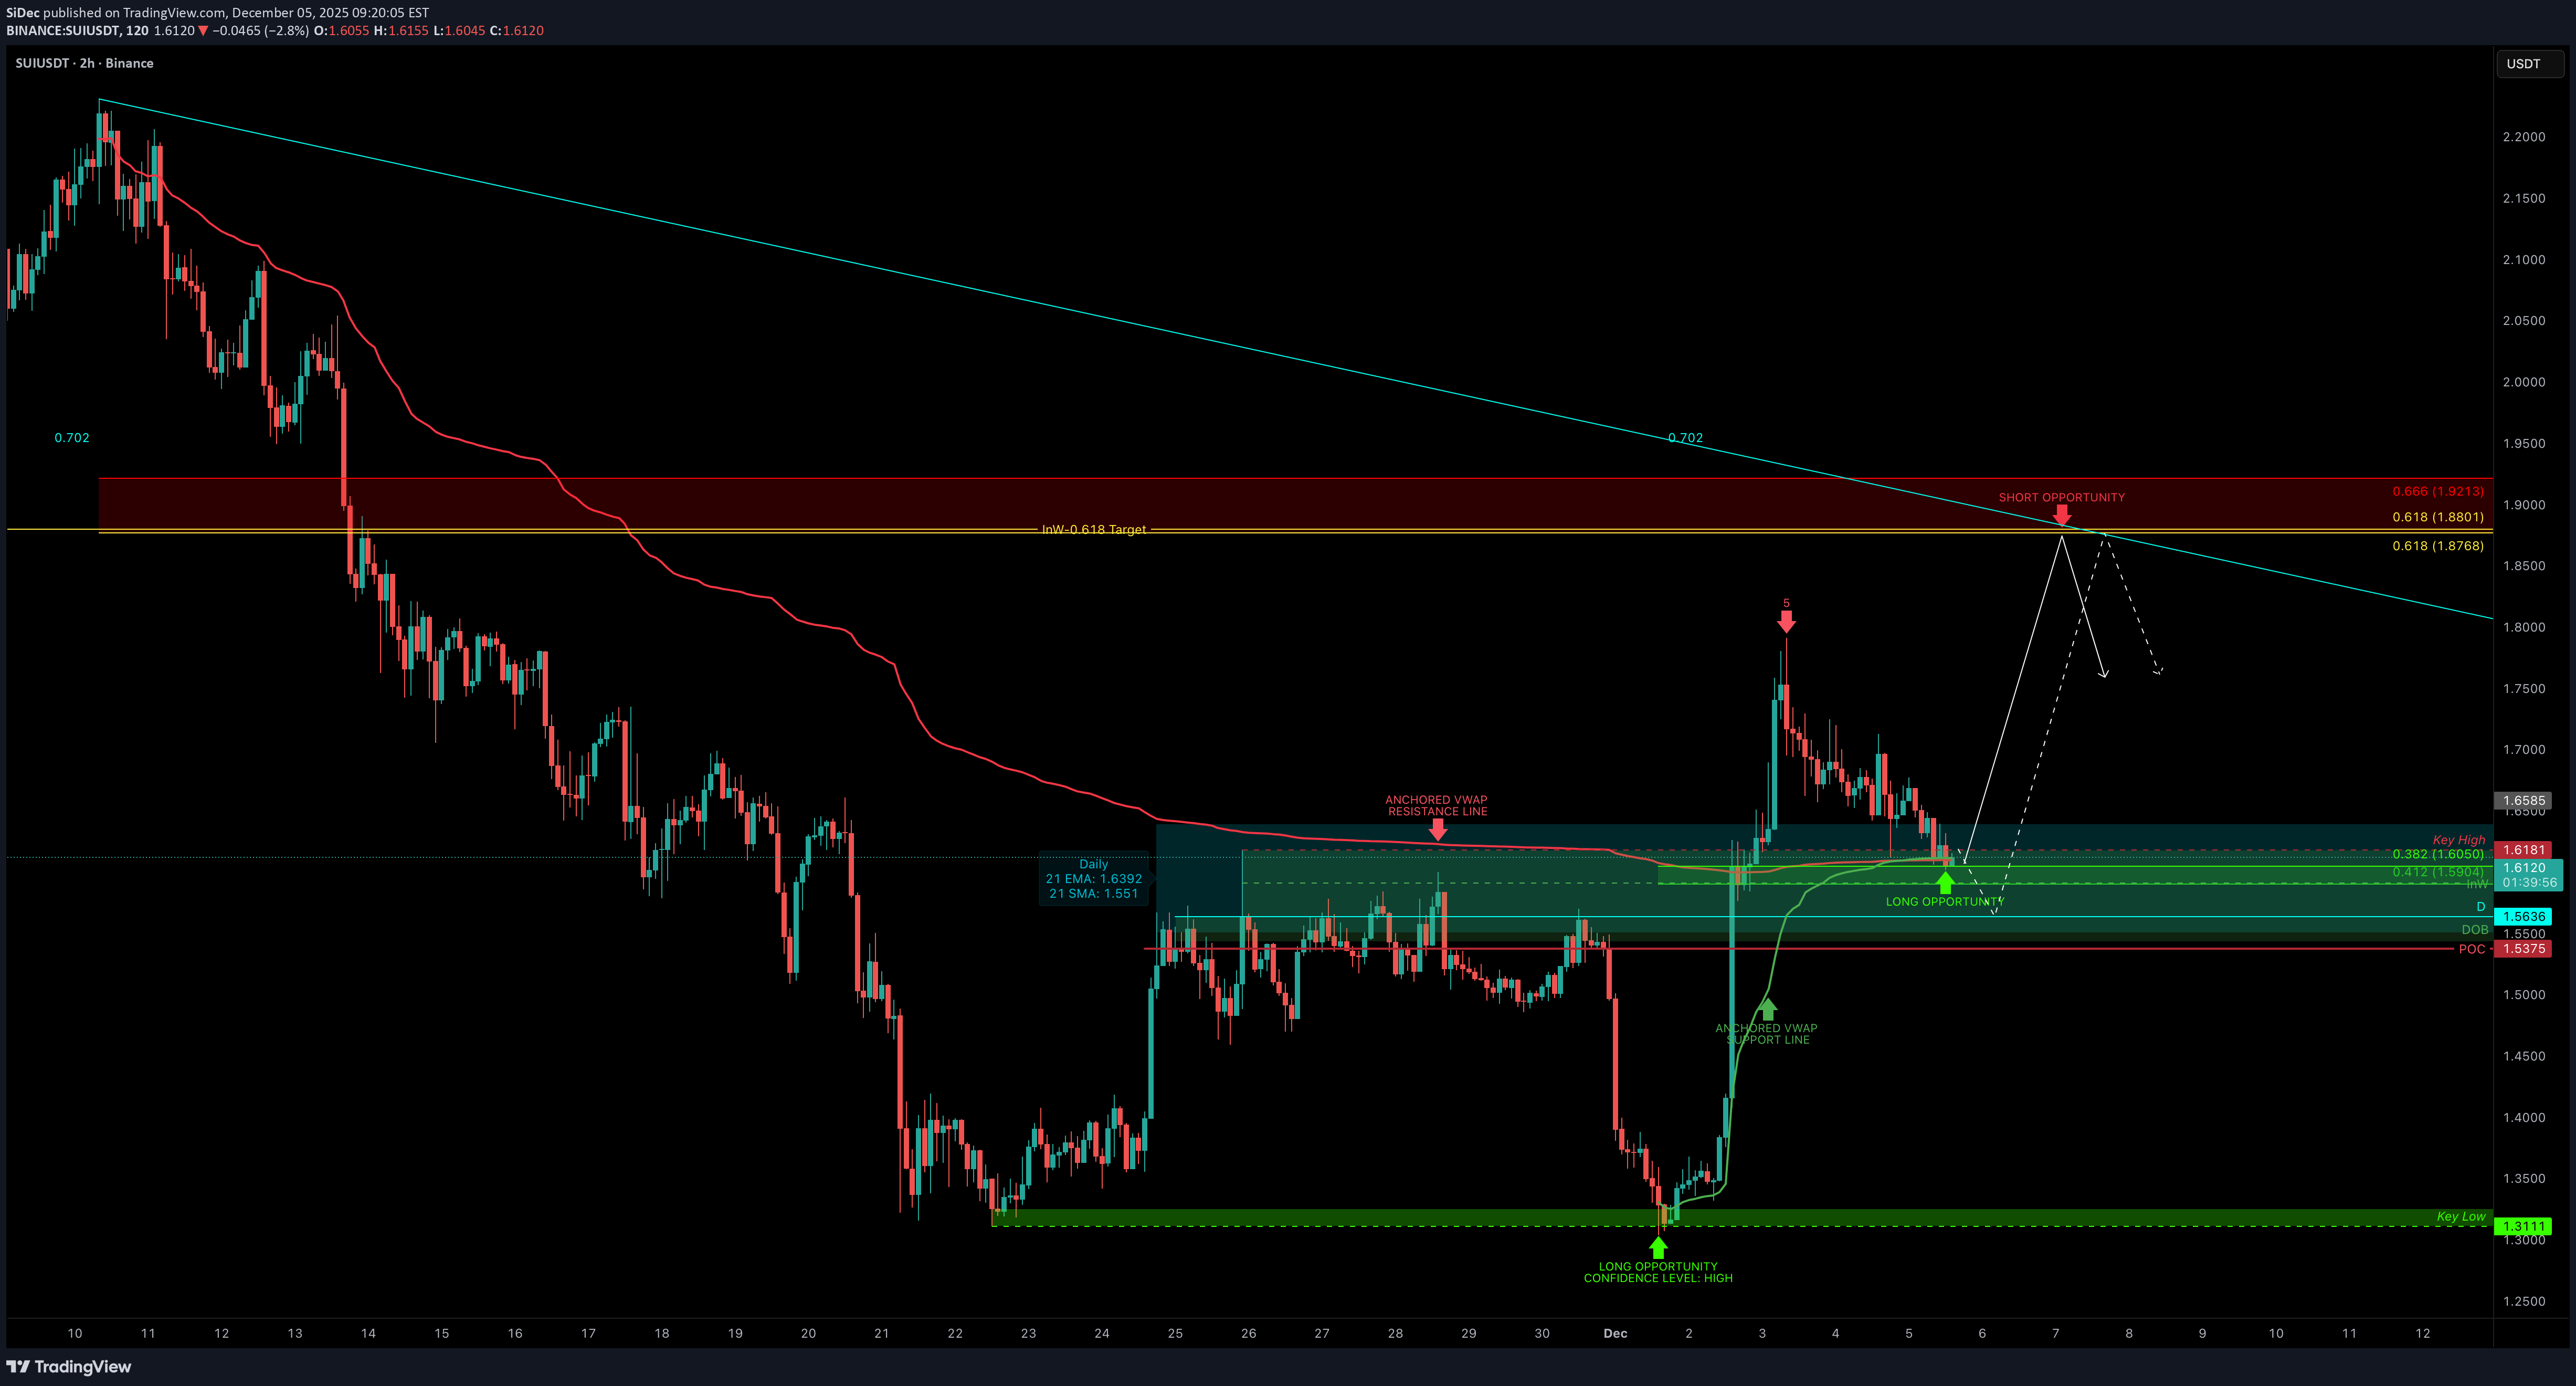
SUI just delivered one of the cleanest moves. After sweeping the liquidity low at $1.3111, price launched nearly +40% in under two days, ripping through a full 5-wave impulse and breaking market structure. Now that the fast move is done, the real question is: Where’s the next high-probability setup? To answer that, we break down the support/resistance zones, VWAP structure, Fibonacci levels, and market cap confluence that are now forming. 1. The Key Support Cluster at $1.60 To map the next setup, we first look for strong support. And right now, $1.60 is loaded with confluence: Anchored VWAPs from both the swing low ($1.3039) and swing high ($2.231) meet at roughly $1.60 Fibonacci Retracement The 0.382 retracement of the entire impulse sits exactly at $1.60. After fast moves, holding the 0.382 is typically what you want to see for bullish continuation. Dynamic EMAs & SMAs: Daily 21 EMA → $1.64, Daily 21 SMA → $1.55. These are dynamic tools, so they shift over time, but both are already closing in on the same zone. Daily level at $1.5636 POC of the previous range at $1.5375. Both overlap with the daily order block, adding confidence. Monthly Anchored VWAP. Currently around $1.5782, giving this area even more weight. Market Cap Confluence $1.60 ≈ 6B market cap $1.87 ≈ 7B market cap I like using market caps as macro support/resistance, and these levels line up beautifully. All in all, $1.55–$1.60 is shaping up as the main demand zone. 2. Upside Target → the 0.618 Fib Using the retracement from the downward move ($2.231 → $1.3039), the 0.618 Fib sits at $1.8768. This also lines up with the 7B market cap and previous resistance structure. That makes it the main target for the next leg up. 3. Risk Management An entry between $1.60-$1.55 with an SL below the POC / order block allows for: R:R between 1:4 and 1:6 (depending on how you ladder) Clear invalidation Strong structural backing Multiple layers of confluence Summary SUI swept a major low, completed a sharp impulse, and broke market structure. Now it’s retracing into what looks like a high-confluence long zone around $1.55–$1.60. If this support zone holds, the next target is $1.87, giving a clean and logical long setup with solid R:R. 🔍 Indicators used Multi Timeframe 8x MA Support Resistance Zones [SiDec] → to identify support and resistance zones such as the daily 21 EMA/SMA. ➡️ Available for free. You can find it on my profile under “Scripts” and apply it directly to your charts for extra confluence when planning your trades. _________________________________ 💬 If you found this helpful, drop a like and comment!POC bounce:Closed the trade almost at breakeven after seeing no real follow through and a weak reaction. Waiting for the next setup.
SiDec
سول (SOL) در آستانه جهش؟ راز سطوح فیبوناچی و فرصت خرید طلایی در ۱۳۴ دلار!
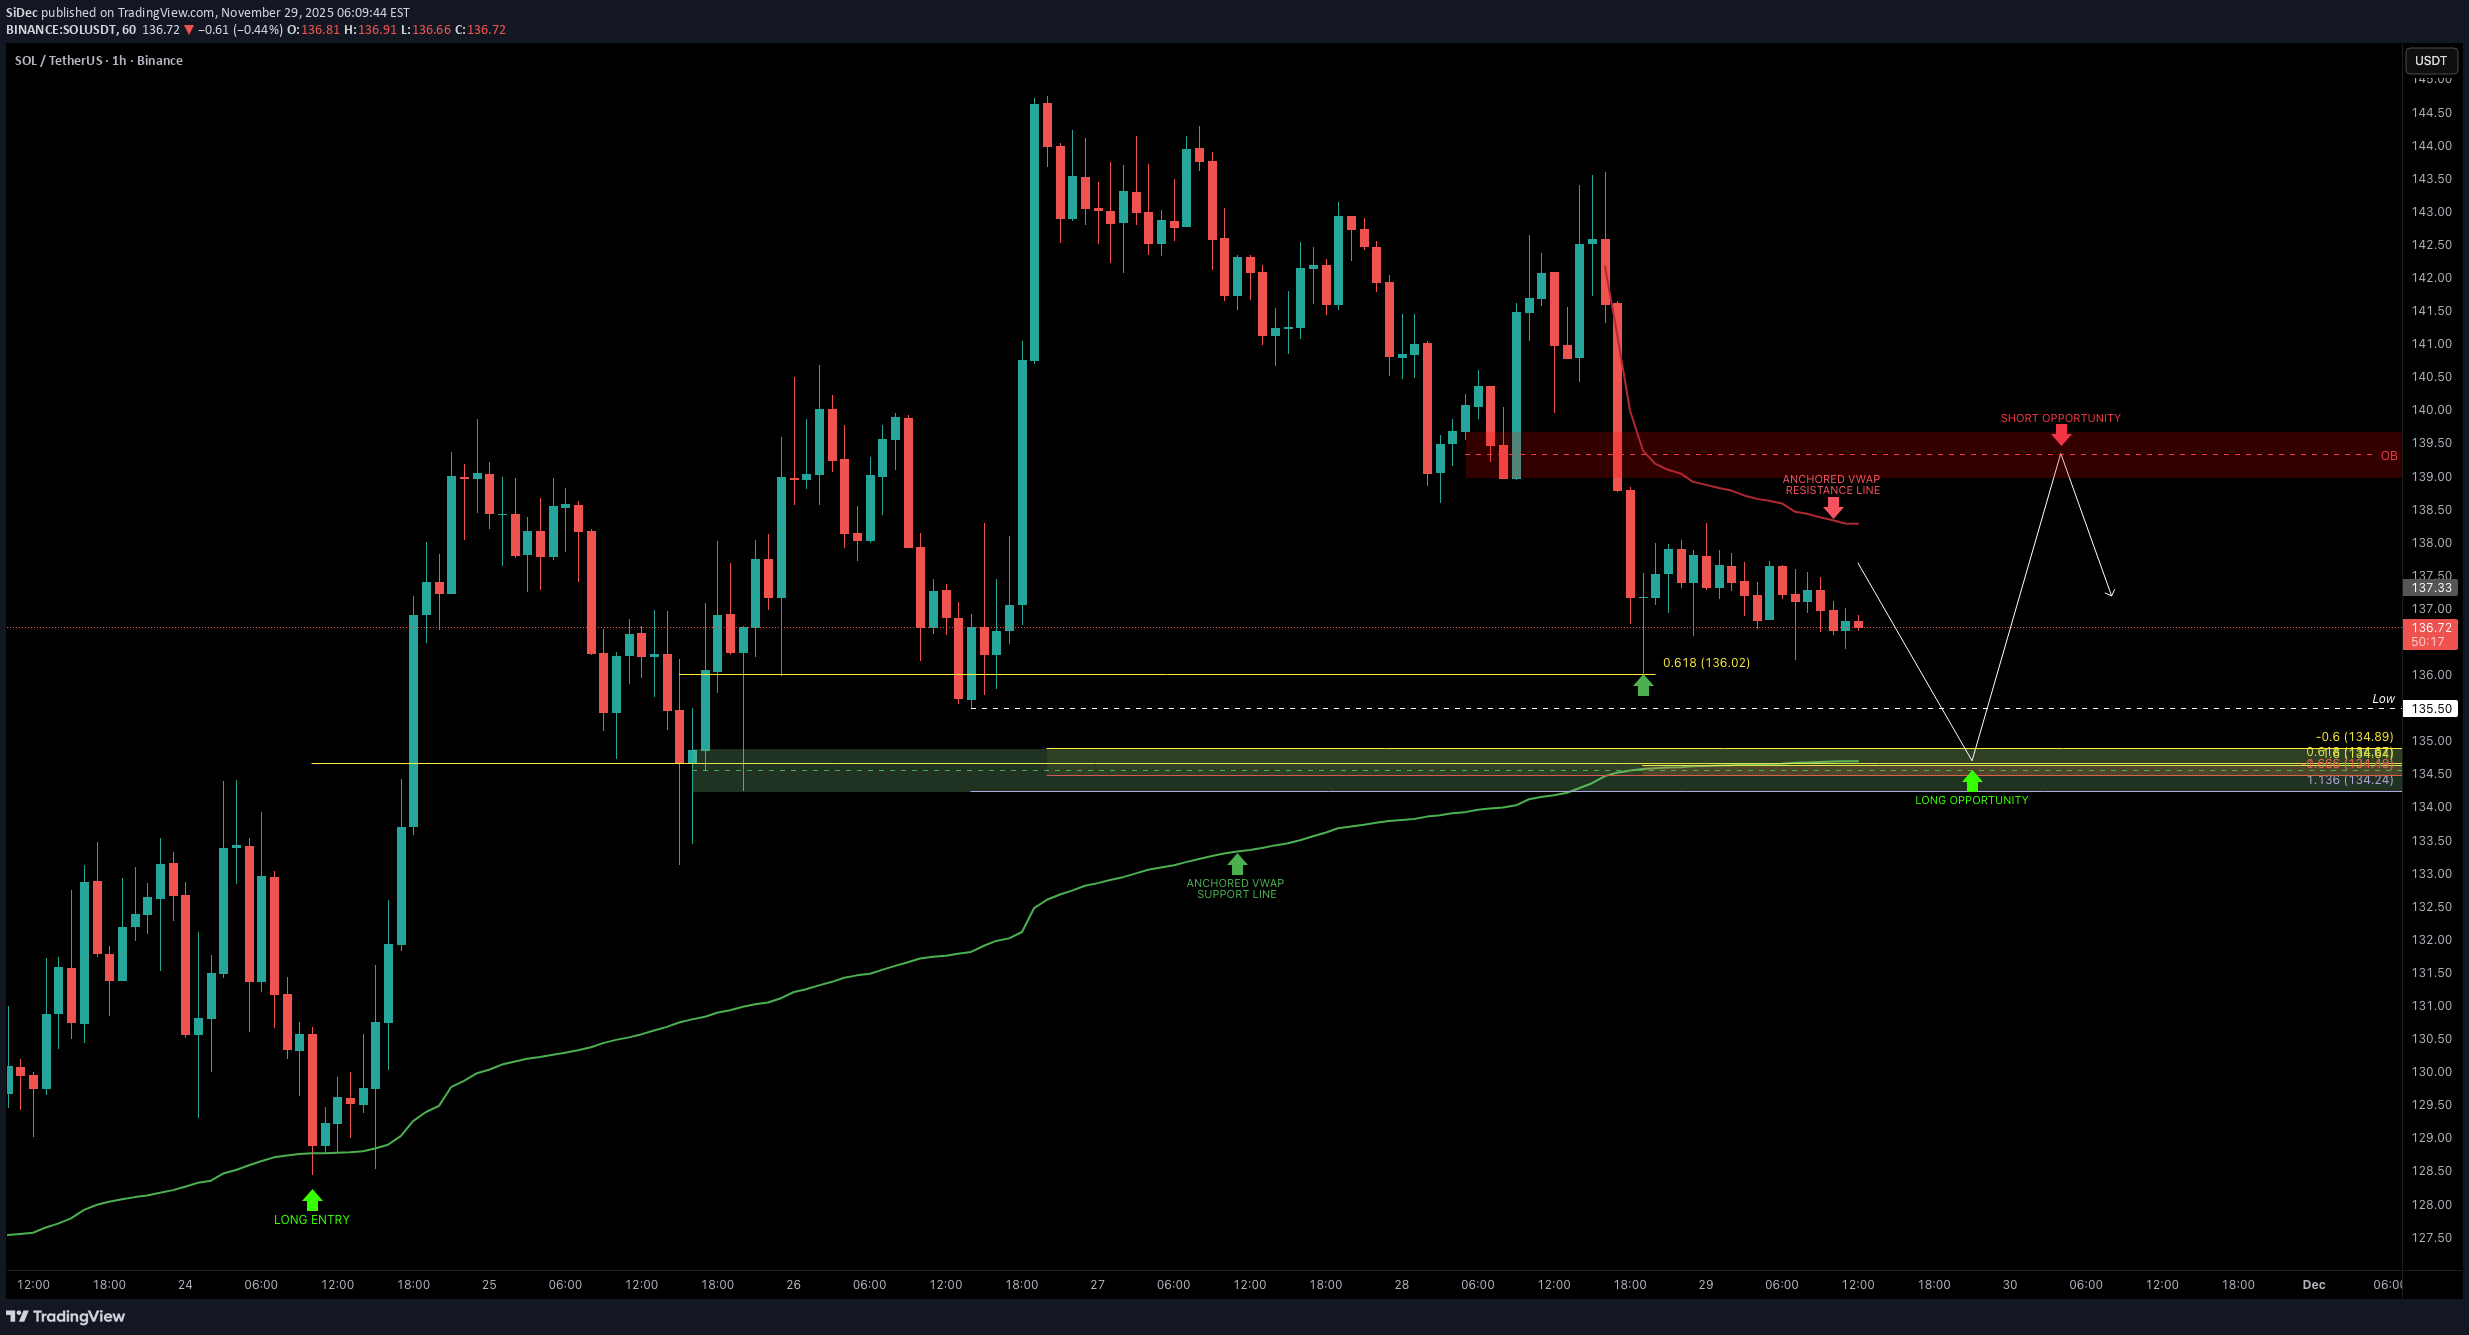
SOL continues to be one of the most technically reliable assets, consistently respecting Fibonacci levels and key market structures. The zone between $135–$134 stands out as the next high-probability long opportunity, with multiple Fibonacci clusters lining up with the anchored VWAP from the swing low. The $134 level also aligns with the 75B market cap, adding an additional layer of confluence. I’m looking for a long setup in this zone, targeting the $139–$140 order block for TP. This gives a clean 1:3 R:R, with the stop placed just below $133. I’m currently developing a dynamic confluence indicator that highlights stacked support and resistance zones with high-probability reversal zones. The $139–$140 zone is currently showing a cluster of resistance, reinforcing it as the ideal TP target. _________________________________ 💬 If you found this helpful, drop a like and comment!SOL Update: Both setups played out beautifully =) precision trading at its finest. First the long entry from the anchored VWAP support in confluence with the -0.618 Fib, followed by the short from the anchored VWAP resistance aligning with the 0.6 Fib. Why precision entries matter: Once price bounces cleanly from your level, you can immediately take risk off the table, remove emotional pressure, and manage the trade from a position of strength. If SOL pulls back again, the next high-probability long setup sits around $133, where multiple confluences come together: Swing low at $133.13 → liquidity -0.618 Fib projection at $132.70 -1 Fib extension at $132.43 Value Area Low sitting on the -0.618 Fib
SiDec
فایبوناچی و VWAP: راز معاملات دقیق اتریوم (ETH)
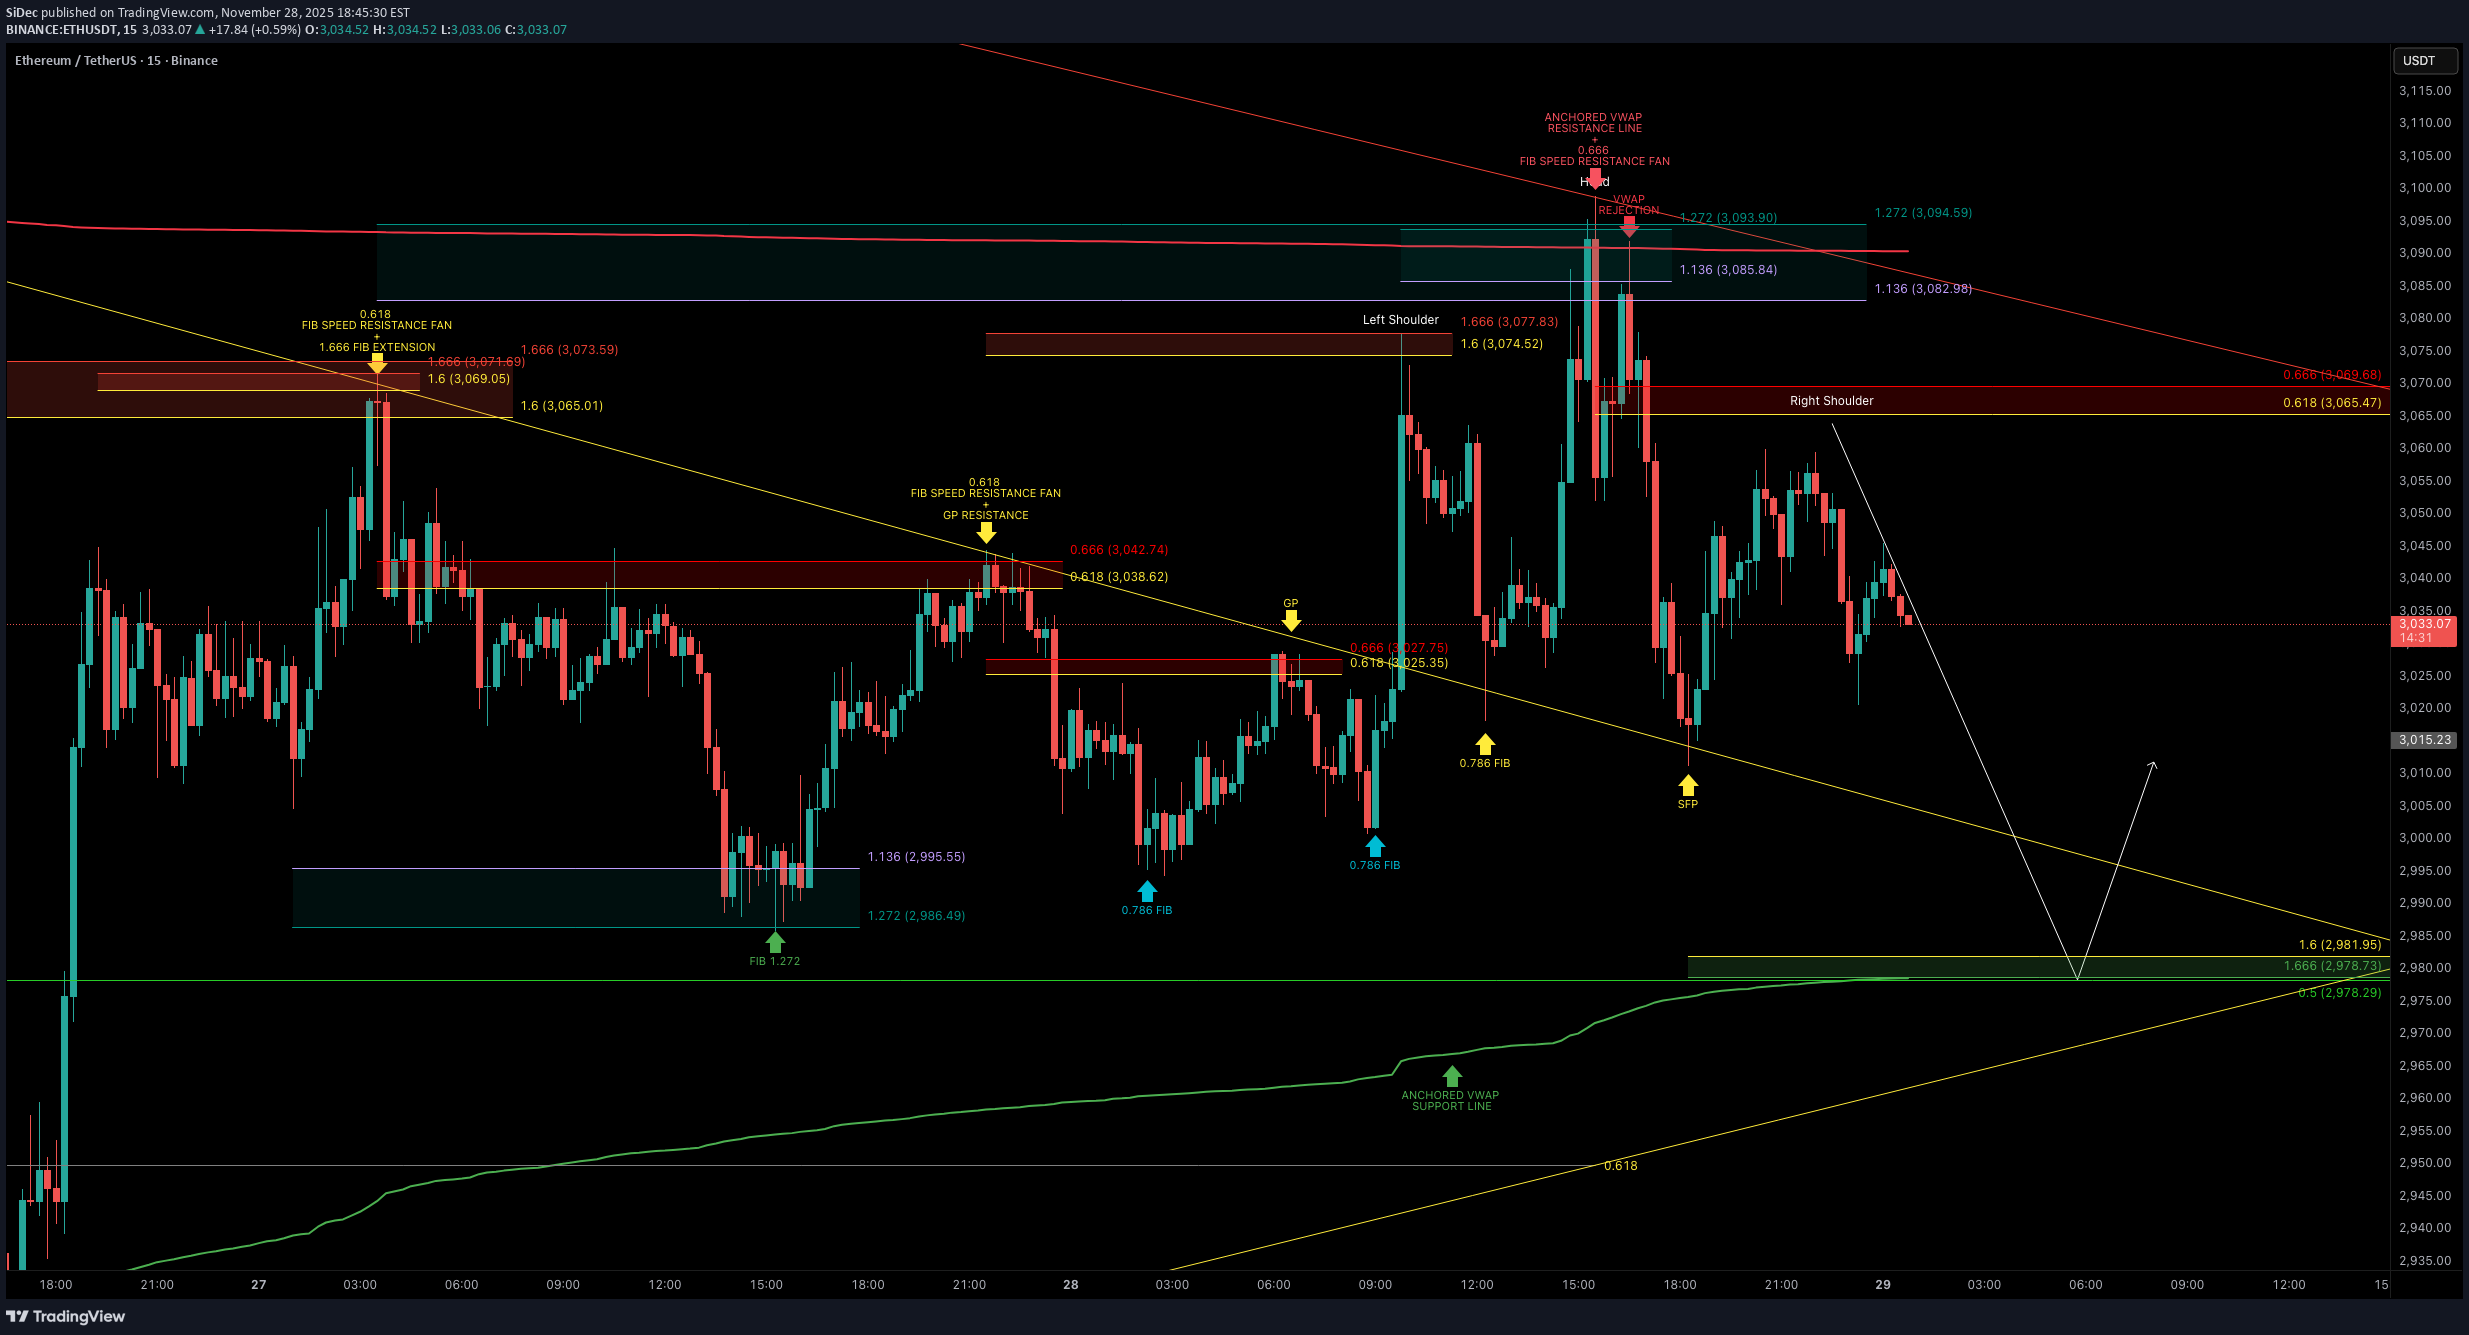
Understanding Tools, Confluence & Today’s Setup I’ve been getting a lot of DMs asking what the best indicator is. The truth? There is no universal “best indicator” because indicators are tools, and every tool serves a different purpose. Trading is like carrying a toolbox: the skill isn’t in having the tools, but in knowing when and how to use them. Educational Segment: Why Fibonacci Should Be Your Foundation After years of studying different systems, I’ve come to a very simple conclusion: 👉 Fibonacci tools are the most powerful and reliable in my entire arsenal. Why? They help you spot reversal zones with precision They work across all market conditions They are rooted in natural ratios that markets consistently gravitate toward They create predictable targets, retracements, extensions, and even timing when used correctly Indicators like oscillators etc. are best used as confirmation, not as the primary signal. If I had to pick one indicator besides Fibonacci, it would absolutely be the VWAP. Why the Anchored VWAP Is Incredibly Underrated It shows where true volume-weighted market support + resistance lies It adapts dynamically It works extremely well as a dynamic support/resistance line It is fantastic as a trailing stop-loss tool It helps identify institutional footprints in price structure Fibonacci + VWAP is one of the strongest forms of confluence you can build. ETH Technical Breakdown Today, ETH attempted a breakout but the move failed, and the rejection was clean. ETH rejected at the anchored VWAP aligned with Fibonacci reversal zone: ETH tested the anchored VWAP near $3,090 twice, coinciding with the 1.136–1.272 Fibonacci Reversal Zone. This confluence acted as a strong resistance, leading to a swift selloff soon after. Key Confluence Level Below: My next major downside target lines up with a cluster of confluences: 1.6-1.666 Fibonacci extension 0.5 Fibonacci retracement Anchored VWAP (green support line) Liquidity zone (demand area) 0.618 Fibonacci speed fan support Educational Takeaway → Confluence Is King If there’s one lesson to internalize: The more factors that align at the same level or zone, the higher the probability of a successful trade. This ETH range has provided several high-quality setups for anyone who understands how to read price through Fibonacci. Final Notes ETH remains in a well-defined trading range use confluence, stay patient, and let the market come to your level. _________________________________ 💬 If you found this helpful, drop a like and comment!Idea played out well, came close to the target before reversing. The next level I'm watching is the weekly VWAP lining up with the 0.618 fib around $2950
SiDec
هشدار زمستان بیت کوین: سقوط 36 درصدی؛ آیا زمان فروش فرا رسیده است؟
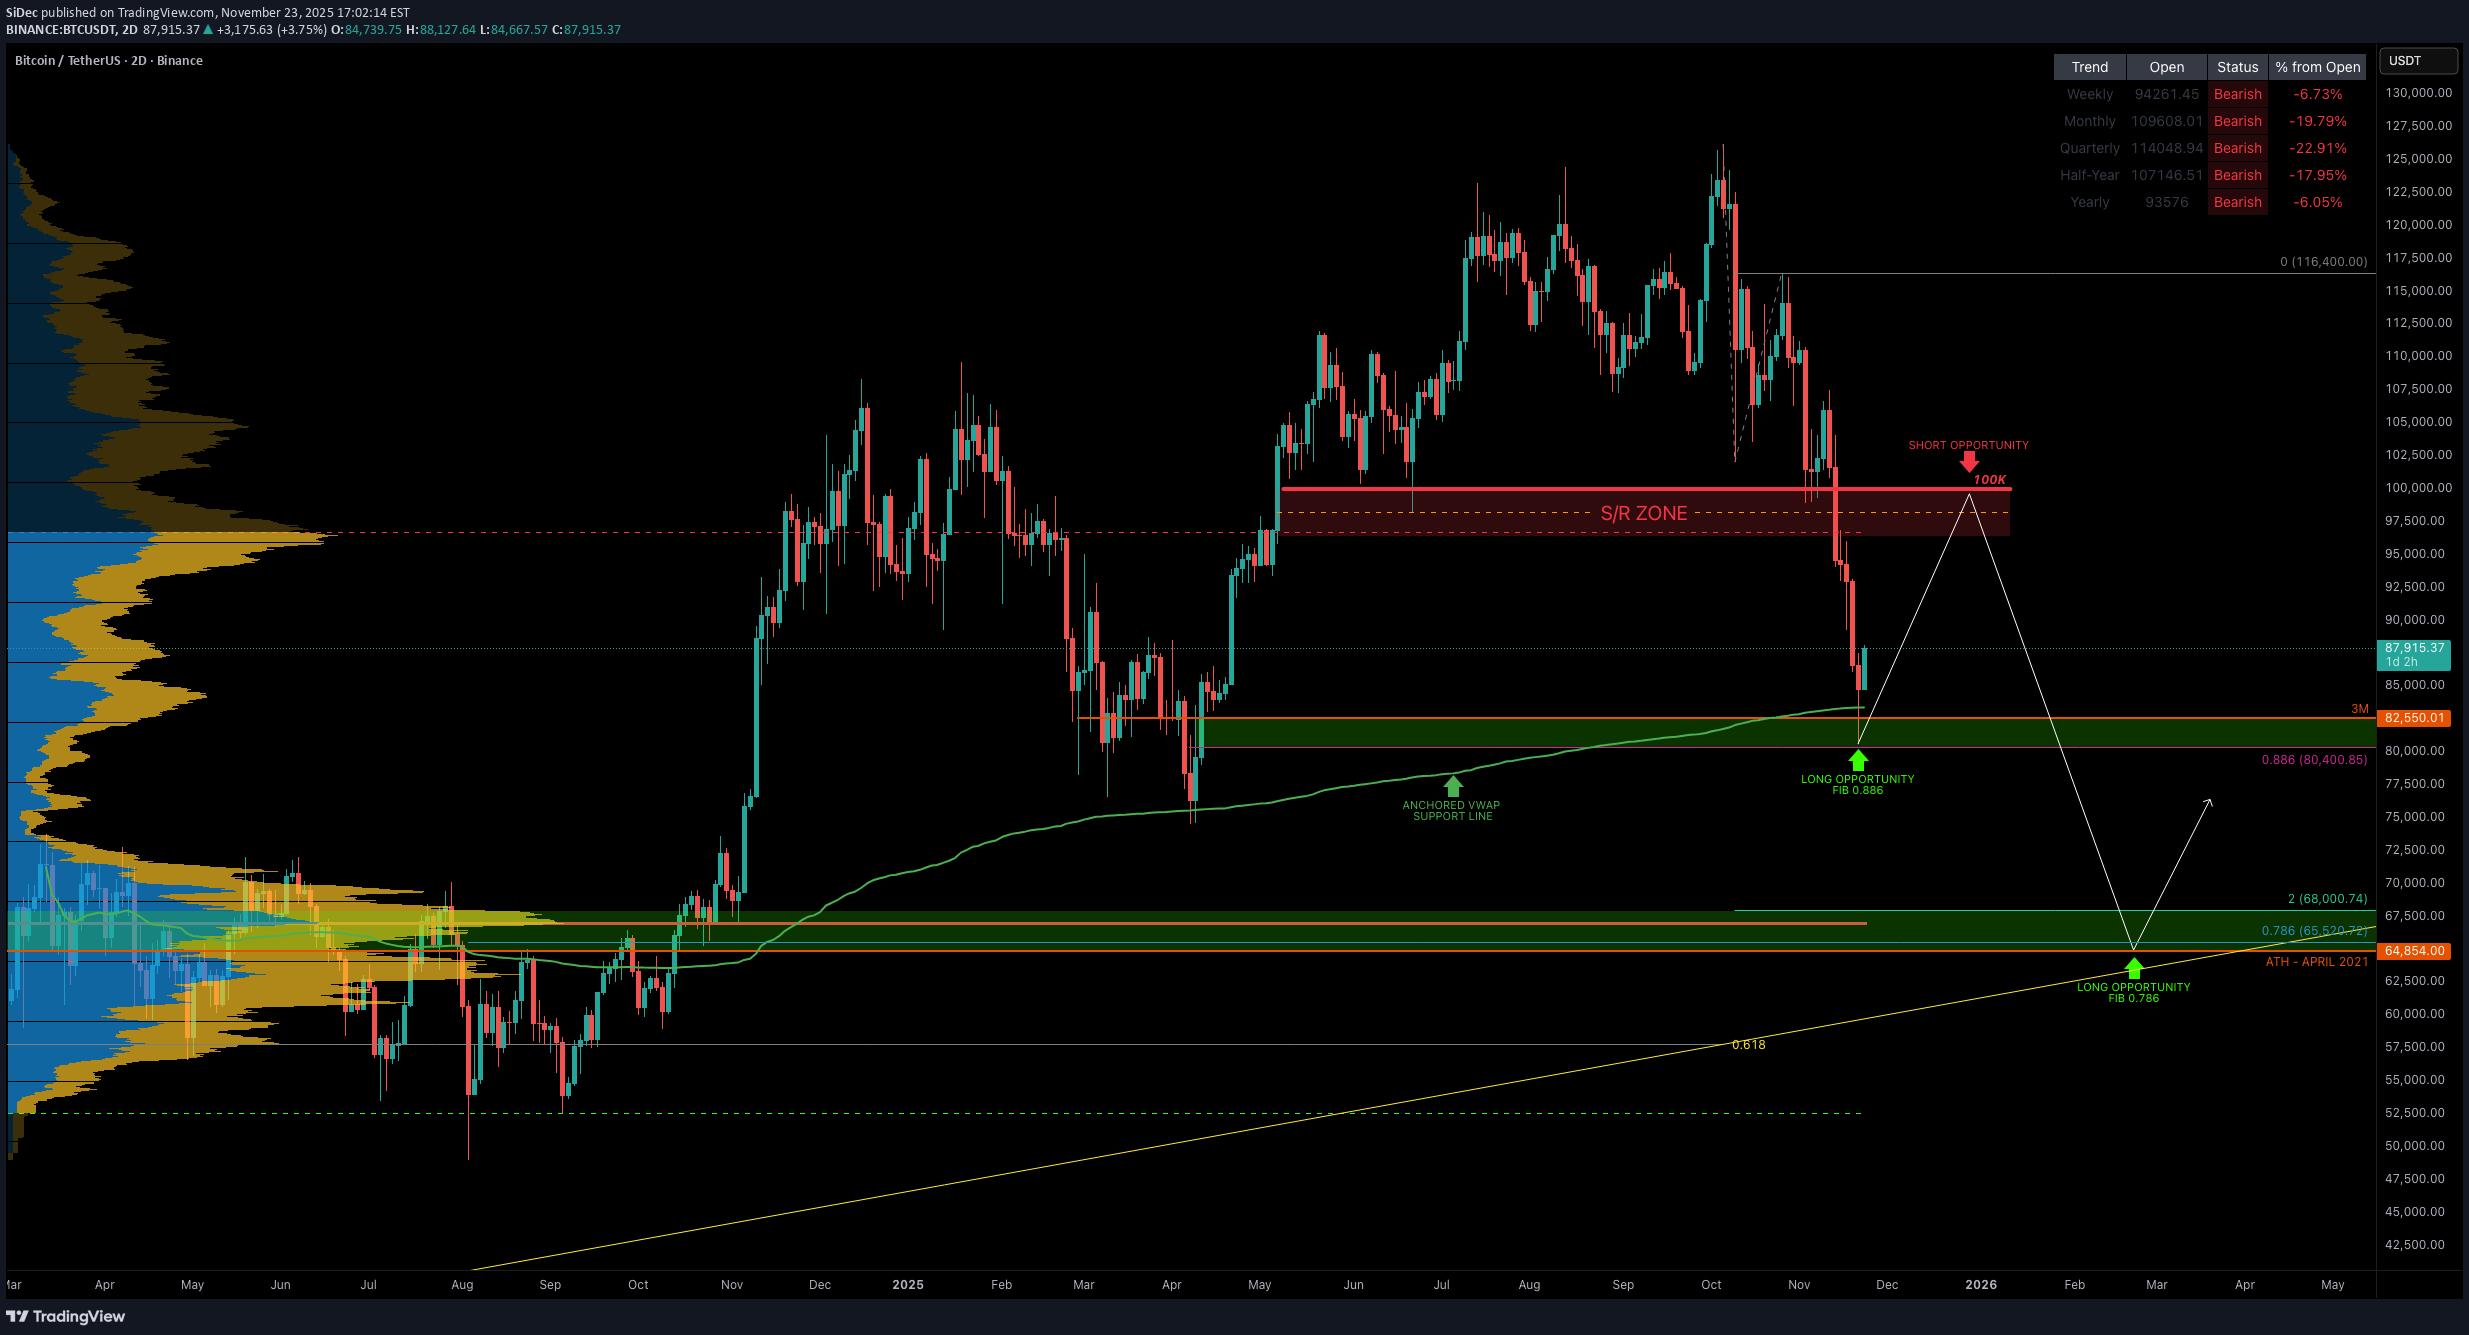
Is the Bitcoin bear market here? A deep dive Into cycles, tech risks & what comes next. Bitcoin has now dropped –36% from its all-time high in just 46 days, and naturally the big questions emerge: Has the bear market officially begun? How long could it last? And what catalysts could accelerate it? Let’s break this down from cycle structure to macro-technological risks. BTC Has Turned Bearish Across All Major Timeframes Bitcoin is now trading below the yearly open at $93,576, flipping all major timeframes into bearish alignment (from the daily to the yearly). Monthly MACD Bearish Cross Incoming The monthly MACD is set to print a bearish crossover this month. The last bullish MACD phase lasted 28 months, which has now ended → a strong macro signal. Cycle Timing: What History Says Historically, Bitcoin bottoms approximately one year after the top: 2017 → 2018: 363 days 2021 → 2022: 376 days If the current cycle repeats, the macro bottom may form around: October 2026 The previous bull market lasted 1061 days, this one 1050 days → almost identical. This strongly supports the thesis that the cycle has already peaked. How Low Could Bitcoin Go? Macro target: 0.786 Fibonacci Retracement → $39,173 Aligning with: Half-year 21 EMA confluence Macro corrective structures Prior cycle bear market depth Historical Precedent: The 2022 Bottom Zone Back in 2022, Bitcoin spent 210 days (over 7 months) consolidating at the bottom of the bear market. This was especially clear on the weekly timeframe, where price formed a clean multi-month accumulation range. Weekly TF: Daily TF: This is crucial context: 👉 The market gave more than half a year to load up at the bottom. No chasing, no rushing → anyone paying attention had time to scale into positions for the next cycle. The 2025 Macro Top Landed Perfectly in the 1.618–1.666 Fib Target Fib 1.618–1.666 → $122,056 – $125,218 This area was the ideal sell zone, and Bitcoin respected it perfectly. What happened after hitting the Fib target? The market entered a 3-month distribution phase, giving plenty of time to: scale out take profit derisk rotate into stablecoins or simplified portfolios Then came the aggressive sell-off → classic macro cycle behavior. Macro Catalysts That Could Drive the Bear Market Deeper 1️⃣ Quantum Computing Acceleration A credible quantum breakthrough (or even a strong rumor) could trigger systemic fear. Bitcoin’s ECDSA signatures are theoretically vulnerable to quantum attack models. 2️⃣ Fast-Paced AI Threats AI is accelerating: algorithmic optimization cryptographic analysis zero-day discovery hardware design The risk matrix is evolving faster than coding standards can update. 3️⃣ Regulatory Momentum Expect: stablecoin restrictions exchange tightening AML/KYC global enforcement This would accelerate risk-off behavior. Technical Confluence: Where BTC Is Now Monthly 21 EMA/SMA → 86.6K Current support test. Quarterly (3M) 21 EMA/SMA EMA: $58.5K SMA: $53.5K Strong structural support zone. Half-Year (6M) 21 EMA/SMA EMA: $39.5K SMA: $29.8K The EMA aligns perfectly with the 0.786 retracement → $39,173. Remember that the EMA/SMA levels mentioned are dynamic and will continue to shift over time as new price data comes in, so these confluence zones will gradually adjust. Additional Confluence: Potential Head & Shoulders (Bars Pattern Symmetry) A potential Head & Shoulders Pattern is forming in symmetry with the previous bull market top, as shown through the bars pattern overlay. Trading Playbook: Short the Bull Trap The most likely scenario: BTC bounces into $95K–$100K → traps late bulls → rejects → cascade lower Targets: TP1: $76K TP2: $70K Remaining: trail into $65K → $58K → $39K Final Outlook Bitcoin is now deeply aligned with a macro reversal: Perfect Fib 1.618–1.666 top Break of yearly open Cycle timing consistent Monthly MACD turning bearish Quantum + AI risk factors accelerating Structural confluence targets $70K → $40K Pattern mirroring the previous cycle top _________________________________ 💬 If you found this helpful, drop a like and comment!100K level matches up well with both monthly and yearly VWAP (mVWAP/yVWAP):
SiDec
سقوط آزاد سولانا (SOL) به کجا ختم میشود؟ بزرگترین فرصت خرید در کجاست؟
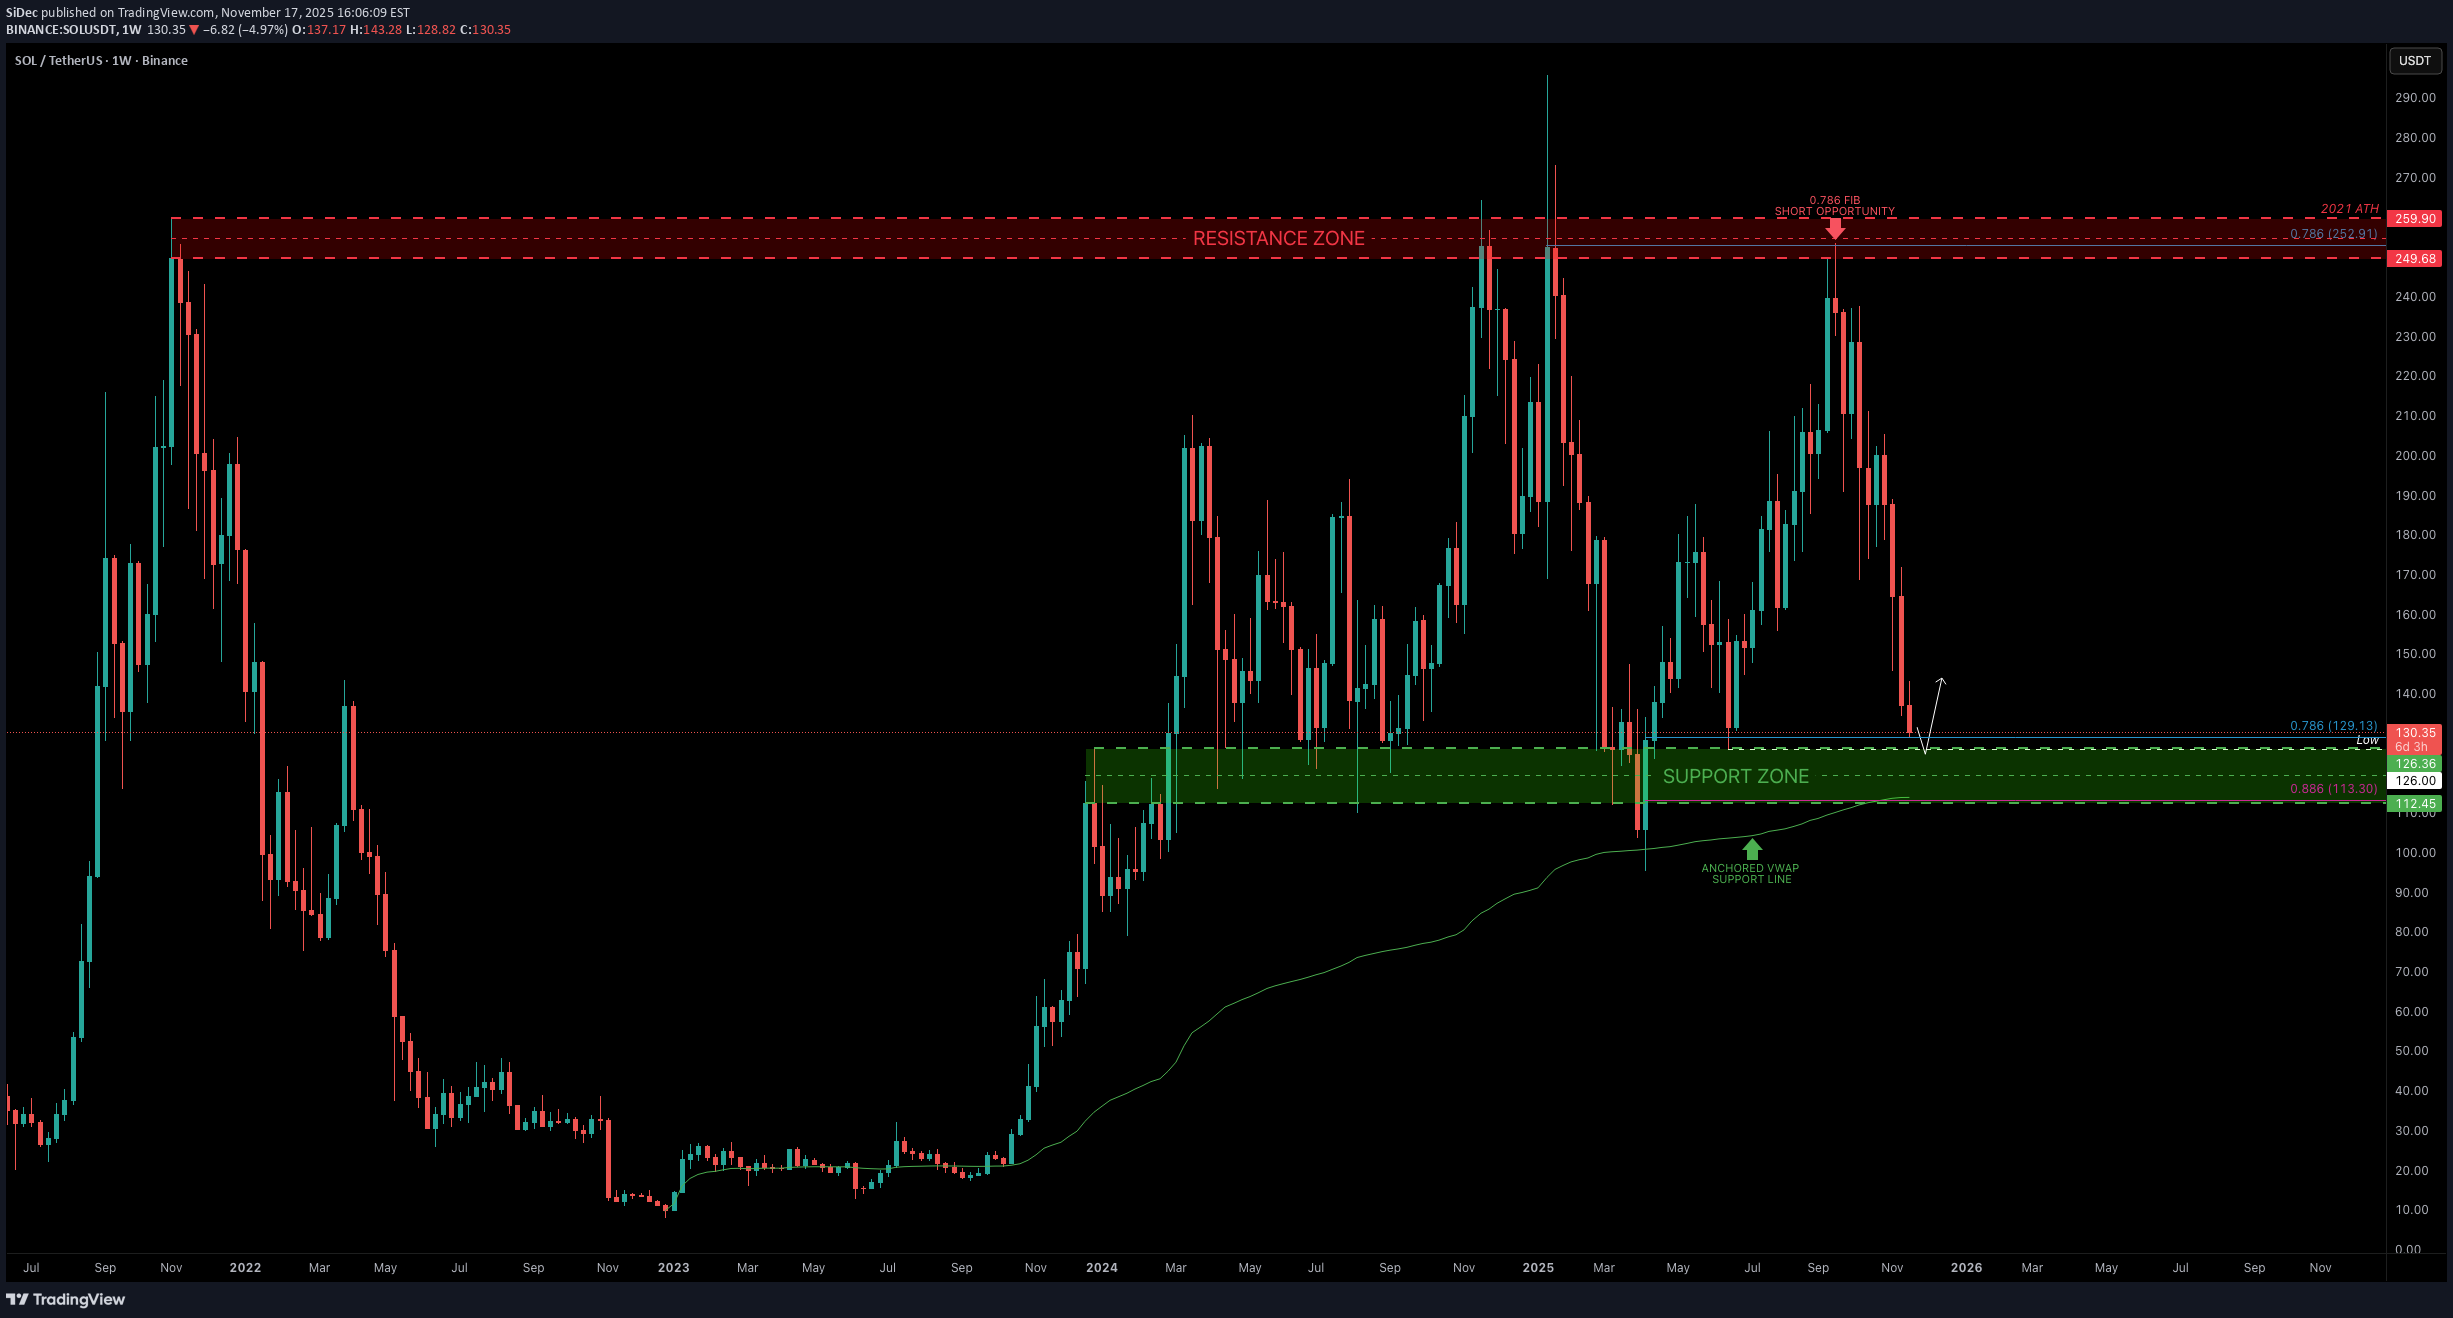
SOL has been in a steady freefall over the past weeks. On the higher timeframes the key support and resistance zones are very clearly defined. The $250 level acted as a big resistance area, with multiple rejections showing sellers were firmly in control up there. On the downside, the $125 support zone has shown clear strength, with bulls defending this area and producing strong bounces each time price revisited it. The swing low at $126 presents an attractive long opportunity, especially with the sell-side liquidity and the quarterly level at $124.54 sitting just below, adding further confluence. Additionally, the anchored VWAP from the $8 low lies around $114, aligning almost perfectly with the 0.886 Fibonacci retracement at $113.3, providing deeper support should price extend lower. Long Entry Zones: 0.786 Fib: $129.13 0.886 Fib: $113.3 Why the 0.786–0.886 Zone Is a Major Reversal Area The 0.786–0.886 Fib zone is one of the best spots to look for a reversal after a deep pullback. It’s where strong trends often take their final dip before bouncing. Here’s why it works so well: It’s the typical “deep correction” zone in strong trends. Price usually sweeps sell-side liquidity here before reversing. Many harmonic patterns use this exact area as their turning point. It often lines up with anchored VWAPs or volume nodes, adding extra support. It’s basically the capitulation zone where weak hands exit right before a bounce. Overall, it’s a clean area with clear invalidation and great R:R → perfect for spotting high-probability reversal setups. _________________________________ 💬 If you found this helpful, drop a like and comment!0.786 to 0.786 Fib Cycle: 60-Day Downtrend, -49% Pullback:
SiDec
فرصت خرید بزرگ بعدی ICP کجاست؟ تحلیل دقیق نقاط حمایتی حیاتی!
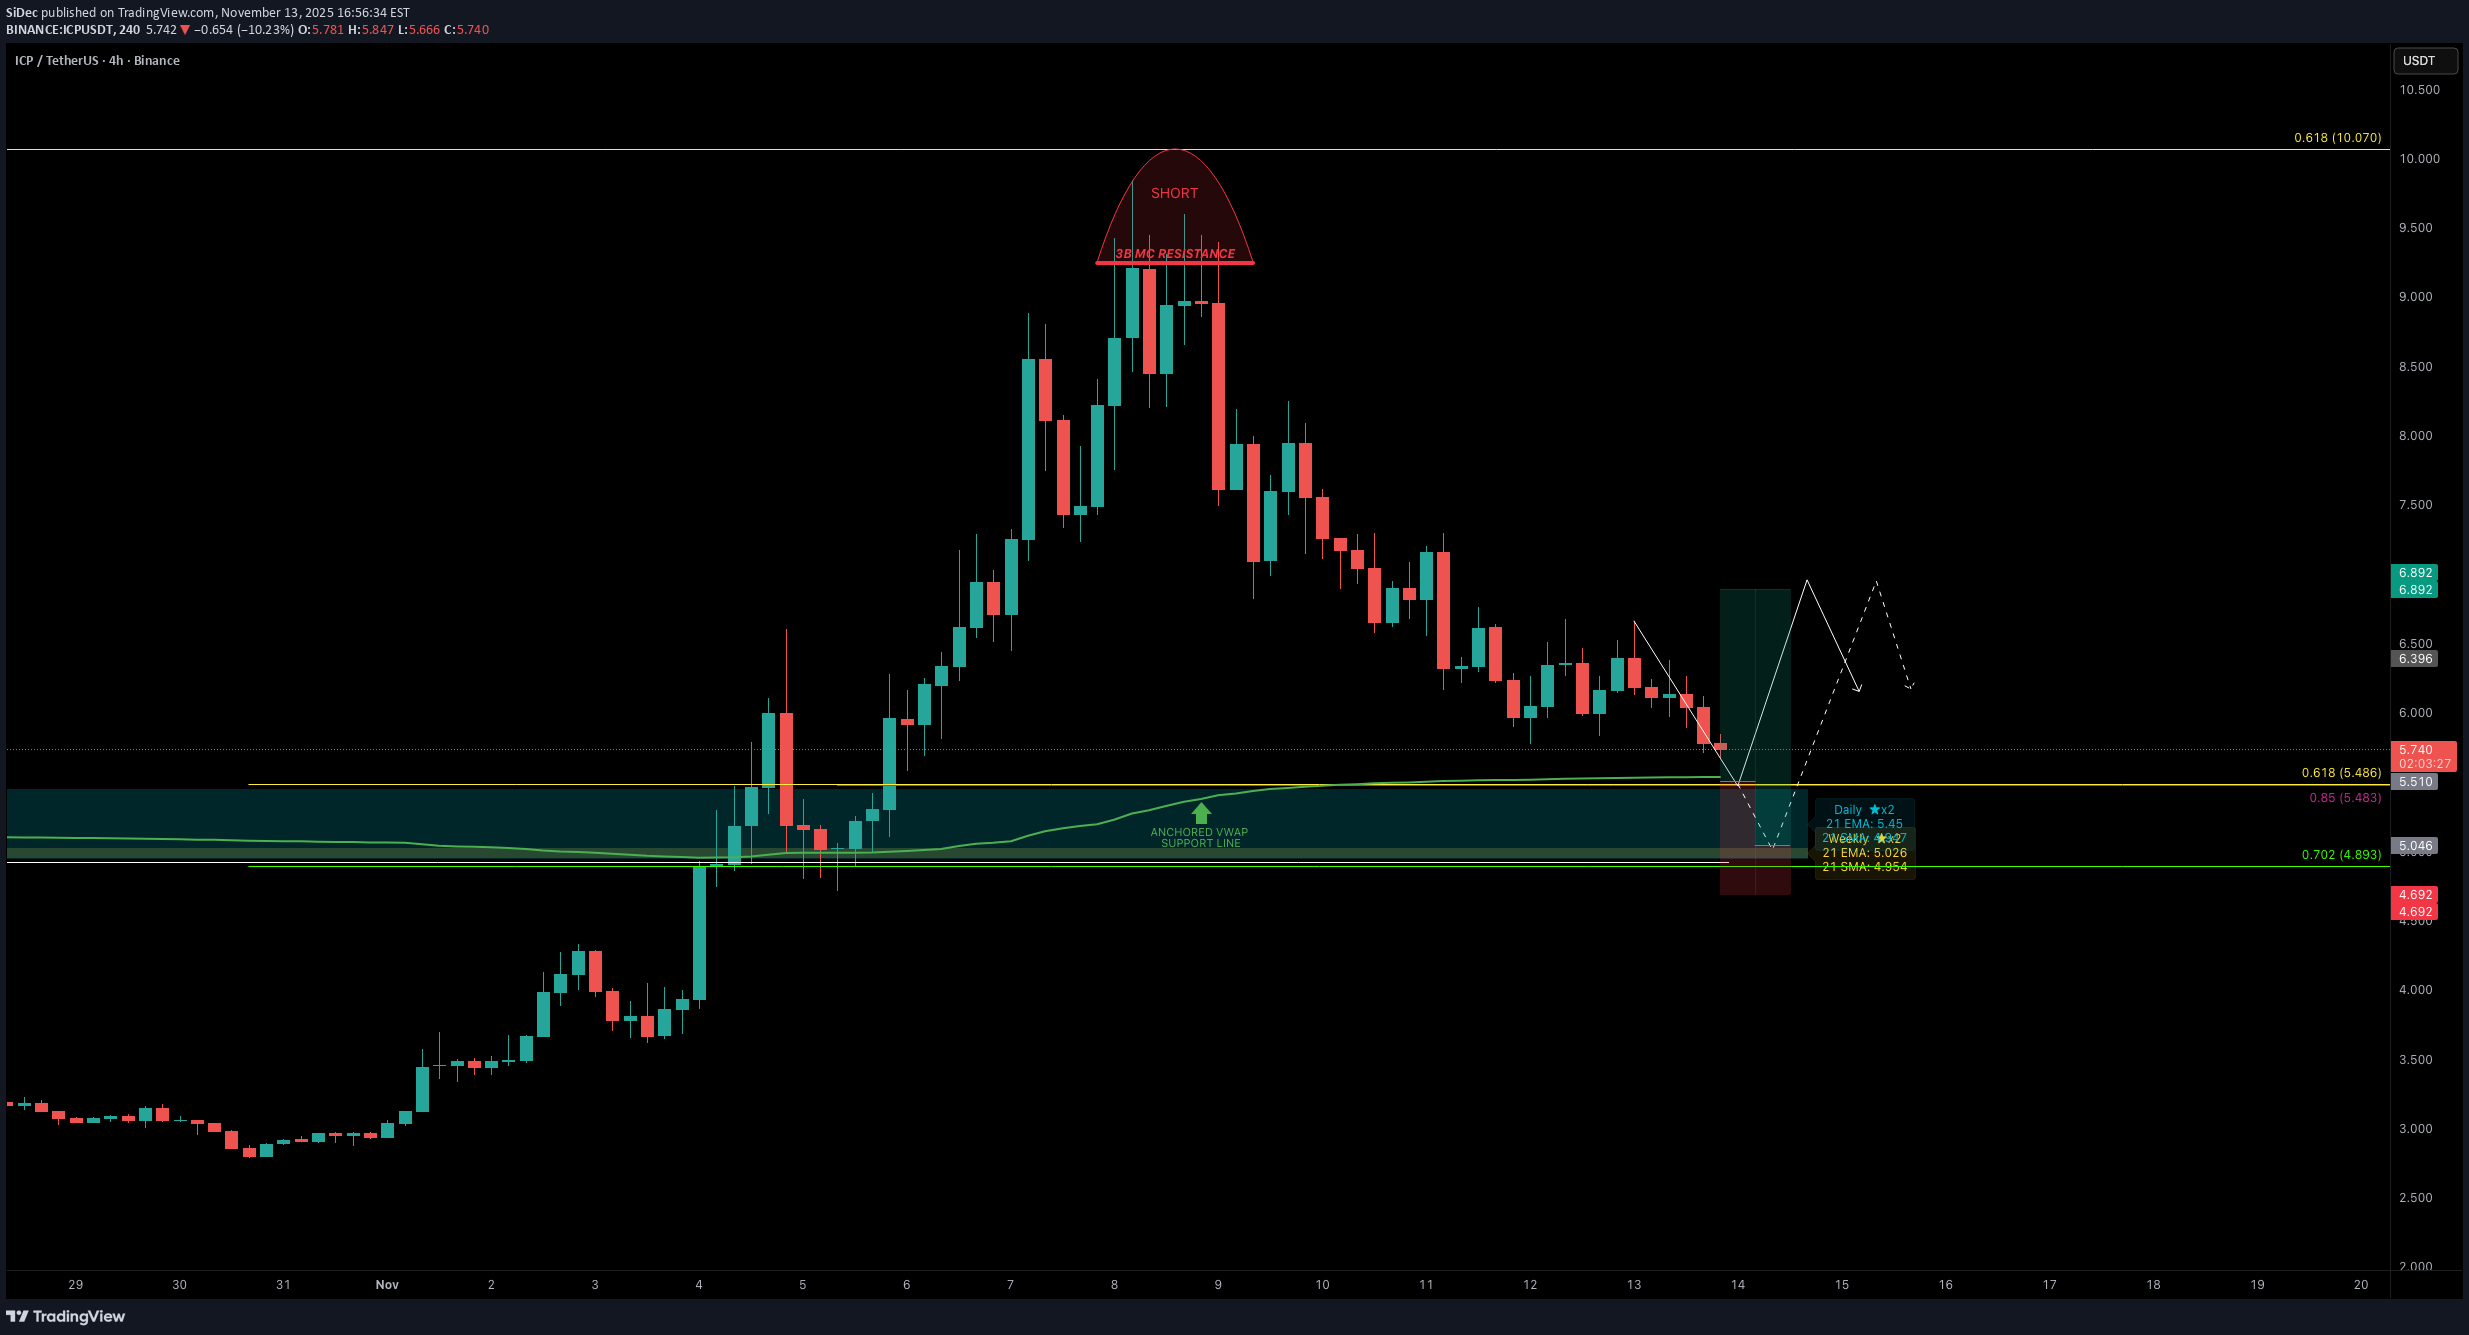
ICP had a great start to November, rallying over +250% in just 8 days before topping out just below the 0.618 Fibonacci retracement (~$10), right at the $3B MC resistance. Over the past 5 days, ICP has retraced -42% from the high. The key question now: where is the next high-probability long opportunity? Key Confluences around the $5.5 Zone One level that stands out strongly is the $5.5 zone, where several major supports align: 0.618 Fib retracement of the entire +250% rally 0.85 Fib retracement of the smaller internal wave aligns right with the major 0.618 level Anchored VWAP (280 day) clustering right around $5.5, adding volume-weighted support Quarterly VWAP currently sits near $5.62 Daily 21 EMA at $5.45 Weekly 21 EMA/SMA both at around $5 $5.5 = $3B market cap Point of Control (POC) of the past ~280 days sits around $4.9, marking it as the final major support layer below 🟢 Trade Setup Plan Entry Zone: $5.6 – $5.0 Stop-Loss: Below POC Targets: TP1: $6.0 TP2: $6.9 (VWAP resistance / 0.382 Fib) TP3: 0.618 FR Risk/Reward: 1:2+, depending on entry precision 🔍 Indicators used Multi Timeframe 8x MA Support Resistance Zones [SiDec] → to identify support and resistance zones such as the daily/weekly 21 EMA/SMA. ➡️ Available for free. You can find it on my profile under “Scripts” and apply it directly to your charts for extra confluence when planning your trades. _________________________________ 💬 If you found this helpful, drop a like and comment!
SiDec
آیا بازار صعودی بیت کوین تمام شد؟ تحلیل تکنیکال جدید و سطوح کلیدی BTC
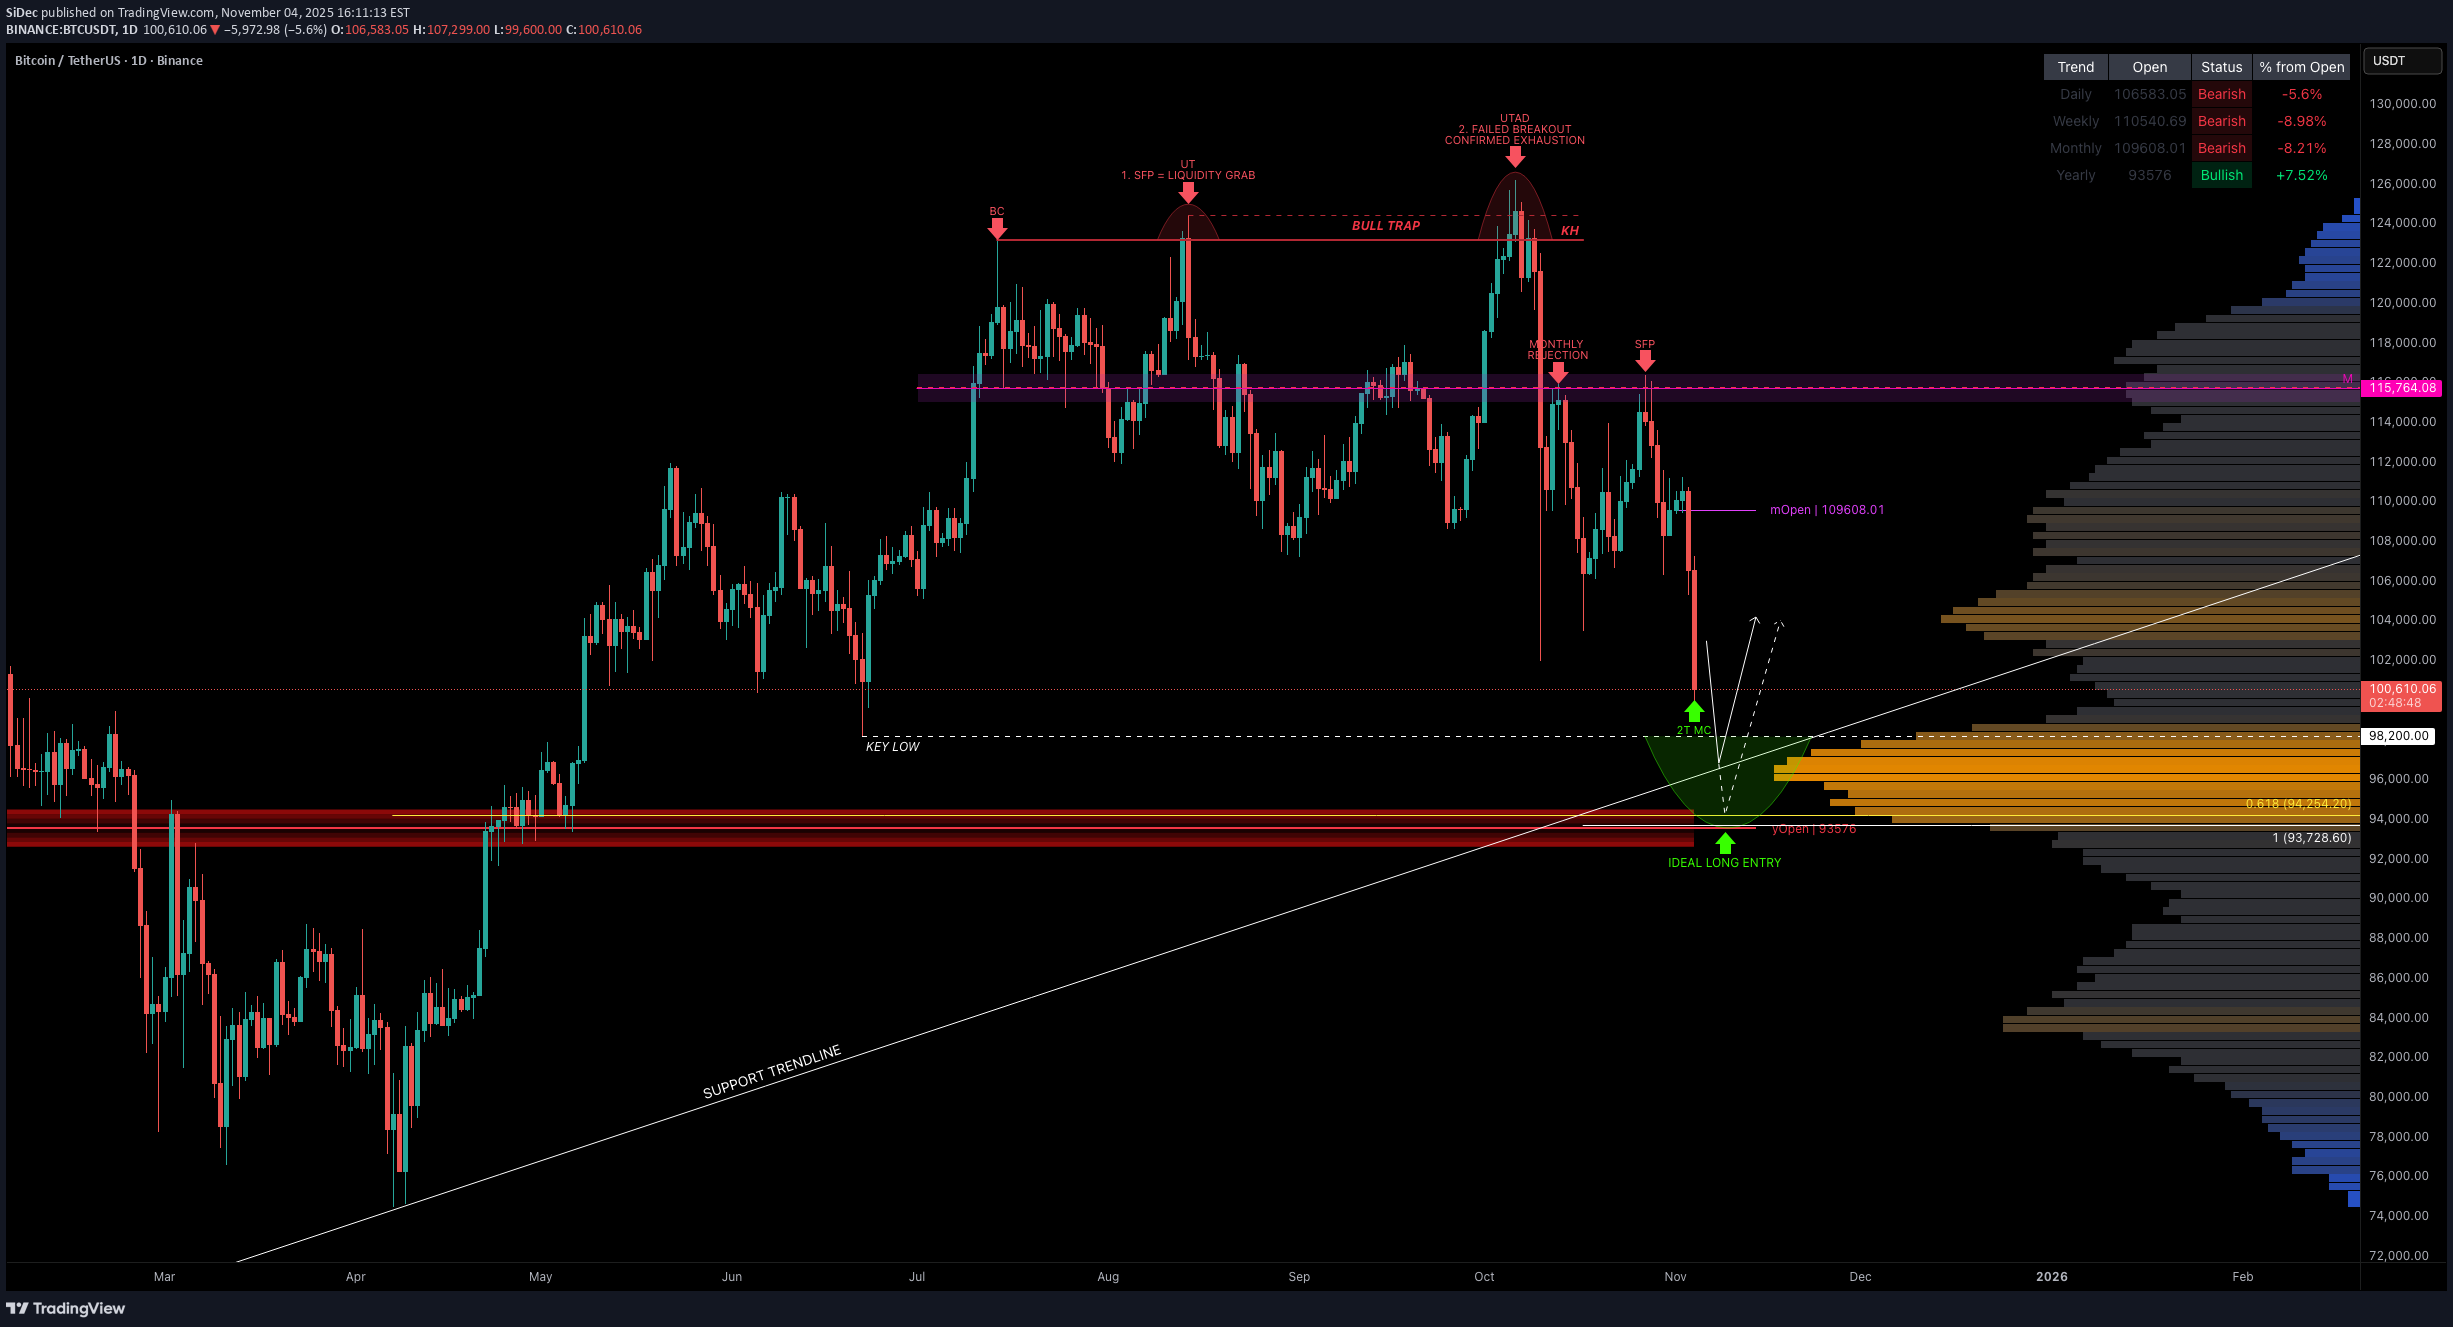
First of all, I’ve been quite busy the past few weeks working on some exciting projects and developing new indicators that’s why I haven’t posted much here lately. But now I’m back with a fresh Bitcoin analysis, and there’s a lot to unpack. Macro Context BTC’s recent structure has played out exactly like a classic Wyckoff Distribution schematic. Back in mid-July (14th July 2025), we printed a Buying Climax (BC), followed by an Upthrust (UT) → SFP / liquidity grab. Later, price formed a UTAD (Upthrust After Distribution) → the final failed breakout, confirming buyer exhaustion and triggering the sharp sell-off event that followed. After that sell-off, BTC retested the monthly resistance level at $115,764 twice: The first attempt resulted in a clean rejection. The second led to SFP of the high, confirming a bull trap and setting the tone for further downside. The monthly resistance turned out to be the most ideal short entry, offering a near-perfect risk-to-reward setup after the clear rejection. The charts really tell the whole story, BTC has followed the technical structure perfectly. Current Structure & Key Levels Today, we tapped the $100K psychological level, aligning with the $2 trillion market cap, that produced an initial bounce. The question now: is this the start of a meaningful bounce, or just a relief rally before further downside? Looking at the wave structure, we are most likely in a Wave 3 (iii) → meaning more downside pressure remains probable. BTCUSD (INDEX): Key Low: $98,200 — Sell-Side Liquidity 0.618 Fib retracement: ~$94,254 — ideal long entry zone Trend-based Fib Extension (1.0): ~$93,728 Yearly Open: $93,576 The Volume Profile shows a high-volume node between $98K–$94K, with the POC at $96.4K, perfectly aligning with the support trendline and key low. This gives us a high-probability long zone between $98.2K and $93.5K, an area where multiple technical factors align: Key low liquidity Fib confluence (0.618 FR & 1.0 TBFE) Yearly open Volume cluster (POC) Rising trendline support Pattern Confluence After the rejection at the monthly resistance ($115,764), a clear Head & Shoulders pattern also formed → another strong bearish confluence. The neckline was broken cleanly, confirming the expectation for further downside, which is now playing out. Psychological & Technical Zones At the moment, $100K remains a psychological key support and the market is reacting accordingly. Now it’s time to pay close attention as we approach critical levels, especially the long opportunity zone (98.2K–93.5K). 🟢 Ideal trade plan: Long Entry Zone: $98.2K → $93.5K Take Profit 1: $100K Take Profit 2: $104K Stop Loss: below the Yearly Open ($93.5K) Summary Structure: Wyckoff Distribution → Markdown Phase Pattern: Head & Shoulders confirmed Bias: Bearish, but approaching high-value long zone Watch for: SFP of $98.2K → potential reversal trigger Main invalidation: Below Yearly Open ($93.5K) BTC continues to respect the technicals beautifully. Stay patient! The next high-probability long setup is forming right in front of us. 🔍 Indicators used DriftLine — Pivot Open Zones [SiDec] → For identifying key yearly/monthly/weekly/daily opens that act as major S/R reference points LuxAlgo — Liquidity Sentiment Profile (Auto-Anchored) ➡️ Available for free. You can find it on my profile under “Scripts” and apply it directly to your charts for extra confluence when planning your trades. _________________________________ 💬 If you found this helpful, drop a like and comment!
SiDec
سولانا (SOL): از وحشت بازار تا سطحبندی دقیق قیمت!

Last week, we witnessed a sharp, market-wide crash, a chain reaction of liquidations that flushed out overleveraged long positions. While many altcoins saw 60–90% drawdowns, the majors held relatively firm. Among them, SOL stood out as one of the most technically precise. Price perfectly tapped the 1.1 trend-based Fib extension, in confluence with the yearly level, the 21 monthly SMA and the 0.666 retracement, providing a high probability long setup. After that bounce, SOL revisited the lows, approaching the yearly level near $170, which remains the key structural support for maintaining bullish momentum. The support zone between $175–$170 aligns with the 21 EMA/SMA on the monthly timeframe, which currently spans $158–$170 → forming a strong macro confluence cluster that’s critical to hold. From there, price unfolded into a clean 5-wave impulsive structure, topping within a dense resistance zone between $208–$212, reinforced by: mOpen at $208.68 21 EMA/SMA (Daily TF) between $211–$212 0.618 Fibonacci retracement at $211.43 This area offered the perfect low-risk short entry. Currently, SOL appears to be forming an ABC corrective pattern, likely targeting a move back into the $190–$185 range to fill imbalances and complete wave C. As another key element, the yearly open at $189.31 sits mid-range between resistance and support → a critical pivot level. That’s the region I’ll be monitoring for long setups. 🔍 Indicators used DriftLine — Pivot Open Zones [SiDec] → For identifying key yearly/monthly/weekly/daily opens that act as major S/R reference points Multi Timeframe 8x MA Support Resistance Zones [SiDec] → to identify support and resistance zones such as the monthly 21 EMA/SMA. ➡️ Available for free. You can find it on my profile under “Scripts” and apply it directly to your charts for extra confluence when planning your trades. _________________________________ 💬 If you found this helpful, drop a like and comment!Bearish trend is still intact, $210 is the key level to watch:
Disclaimer
Any content and materials included in Sahmeto's website and official communication channels are a compilation of personal opinions and analyses and are not binding. They do not constitute any recommendation for buying, selling, entering or exiting the stock market and cryptocurrency market. Also, all news and analyses included in the website and channels are merely republished information from official and unofficial domestic and foreign sources, and it is obvious that users of the said content are responsible for following up and ensuring the authenticity and accuracy of the materials. Therefore, while disclaiming responsibility, it is declared that the responsibility for any decision-making, action, and potential profit and loss in the capital market and cryptocurrency market lies with the trader.