
DOG
Dog (Bitcoin)
| تریدر | نوع سیگنال | حد سود/ضرر | زمان انتشار | مشاهده پیام |
|---|---|---|---|---|
FxProRank: 1723 | خرید | حد سود: تعیین نشده حد ضرر: تعیین نشده | 12/8/2025 |
Price Chart of Dog (Bitcoin)
سود 3 Months :
سیگنالهای Dog (Bitcoin)
Filter
Sort messages by
Trader Type
Time Frame
FxPro
Dogecoin Wave Analysis – 15 December 2025
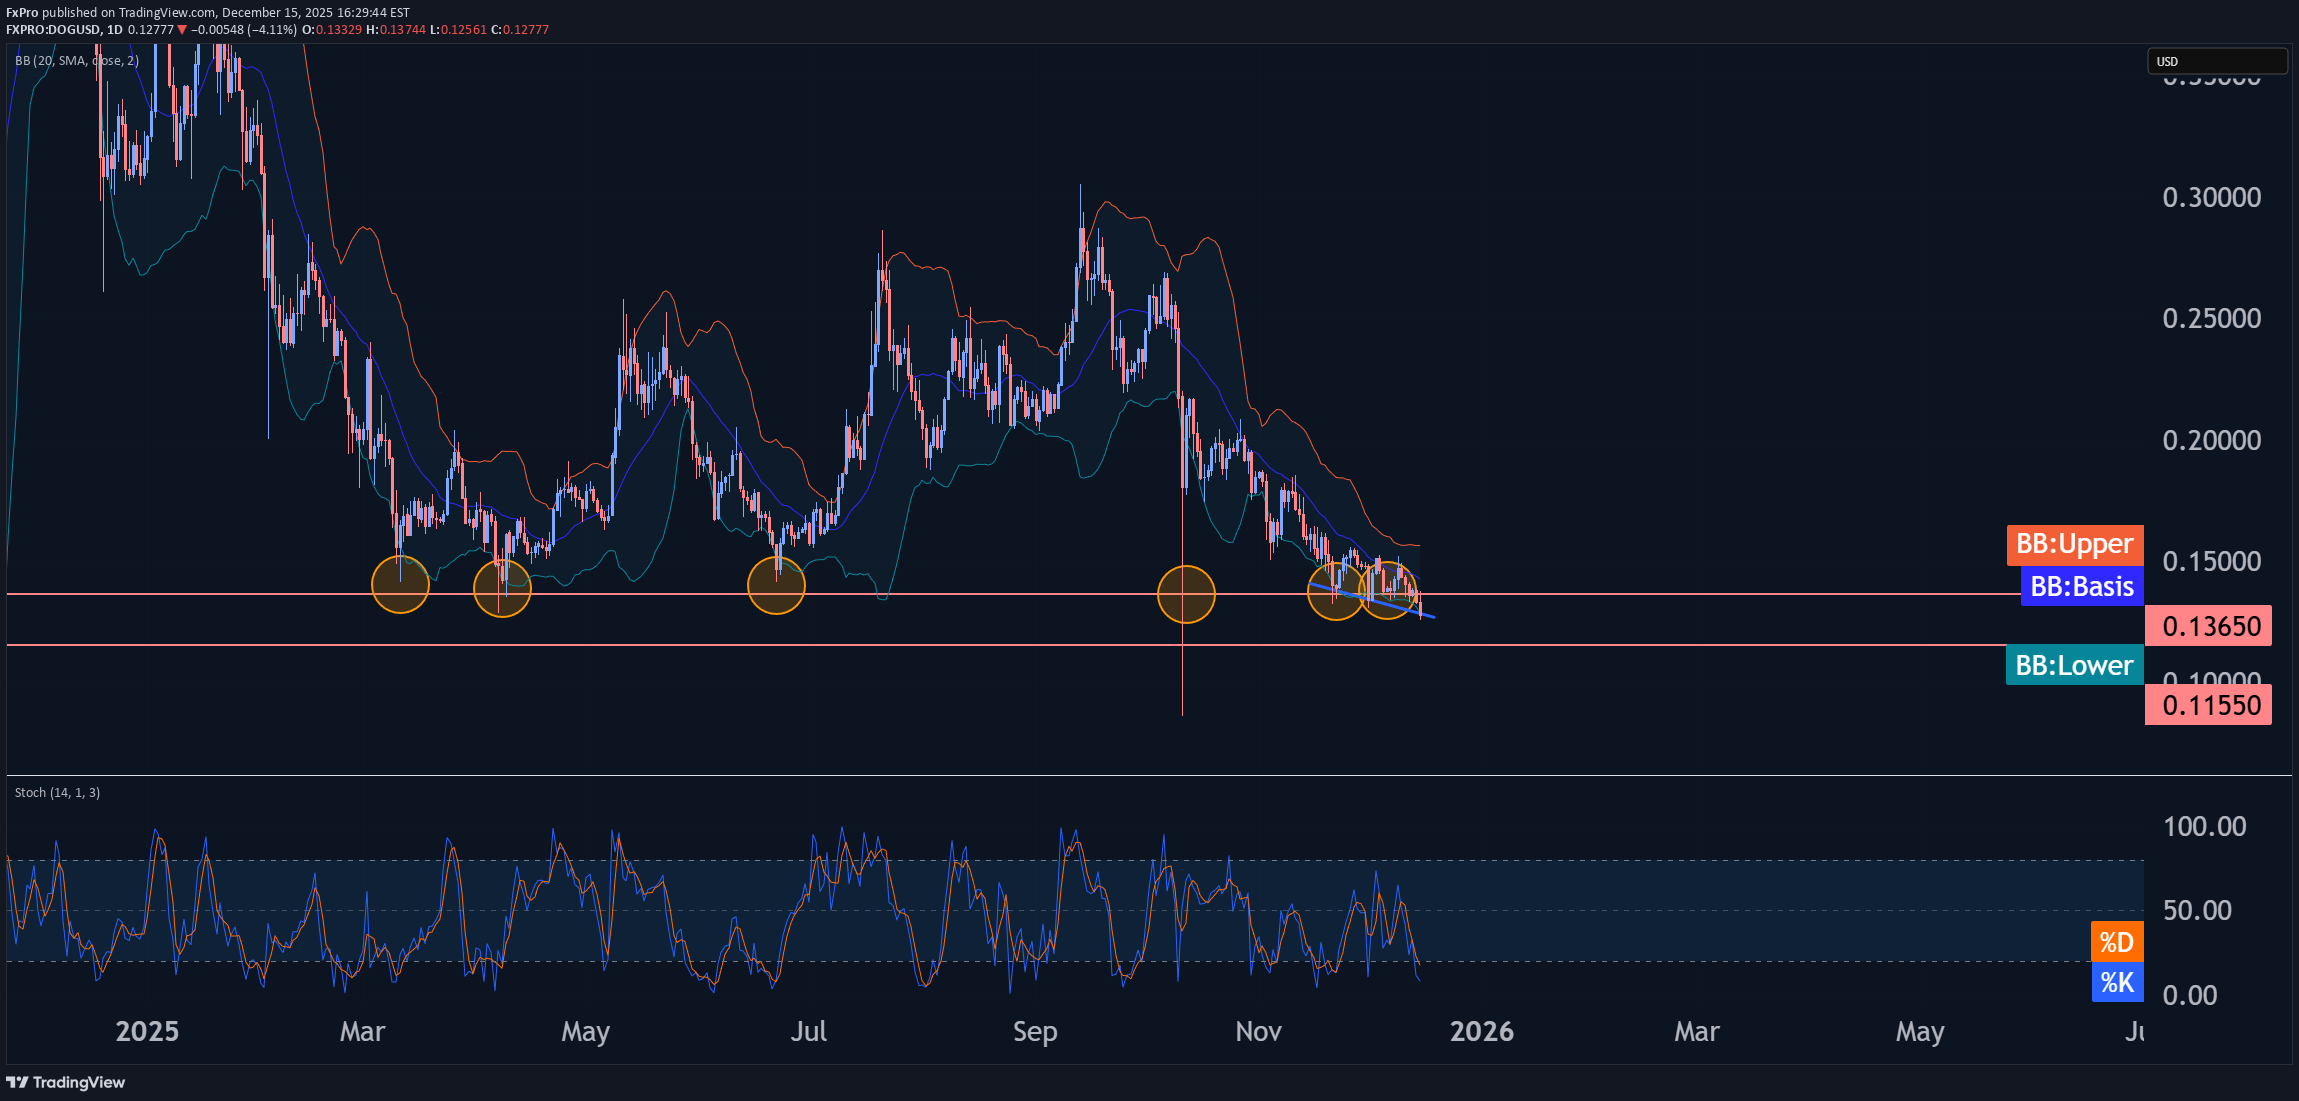
- Dogecoin broke long-term support level 0.1365 - Likely to fall to support level 0.1155 Dogecoin cryptocurrency recently broke below the long-term support level 0.1365 (which has been reversing the price from April, as can be seen below). The breakout of the support level 0.1365 strengthened the bearish pressure on Dogecoin. Given the clear daily downtrend and the bearish sentiment seen across the crypto markets, Dogecoin cryptocurrency can be expected to fall to the next support level 0.1155.
FxPro
تحلیل موجی دوجکوین: فرصت صعود به مقاومت ۰.۱۶۰۰ پس از بازگشت قدرتمند!
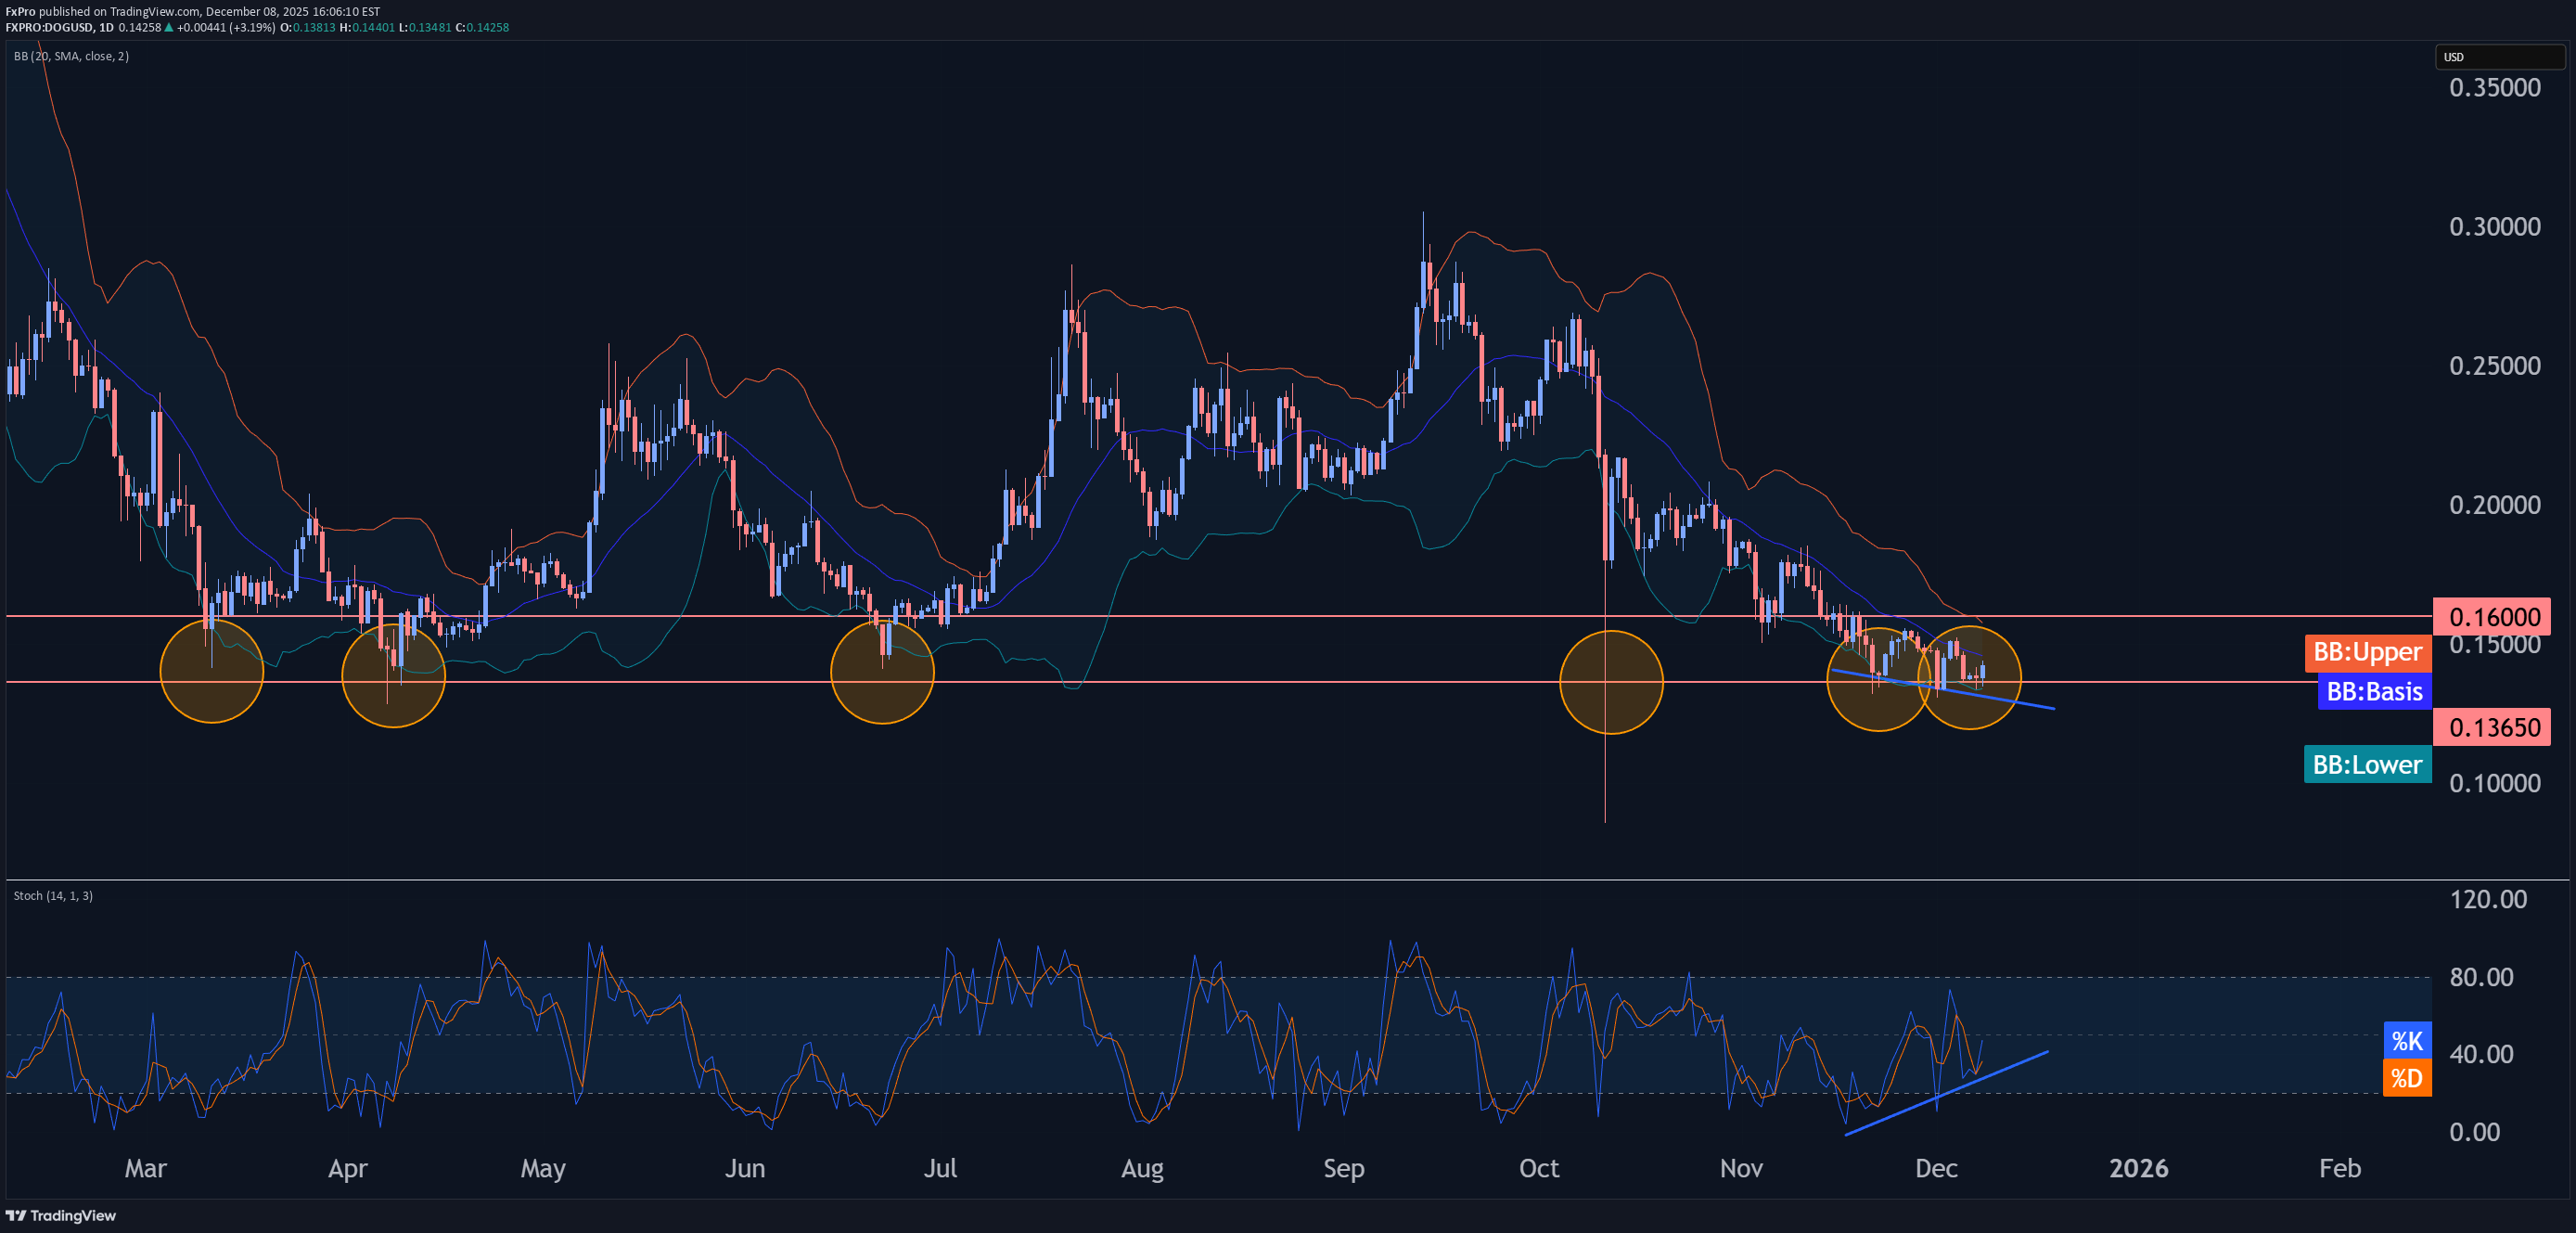
- Dogecoin reversed from support zone - Likely to rise to resistance level 158.00 Dogecoin cryptocurrency recently reversed up from the strong support zone between the multi-month support level 0.1365 (which has been reversing the price from March) and the lower daily Bollinger Band. The upward reversal from this support zone continues the active minor impulse wave 3 which started from the same support area at the end of November. Given the strength of the support level 0.1365 and the bullish divergence on the daily Stochastic indicator, Dogecoin currency pair can be expected to rise to the next resistance level 0.1600.
FxPro
تحلیل موج دوجکوین: آیا مسیر صعود به ۰.۱۷۵۰ هموار شد؟ (۲ دسامبر ۲۰۲۵)
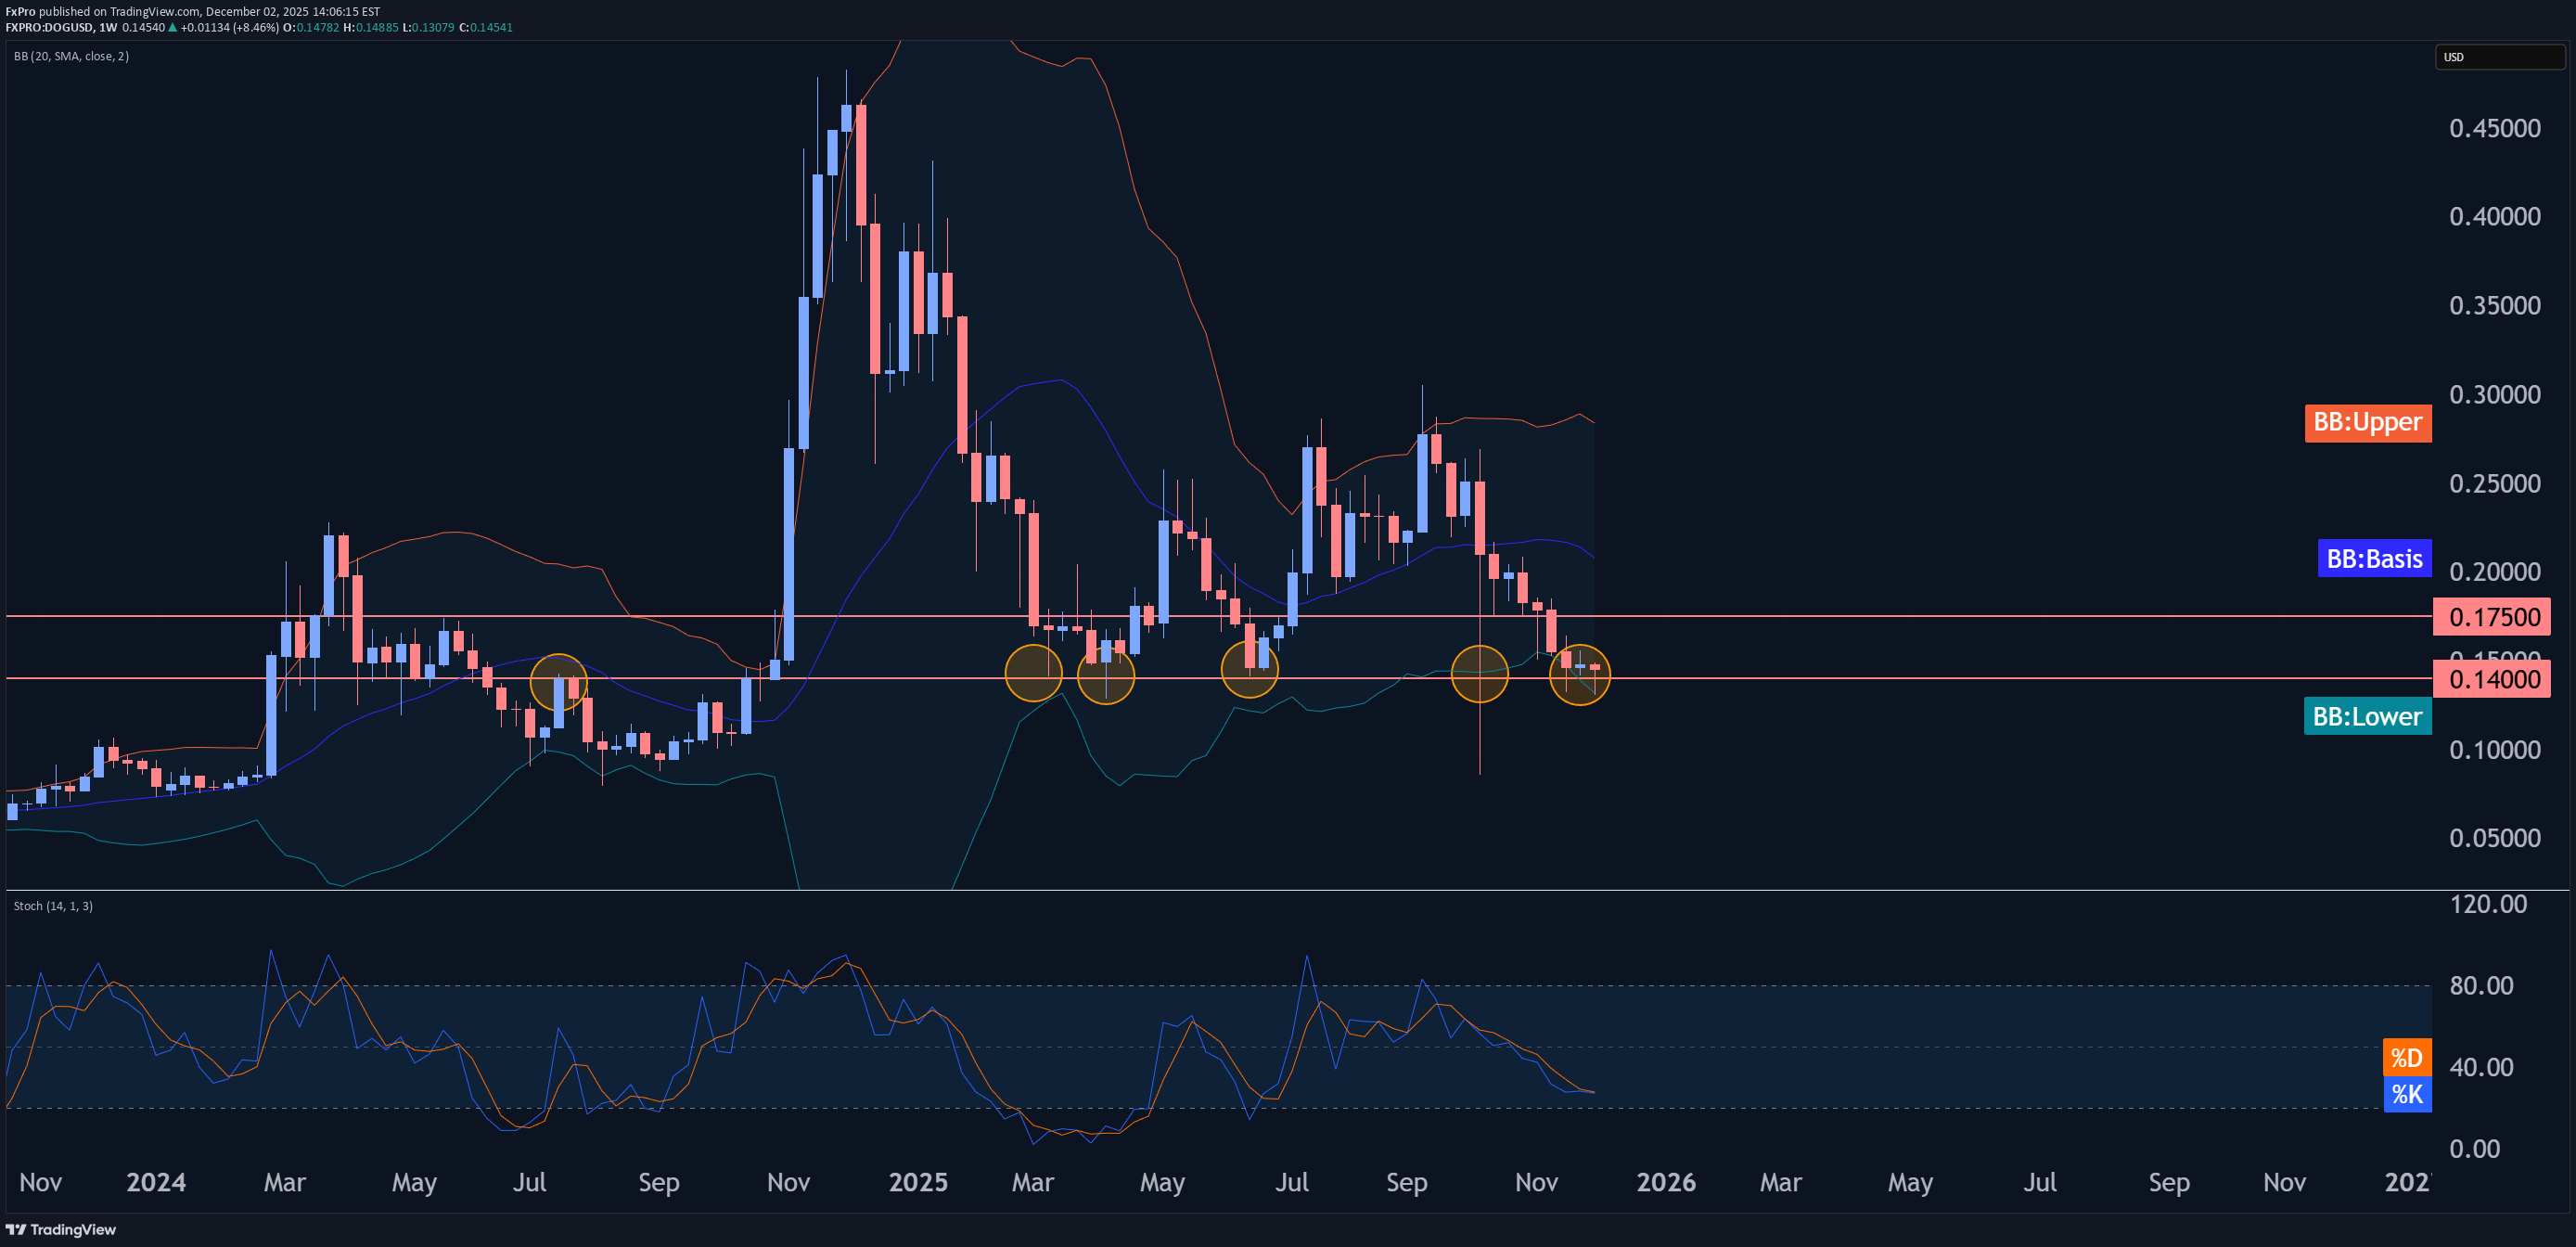
- Dogecoin reversed from support zone - Likely to rise to resistance level 0.1750 Dogecoin cryptocurrency recently reversed from the support zone between the long-term support level 0.1400 (which stopped all downward waves from the start of 2025) and the lower weekly Bollinger Band October. The upward reversal from this support zone continues the active weekly impulse wave (3) from October. Given the strength of the support level 0.1400 and the improved sentiment seen across the crypto markets today, Dogecoin cryptocurrency can be expected to rise to the next resistance level 0.1750.
FxPro
تحلیل موجی دوجکوین: آیا قیمت به مقاومت ۰.۲۰۰۰ میرسد؟ (تحلیل ۱۸ نوامبر ۲۰۲۵)
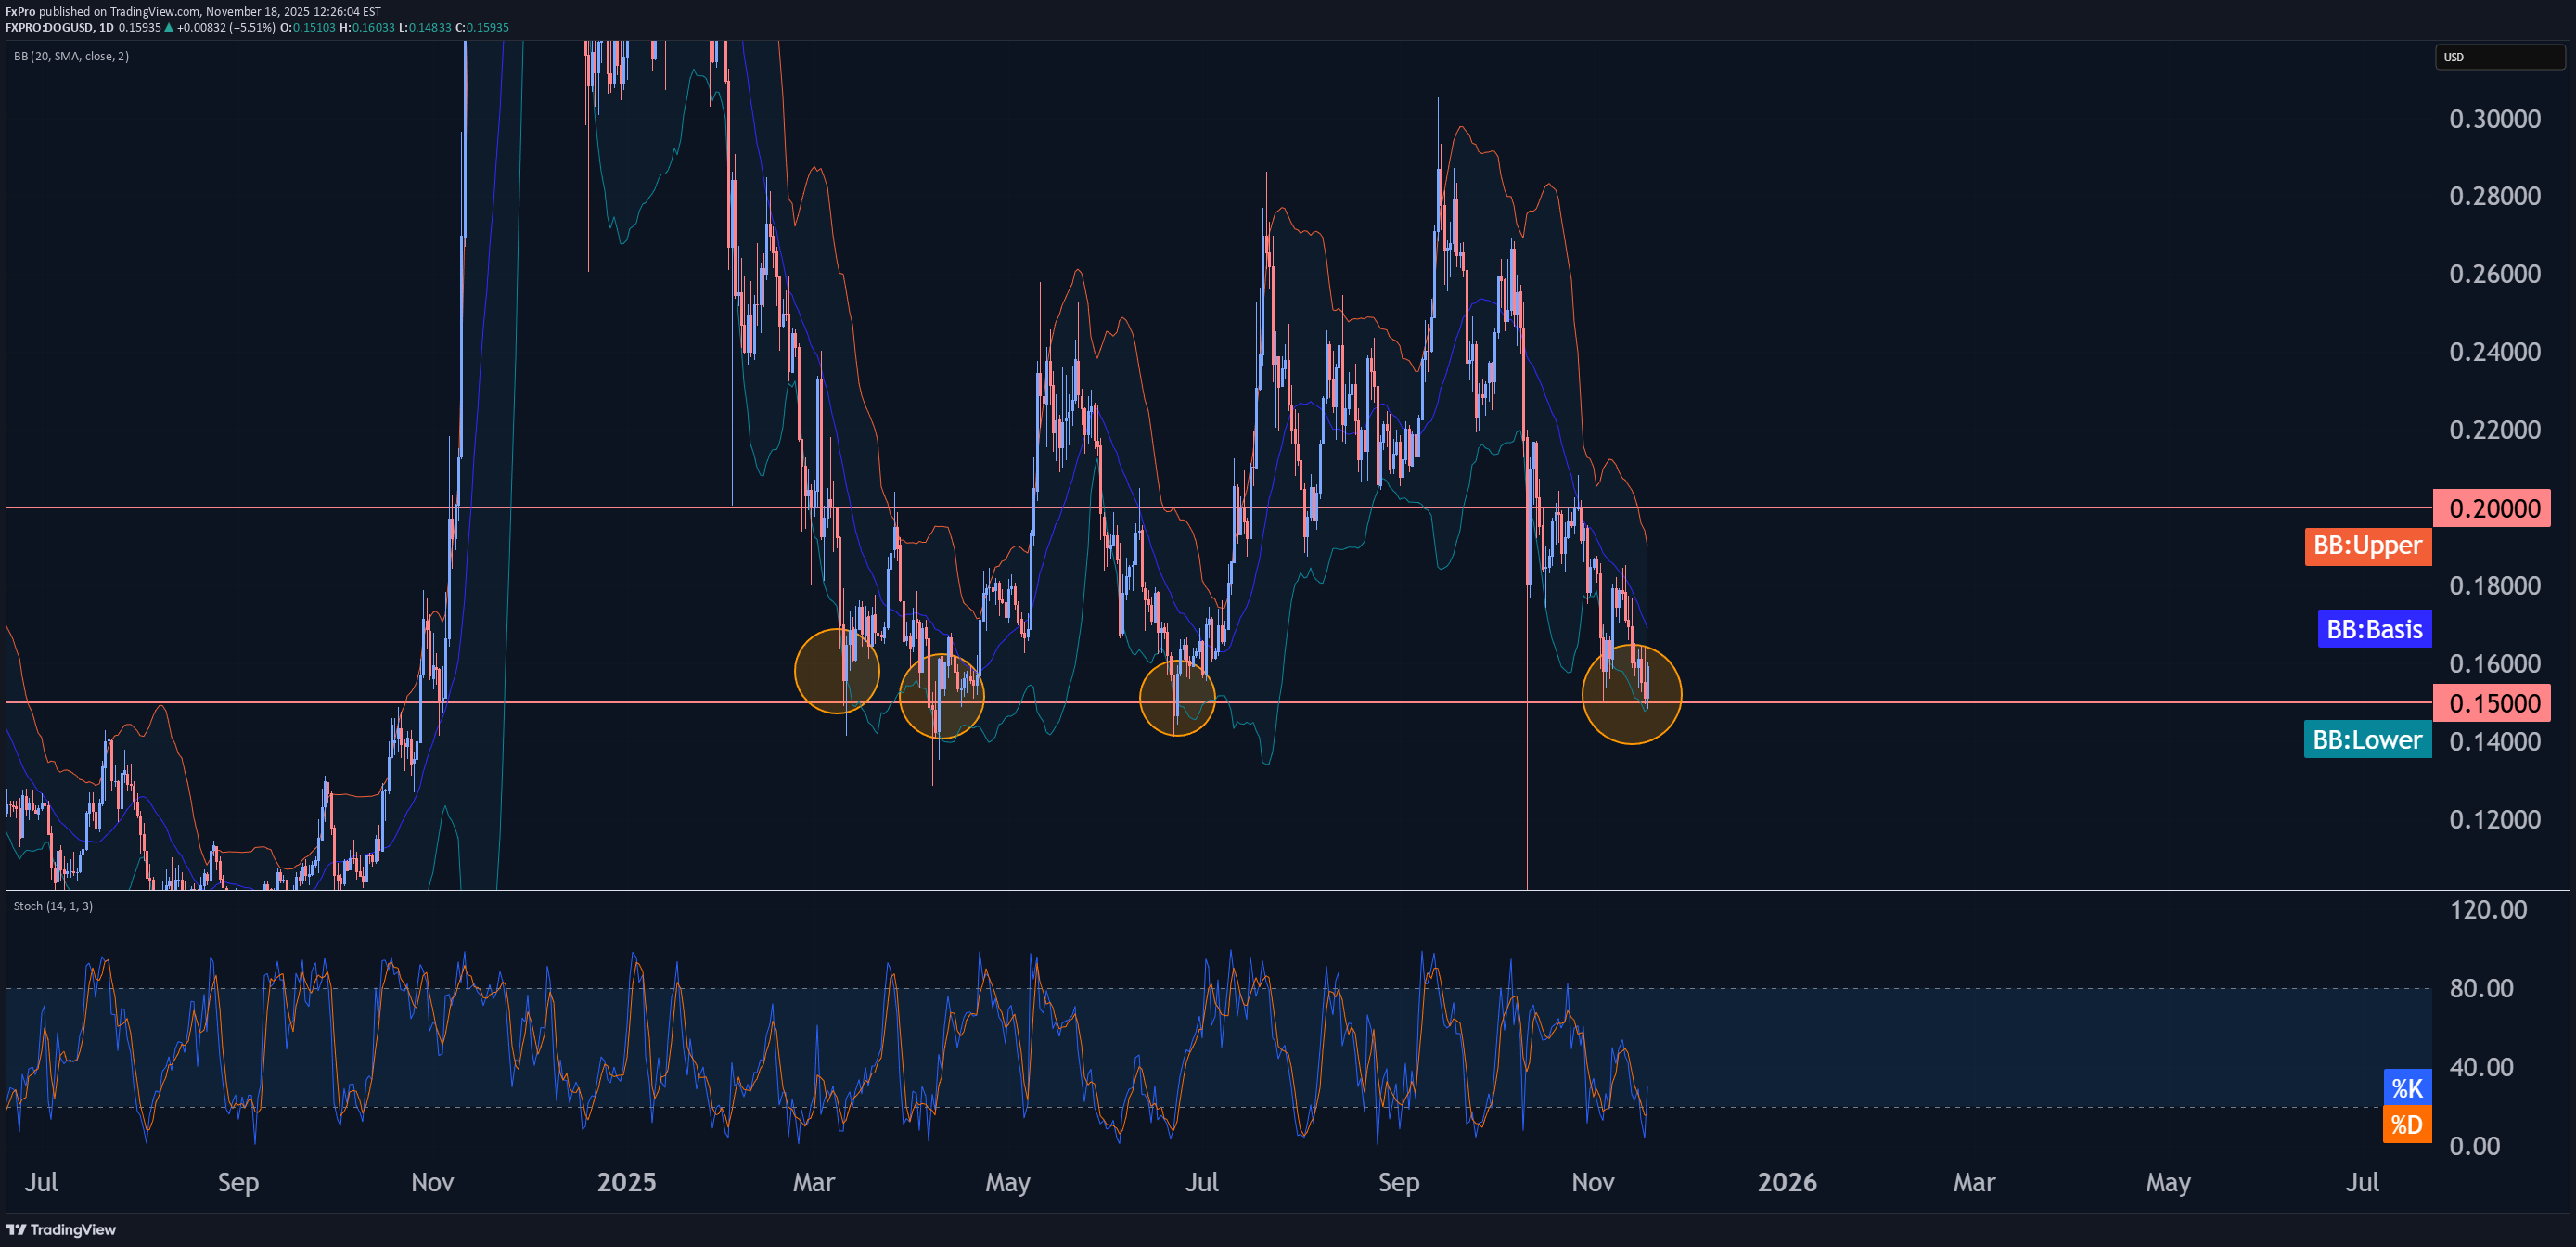
- Dogecoin reversed from strong support level 0.1500 - Likely to rise to resistance level 0.2000 Dogecoin cryptocurrency recently reversed from strong support level 0.1500 (which has been steadily reversing the price from the start of 2025, as can be seen from the weekly Dogecoin chart below). The upward reversal from this support level 0.1500, strengthened by the lower weekly Bollinger band, stopped the previous weekly correction from October . Given the strength of the support level 0.1500 and the improving sentiment across the crypto markets today, Dogecoin cryptocurrency can be expected to rise to the next round resistance level 0.2000.

EtherNasyonaL
الگوی کف دوقلو بیت کوین: آیا $DOG آماده جهش است؟
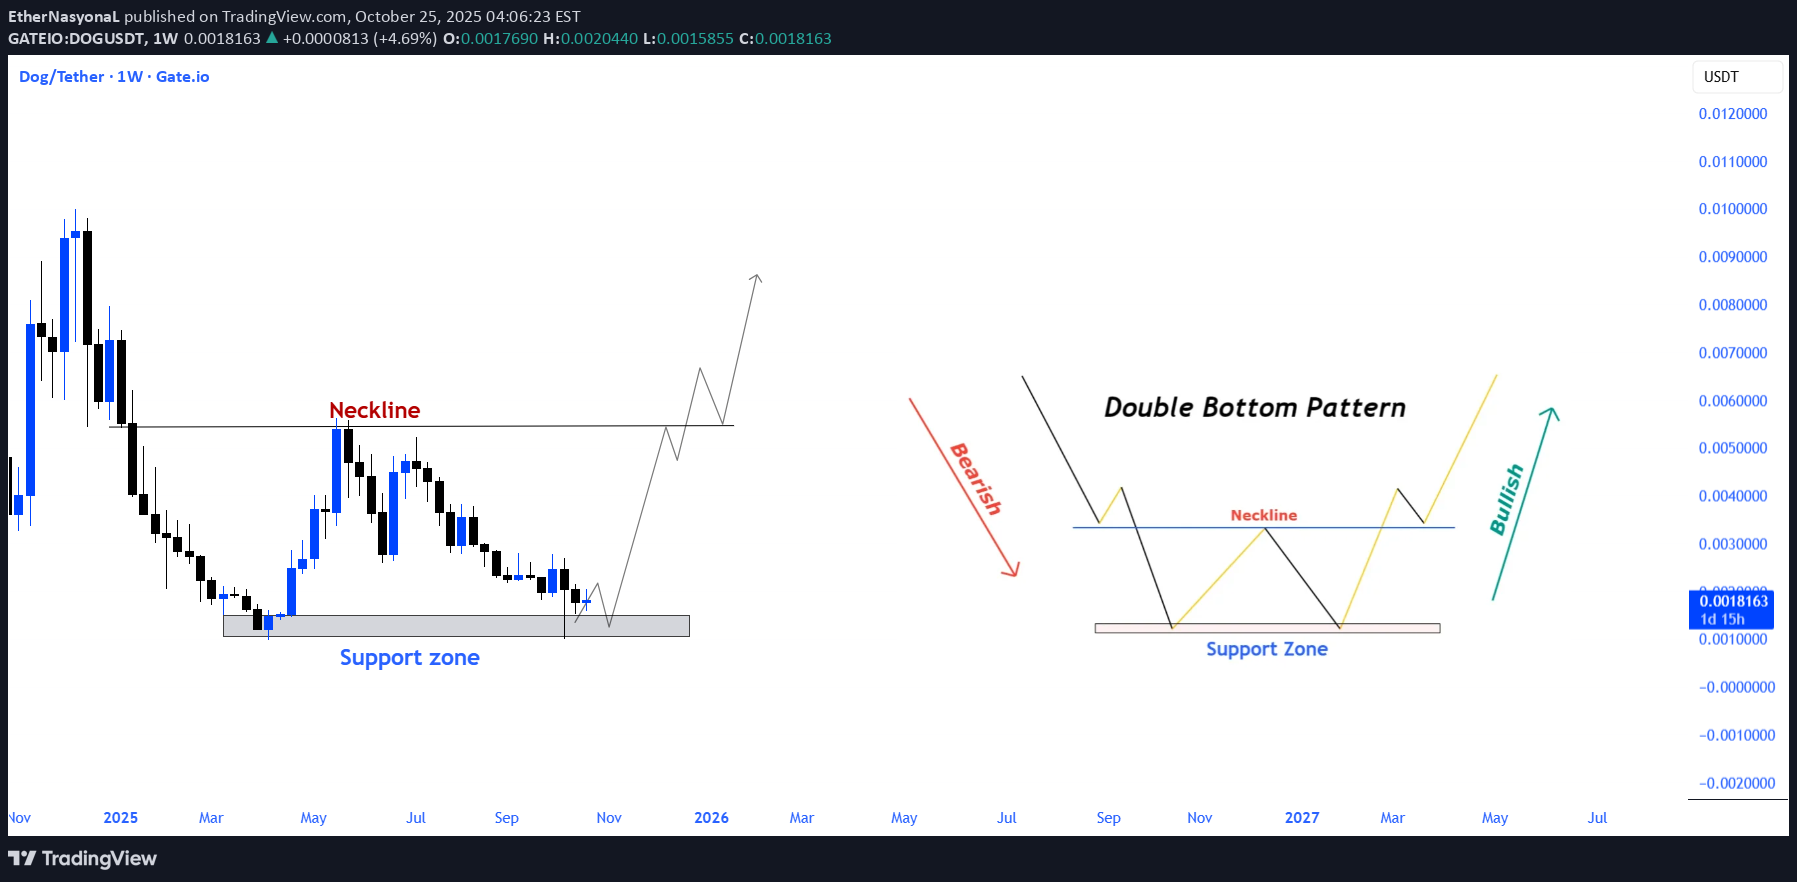
A distinct double bottom formation has formed on the chart following the recent decline. The price reacted strongly to the major support area, and the outlook now indicates upside potential. Roadmap: Breakout of the neckline. If it persists above this level, the trend direction should be reassessed.

ProfitMagnet-Pro
DOGE/USDT Forming Downward Channel – Possible Breakout Ahead?

DOGE/USDT has been trading inside a clear downward channel with consistent lower highs and lower lows, respecting the trendline for weeks. The price action shows repeated rejection from the upper resistance trendline, while also holding support around the lower boundary of the channel. Currently, we are approaching a critical support zone, where buyers may step in to defend. If momentum builds, we could see a bullish breakout from this downward channel, potentially confirming a trend reversal. A successful breakout above the trendline would open doors for an upward rally with strong recovery potential. 🔑 Key Highlights: Downward channel structure visible. Multiple touches on the trendline confirm strong resistance. Price nearing decision point (possible breakout or continuation). Watch for breakout confirmation with volume. 📌 This setup is one to watch closely – a breakout could bring strong bullish momentum, but failure to hold support may extend the bearish cycle.

Bear pennant trade setup for $DOG

DOG trade setup Bear pennant Entry at breakout (wait for retest most fakeouts fail here) Look for increased volume. Target $0.0017 (take partial profits on its way down) Price above $0.002 (flagpole) makes the trade invalid.
Your Shot at a Lifetime Opportunity Despite the Dip!

DOG remains in a downtrend, with the Death Cross still signaling bearish momentum. Social media activity around DOG is low, and investor sentiment is weak. The community is eager for concrete developments, such as a Tier-1 exchange listing, to boost confidence. This negative sentiment isn’t exclusive to DOG—the entire crypto market is struggling. Bitcoin, despite some optimism on X, failed to break $118K and is now declining. If you expect Bitcoin to reach $150K–$180K, it may first drop to $100K–$95K, pulling altcoins like DOG down further. If DOG falls below the key support level of 0.0018, it could slide to 0.001, creating a potential buying opportunity for spot purchases or long positions in futures. Target take-profit levels at 0.0025, 0.0035, and 0.0055. From there, evaluate whether DOG has the momentum to aim for a new all-time high. Rumors of a Coinbase listing are circulating, but tokens like SPX, with only $1M in volume on Coinbase, suggest limited impact. A Binance listing would drive significant volume, but DOG lacks the funds for it currently. There’s speculation that C2 Blockchain might cover these costs, but this is unconfirmed. With the broader market facing downward pressure, approach DOG cautiously. Entry: 0.0015 - 0.001 SL: 0.0005 - 0.00075 TP1: 0.0025 TP2: 0.0035 TP3: 0.0055

FxProGlobal
Dogecoin Wave Analysis – 15 September 2025
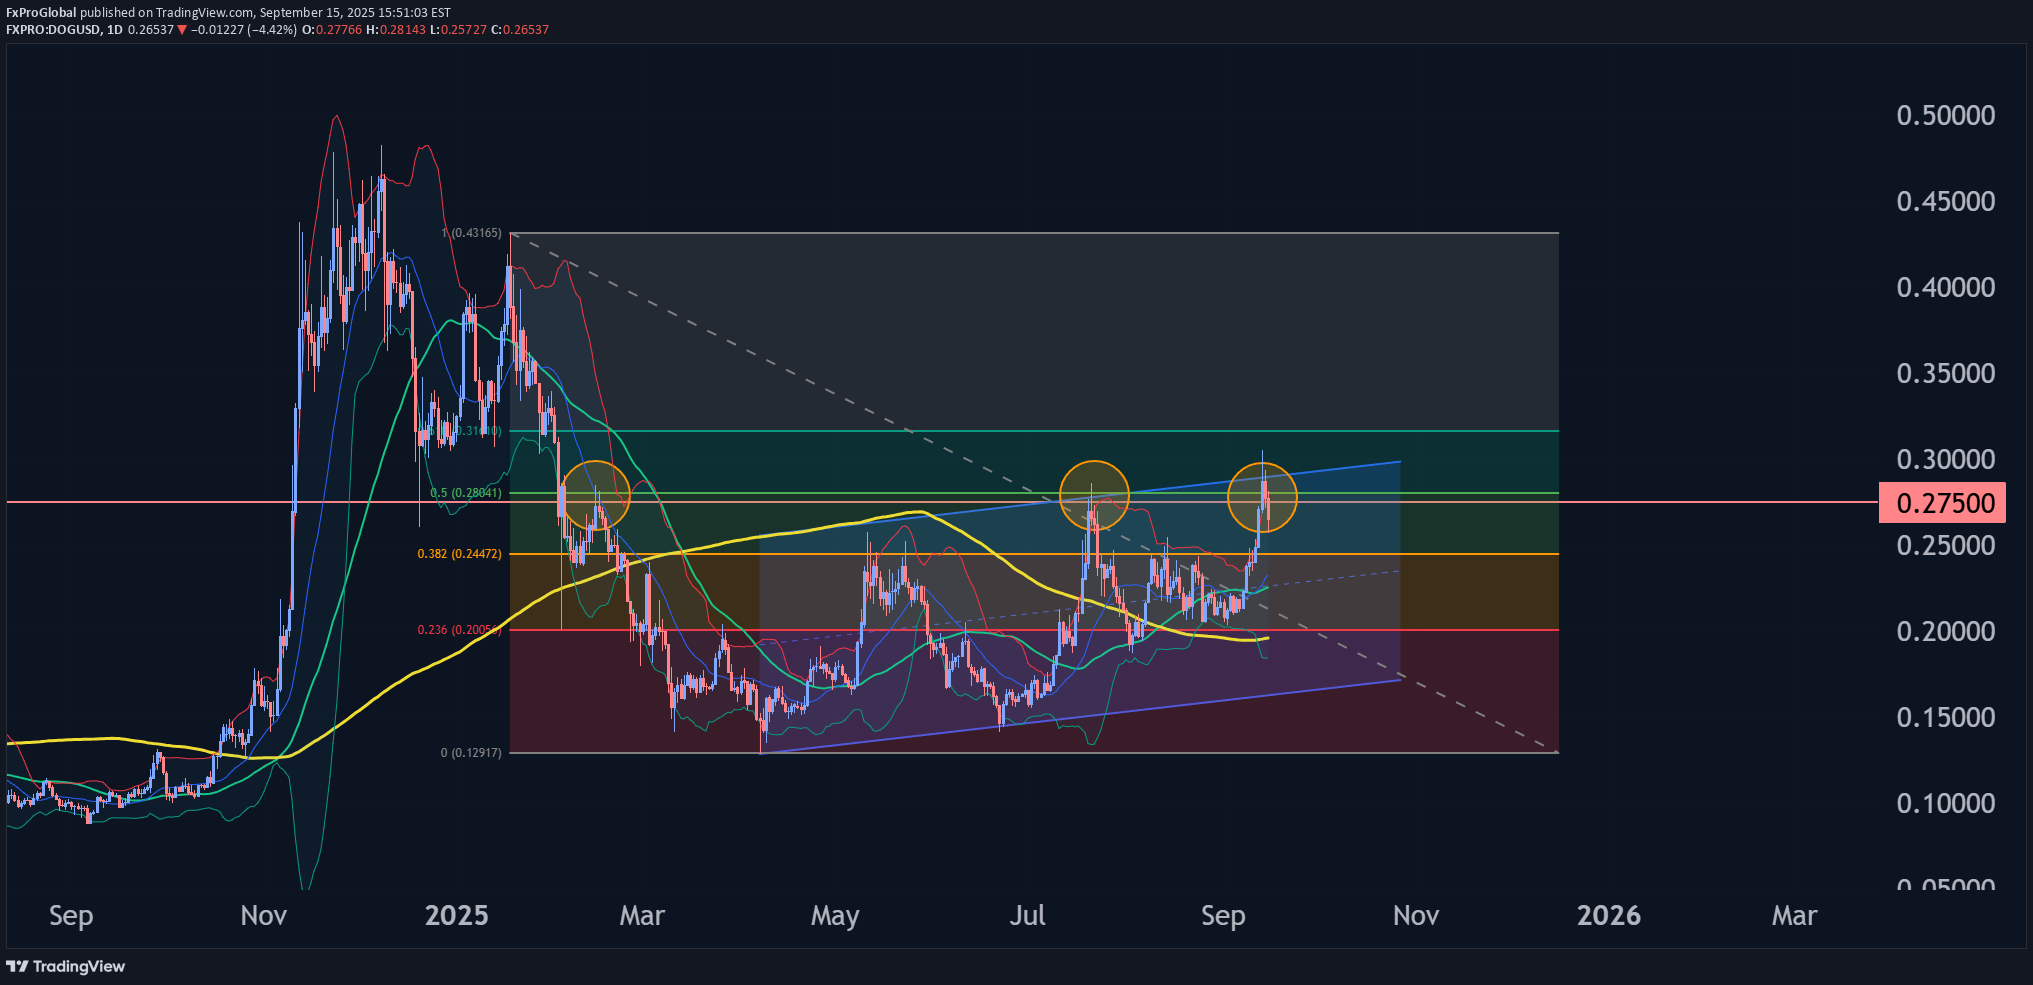
- Dogecoin reversed from the resistance area - Likely to fall to support level 0.2400 Dogecoin cryptocurrency recently reversed from the resistance area between the resistance levels 0.2750 (former monthly high from July), 0.3000 and the upper daily Bollinger Band. This resistance area was strengthened by the upper daily Bollinger Band and by the 61.8% Fibonacci correction of the previous sharp downward impulse from January. Given the predominantly bearish sentiment across the crypto markets today, Dogecoin cryptocurrency can be expected to fall to the next support level 0.2400.

TradeChartPatternsLikeThePros
GARTLEY
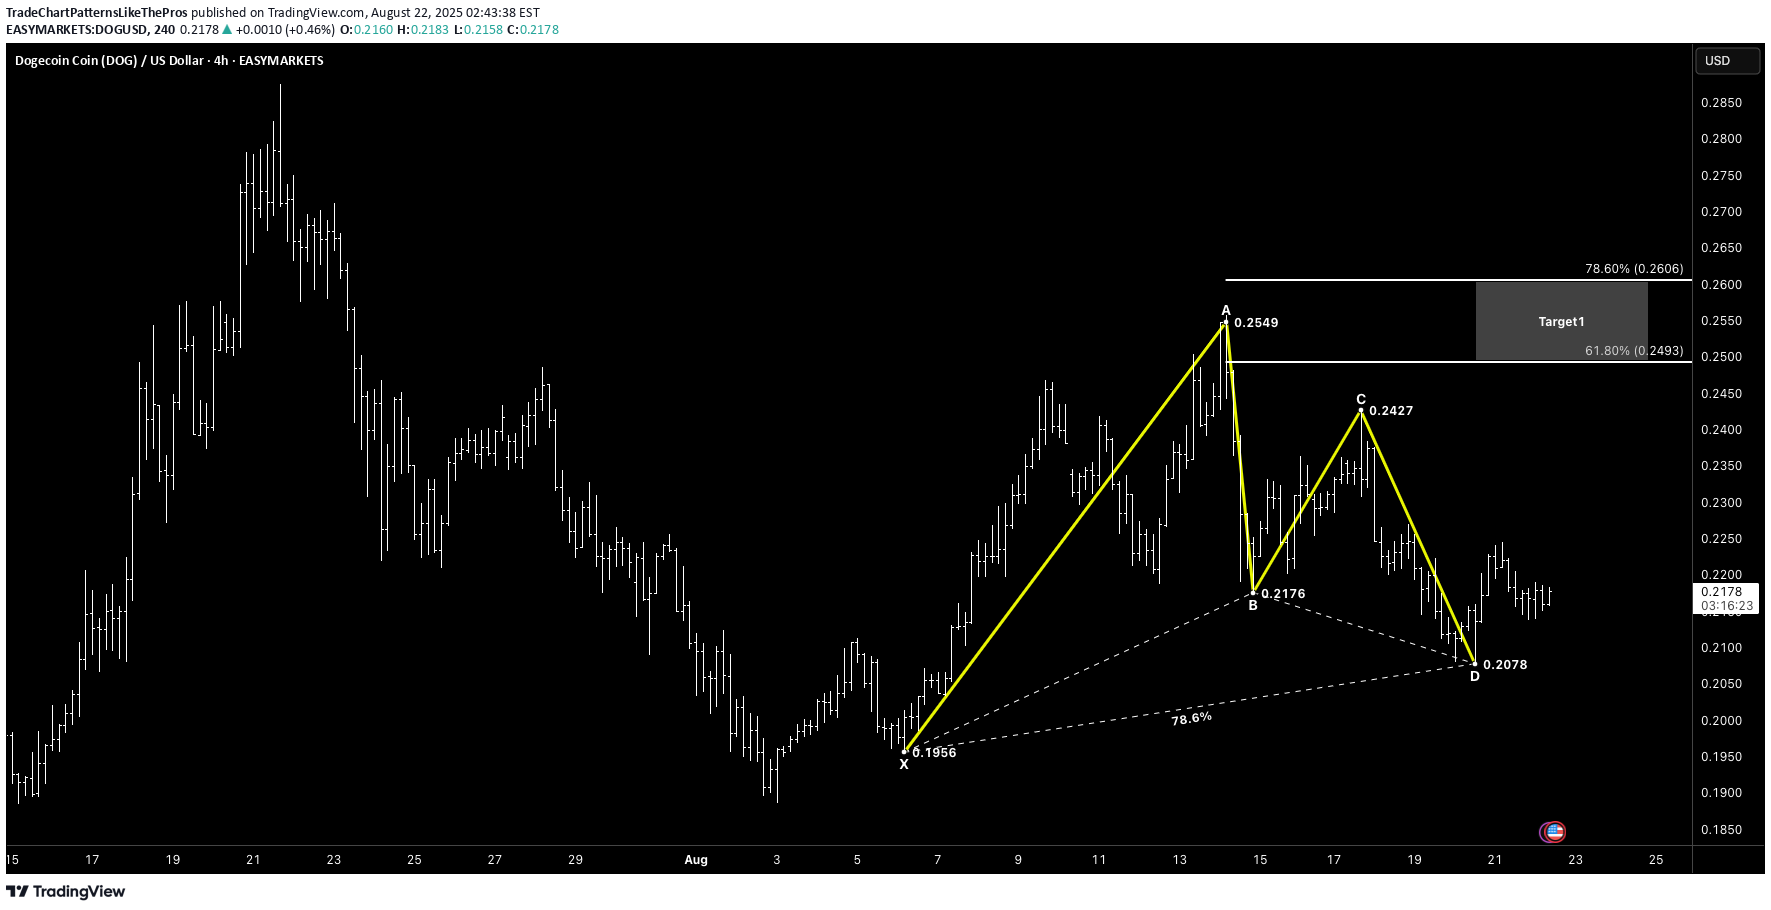
DOGE/USD (4H) – Bullish Gartley at D (Reversal → T1/T2) Quick summer check-in while I sneak some downtime: DOGE just printed a clean Gartley-style completion and buyers are reacting at D. 📌 Pattern Overview Pattern: Gartley (Bullish) Asset: Dogecoin / USD Timeframe: 4H Bias: Long from D/PRZ on confirmation and structure reclaim 🔑 Key Levels X: 0.1956 A: 0.2549 B: 0.2176 (shallow retrace of XA) C: 0.2427 D (PRZ): 0.2078 (confluence with XA fib + AB=CD symmetry) Target 1: 0.2493 – 0.2606 (≈ 61.8%–78.6% of AD) Target 2: 0.2933 – 0.3165 (≈ 127.2%–161.8% extension) 📐 Technical Confirmation BC retrace ≈ 67% of AB, CD ≈ 1.27–1.41 × BC into D. Confluence at 0.207–0.210 forms the PRZ; first bullish reaction printed. Structure pivot to watch: 0.224–0.226 (break/hold confirms momentum). ⚡️ Price Action & Trade Setup Plan A (confirmation): Wait for a close above 0.224–0.226, buy the retest → T1, trail remainder toward T2. Plan B (PRZ fade): Scale in small on holds within 0.208–0.212 with a tight stop; add on higher-low + pivot reclaim. 🧠 Market Sentiment Choppy, but dip-buyers active near structure lows; holding above D keeps the recovery path open. 📊 Next Potential Movements Upside path: 0.226 → 0.235 → 0.249–0.261 (T1), extension toward 0.293–0.317 (T2) if momentum broadens. Pullbacks: 0.214 / 0.210 are spots to defend for higher-low continuation. 🛡 Risk Management Invalidation: clean close below 0.2078 (D); conservative invalidation below 0.1956 (X). Stops: just under 0.205 (aggressive) or < 0.195 (structure). TP: scale at T1, trail to T2; move stop to BE after ~1R. 🚀 Conclusion Gartley completion at D is holding. A firm 0.224–0.226 reclaim unlocks T1 (0.249–0.261), with room toward T2 (0.293–0.317) if buyers keep control. “Patterns set the map — discipline drives the journey.” @TRADECHARTPATTERNSLIKETHEPROS.
Disclaimer
Any content and materials included in Sahmeto's website and official communication channels are a compilation of personal opinions and analyses and are not binding. They do not constitute any recommendation for buying, selling, entering or exiting the stock market and cryptocurrency market. Also, all news and analyses included in the website and channels are merely republished information from official and unofficial domestic and foreign sources, and it is obvious that users of the said content are responsible for following up and ensuring the authenticity and accuracy of the materials. Therefore, while disclaiming responsibility, it is declared that the responsibility for any decision-making, action, and potential profit and loss in the capital market and cryptocurrency market lies with the trader.