
ProfitMagnet-Pro
@t_ProfitMagnet-Pro

What symbols does the trader recommend buying?
Purchase History
پیام های تریدر
Filter
ProfitMagnet-Pro
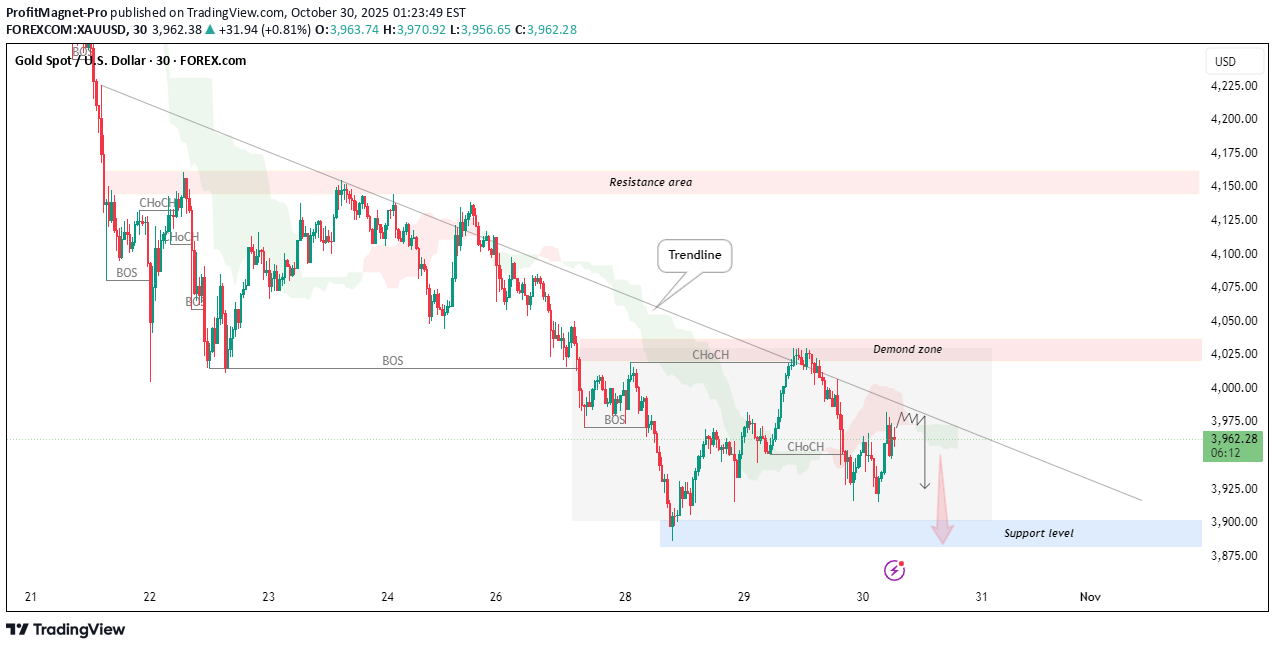
طلا (XAUUSD) در آستانه ریزش؟ خط مقاومت کلیدی را پس میگیرد!
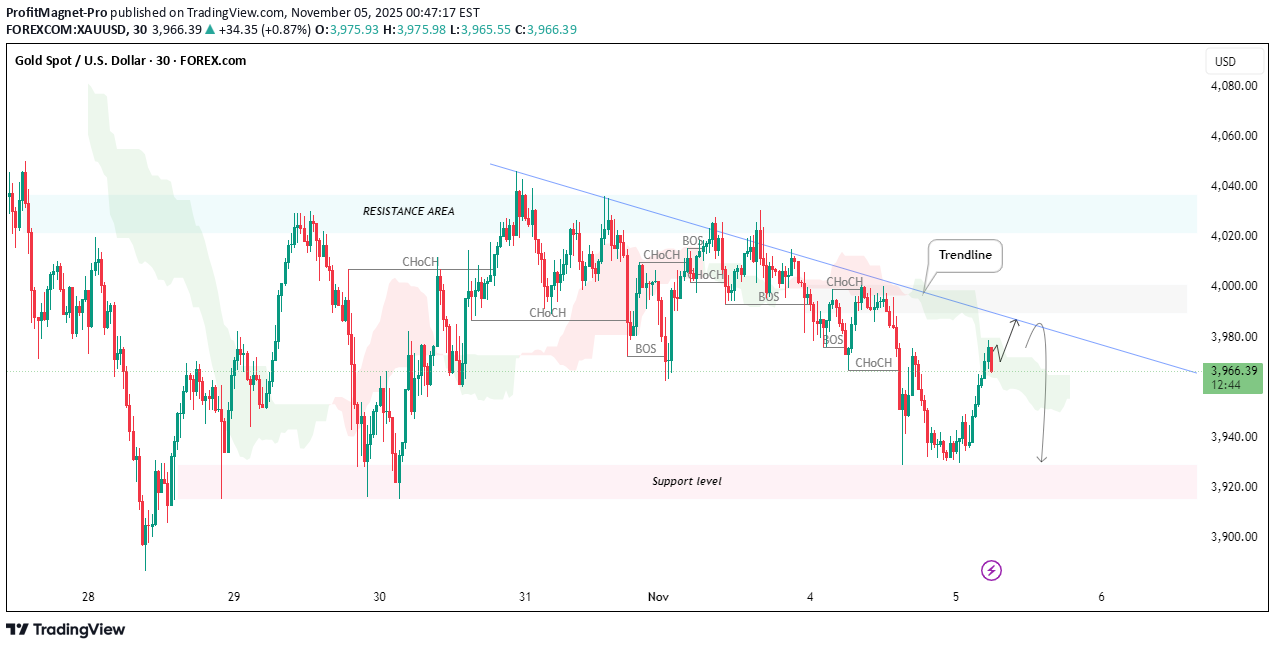
Gold is currently approaching a key descending trendline that has acted as dynamic resistance in recent sessions. Price is retesting this level near $3,975 – $3,980, aligning with a minor supply zone. The structure shows multiple CHoCH and BOS patterns, indicating recent internal weakness. A rejection from the trendline could trigger a short-term bearish move toward the support level around $3,920. However, a confirmed break and retest above the trendline would invalidate the short bias and could open room for a bullish continuation toward the $4,020 resistance area. Key Levels: Resistance: $3,980 – $4,020 Support: $3,920 – $3,900 Trend Bias: Bearish below trendline, bullish if broken
ProfitMagnet-Pro
هشدار فوری طلا: مثلث متقارن تشکیل شد؛ آیا سقوط بزرگ در راه است؟
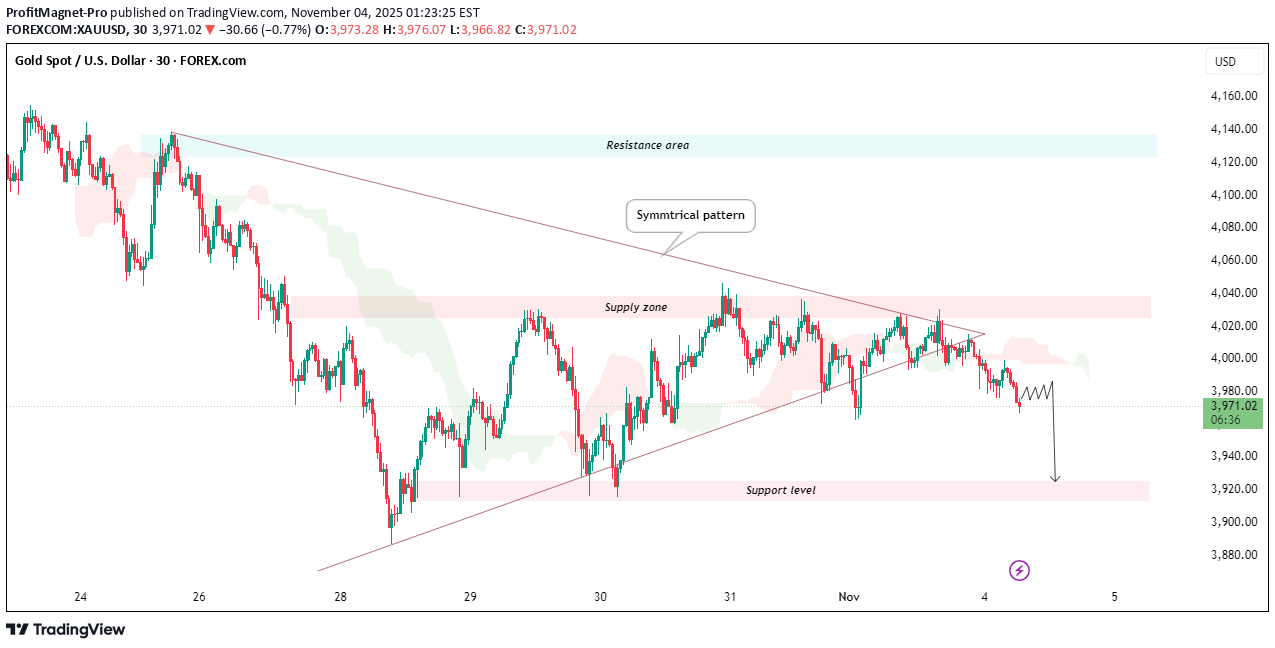
Gold is currently trading within a symmetrical pattern, showing consolidation between the supply zone (around 4020–4040) and the support level near 3920. The price recently tested the lower boundary of the triangle and is attempting to break below it, suggesting possible bearish continuation if the support fails. A confirmed close below the pattern could lead to further downside toward the next support zone near 3920, while any strong rejection might push price back toward the resistance area near 4120. Key Levels: Resistance area: 4120–4140 Supply zone: 4020–4040 Support level: 3920 Bias: Bearish (below trendline support)
ProfitMagnet-Pro
طلا در آستانه بازگشت صعودی؟ علائم کلیدی تغییر روند XAU/USD را ببینید!
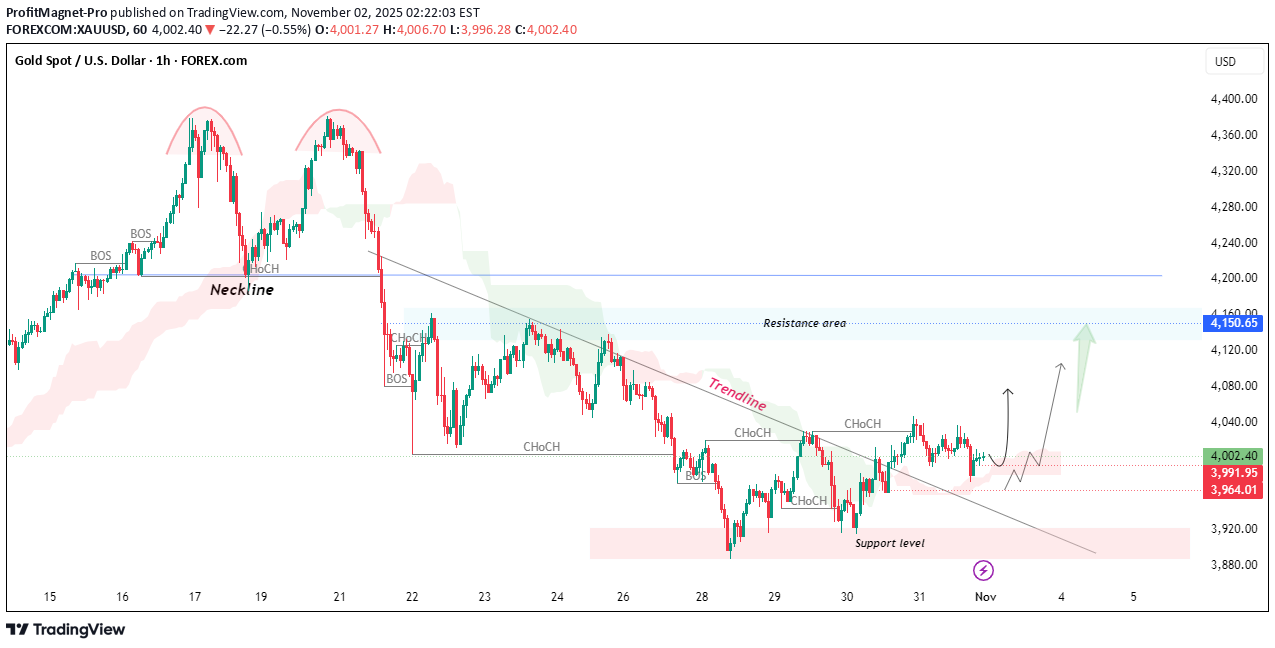
Gold price on the 1H chart shows a potential shift in market structure. After a strong bearish trend driven by the double-top breakdown and neckline break, XAU/USD found support near the 3960–3980 zone. Multiple CHoCH (Change of Character) signals suggest buyers are regaining control. If price breaks and retests the trendline resistance, a move toward the 4150 resistance area could confirm the bullish reversal. However, if the 3960 support level fails, bears may regain momentum. Support: 3960 – 3980 Resistance: 4150 – 4170 Trend bias: Neutral to Bullish (above trendline) Watch for a confirmed breakout and retest before entering long positions.
ProfitMagnet-Pro
بیت کوین در آستانه انفجار: آیا مثلث متقارن به صعود ختم میشود؟
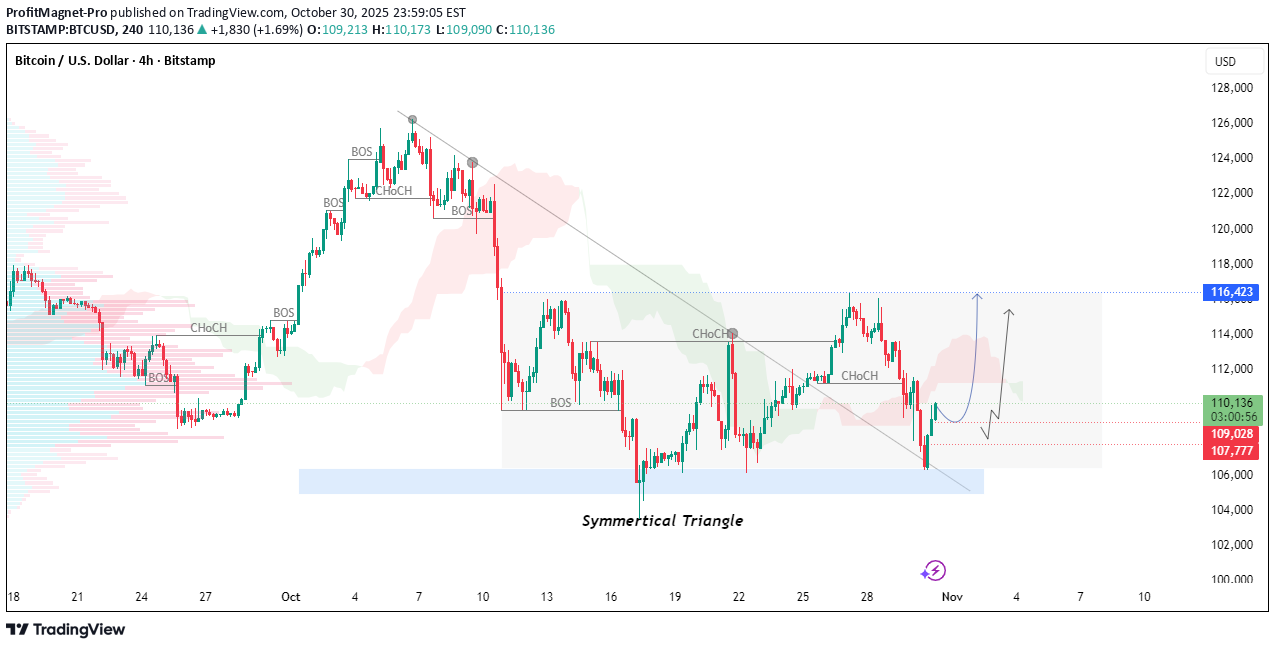
Bitcoin is currently forming a symmetrical triangle on the 4H chart after multiple Change of Character (ChoCH) and Break of Structure (BOS) points. Price has tapped into the key demand zone around $107,000–$109,000 and is now showing early signs of bullish momentum. If the structure holds and buyers maintain control, we could see a potential move toward the $116,400 resistance zone. A clean break and retest of the triangle trendline could confirm the bullish continuation. However, a rejection at this level might lead to a retest of the lower range again — so keep an eye on structure shifts and volume confirmation before entering trades
ProfitMagnet-Pro
طلا (XAUUSD) ریزش میکند؟ سیگنال قوی نزولی در انتظار حمایت ۳۹۰۰!
Gold continues to respect the descending trendline and resistance zone around the 4,000–4,025 area. After multiple Change of Character (CHoCH) and Break of Structure (BOS) confirmations, price is now showing signs of exhaustion below the trendline. A short-term pullback toward the demand zone has been completed, and the market may aim for the support level near 3,900 if bearish momentum holds. Traders should watch for bearish confirmations below 3,960 to target the support zone, while a breakout above the trendline could invalidate the bearish bias. Key Levels: Resistance: 4,025 – 4,150 Support: 3,900 – 3,875 Bias: Bearish below the trendline
ProfitMagnet-Pro
سولانا آماده انفجار؟ شکست خط روند و هدف جدید ۲۲۰ دلار!
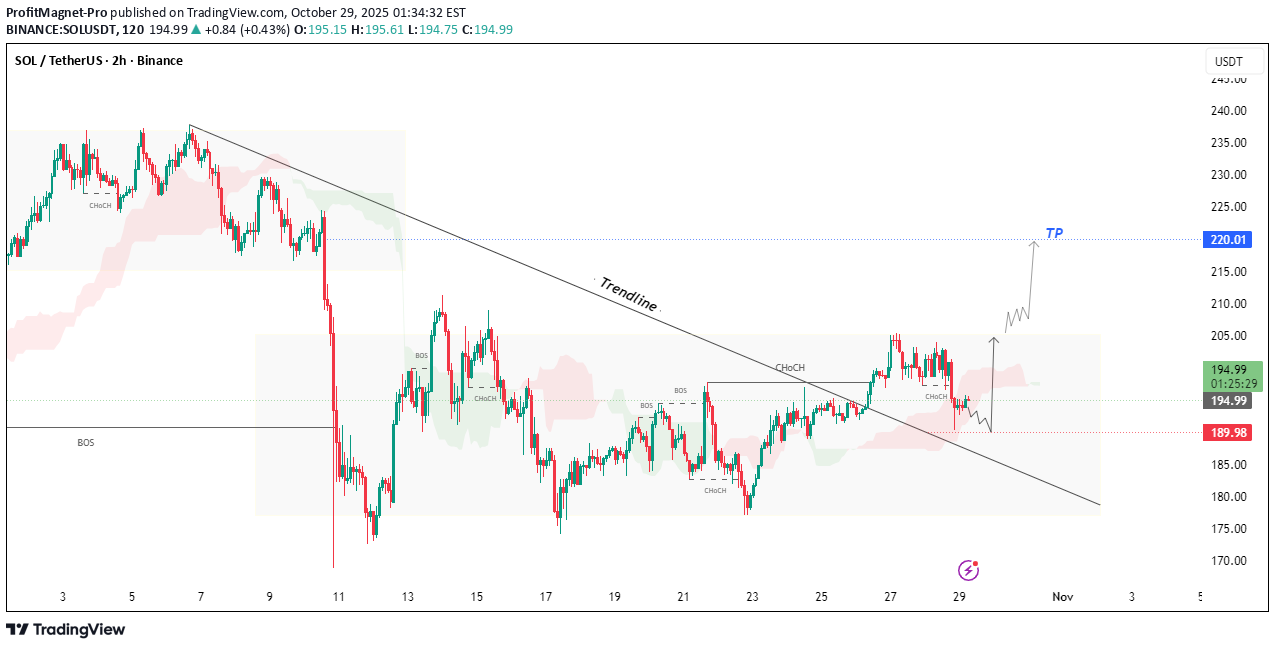
SOLUSDT on the 2H chart is showing strong bullish momentum after a Break of Structure (BOS) and a Change of Character (ChoCH) above the descending trendline. The breakout signals a potential trend reversal from bearish to bullish. Currently, price is retesting the broken trendline around the 190–195 zone. If support holds, we could see continuation toward the target zone (TP) near 220.00. 💡 Technical Outlook: Pattern: Trendline Breakout Support Zone: 190.00 – 195.00 Target: 220.00 Bias: Bullish above 190.00
ProfitMagnet-Pro
سقوط طلا: پایان رالی پس از تشکیل الگوی سقف دوقلو!
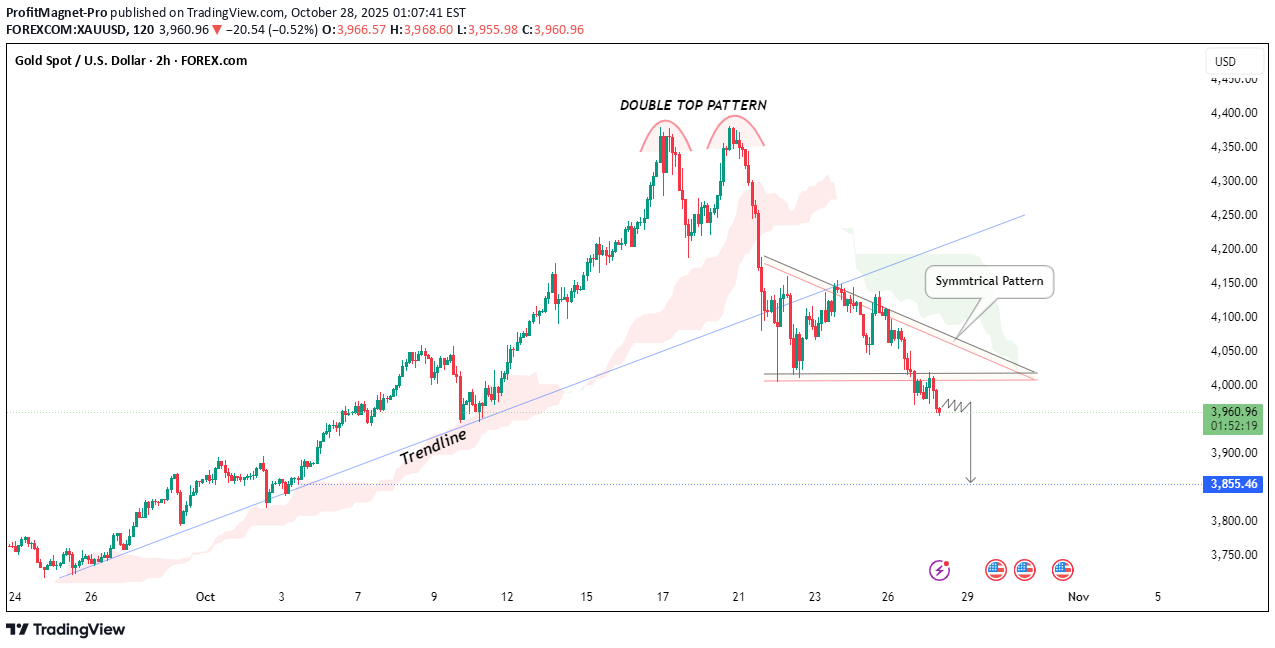
Gold (XAUUSD) on the 2-hour chart has confirmed a Double Top Pattern, signaling a potential reversal from recent highs. After breaking below the trendline support and forming a symmetrical triangle, price action shows clear bearish momentum. If the price sustains below the $4,000 level, we could see a further drop toward the next support near $3,855. Traders should watch for confirmation candles and volume before entering new positions. Resistance: $4,100 – $4,200 Support: $3,855
ProfitMagnet-Pro
بیت کوین کانال نزولی را شکست؛ آیا صعود بزرگ بعدی آغاز میشود؟
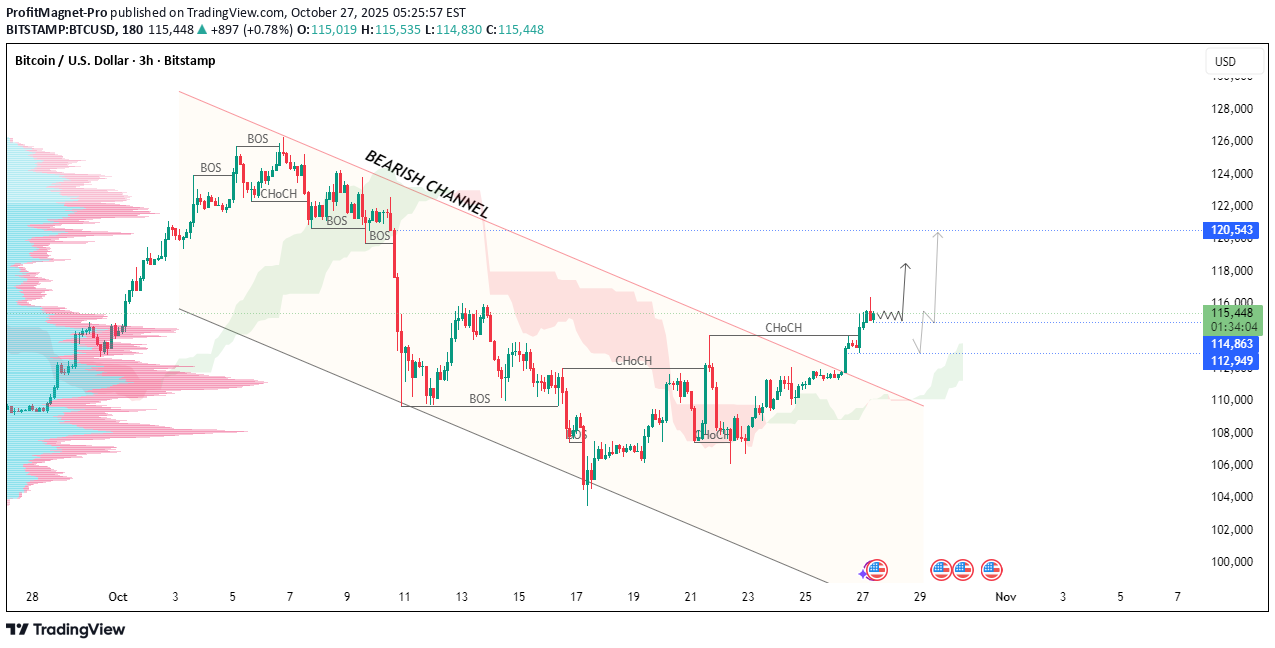
Bitcoin has successfully broken above the Bearish Channel, signaling a potential shift in market structure. Multiple ChoCH (Change of Character) confirmations indicate growing bullish sentiment after a prolonged downside move. The breakout candle pushed price above previous structure, creating a potential higher high. If Bitcoin sustains above the 114,863 support level, we could see continuation toward the next resistance area at 120,543. A pullback and successful retest of the channel breakout zone may provide bullish continuation opportunities. However, if price drops back below 112,949, bearish pressure may resume. Support: 114,863 / 112,949 Resistance: 120,543 Potential Retest Zone: Channel breakout & recent ChoCH level 📈 Market Bias: Bullish above retest zone – watching for continuation or rejection. This analysis is for educational purposes only and does not constitute financial advice. Trade responsibly.
ProfitMagnet-Pro
طلا در نقطه عطف: آیا کف سازی دوتایی، صعود قوی بعدی را رقم میزند؟
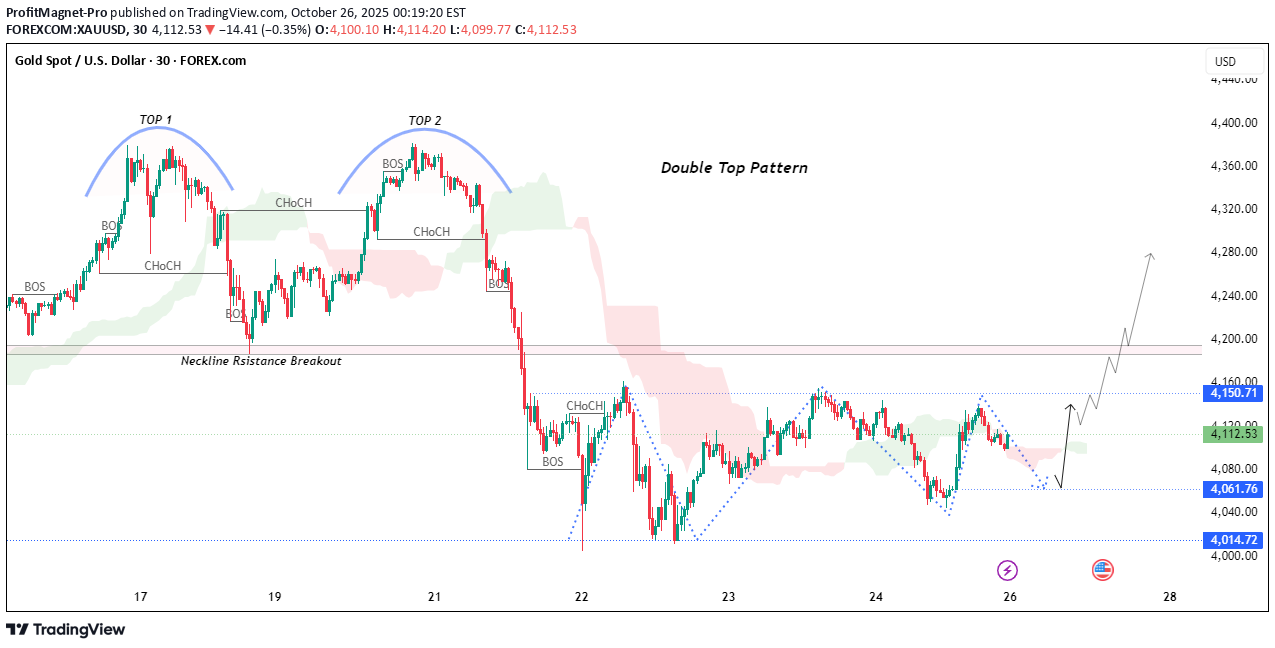
Gold (XAUUSD) has confirmed a Double Top pattern, with the neckline breakout leading to a notable downside move. After hitting support near the 4061–4014 zone, price is now showing possible consolidation with signs of a potential bullish rebound. Resistance Zone (Neckline Retest): 4145 – 4150 Immediate Support: 4061 Major Support: 4014 If price respects the support area and forms a higher low, a bounce toward the neckline resistance could trigger bullish continuation toward 4200+ levels. A breakdown below 4061 may extend bearish pressure toward 4014 support. Waiting for confirmation around support or a clean rejection from key levels can help avoid false entries.
ProfitMagnet-Pro
شکست خط روند نزولی اتریوم: آیا صعود قوی به سوی ۴۱۰۰ دلار در راه است؟
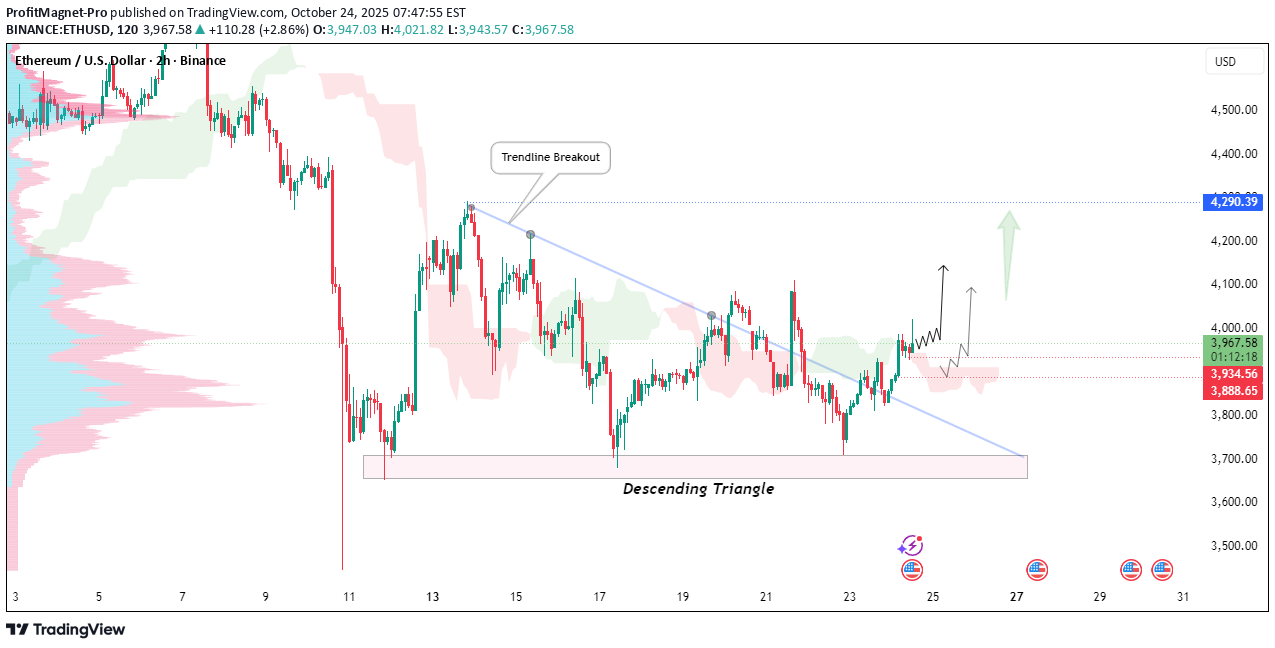
Ethereum (ETH/USD) has broken out of a descending trendline, indicating a potential shift in market sentiment. Price has been consolidating within a descending triangle, repeatedly testing the support zone near the $3,700–$3,750 area. Following the breakout, ETH is now showing early signs of a bullish continuation, with possible higher lows forming above the broken trendline. If the price sustains above the breakout zone, continued momentum could drive it toward the next resistance area. Descending triangle structure with strong support near $3,700. Successful breakout of descending trendline. Potential bullish push if price sustains above current consolidation. Volume profile supports higher liquidity above. First bullish target sits near $4,100. Extended target toward $4,290 (major resistance). Retest of the trendline + support zone → Higher low → Move toward $4,100 and potentially $4,290. Failure to hold above the broken trendline and a break below the $3,700 support zone could reintroduce bearish pressure. This analysis is for educational purposes only. Always manage your risk and trade responsibly.
Disclaimer
Any content and materials included in Sahmeto's website and official communication channels are a compilation of personal opinions and analyses and are not binding. They do not constitute any recommendation for buying, selling, entering or exiting the stock market and cryptocurrency market. Also, all news and analyses included in the website and channels are merely republished information from official and unofficial domestic and foreign sources, and it is obvious that users of the said content are responsible for following up and ensuring the authenticity and accuracy of the materials. Therefore, while disclaiming responsibility, it is declared that the responsibility for any decision-making, action, and potential profit and loss in the capital market and cryptocurrency market lies with the trader.