
TradeChartPatternsLikeThePros
@t_TradeChartPatternsLikeThePros

What symbols does the trader recommend buying?
Purchase History
پیام های تریدر
Filter
TradeChartPatternsLikeThePros
تحلیل طلا (XAUUSD): فرصت فروش پنهان با الگوی AB=CD متقارن!
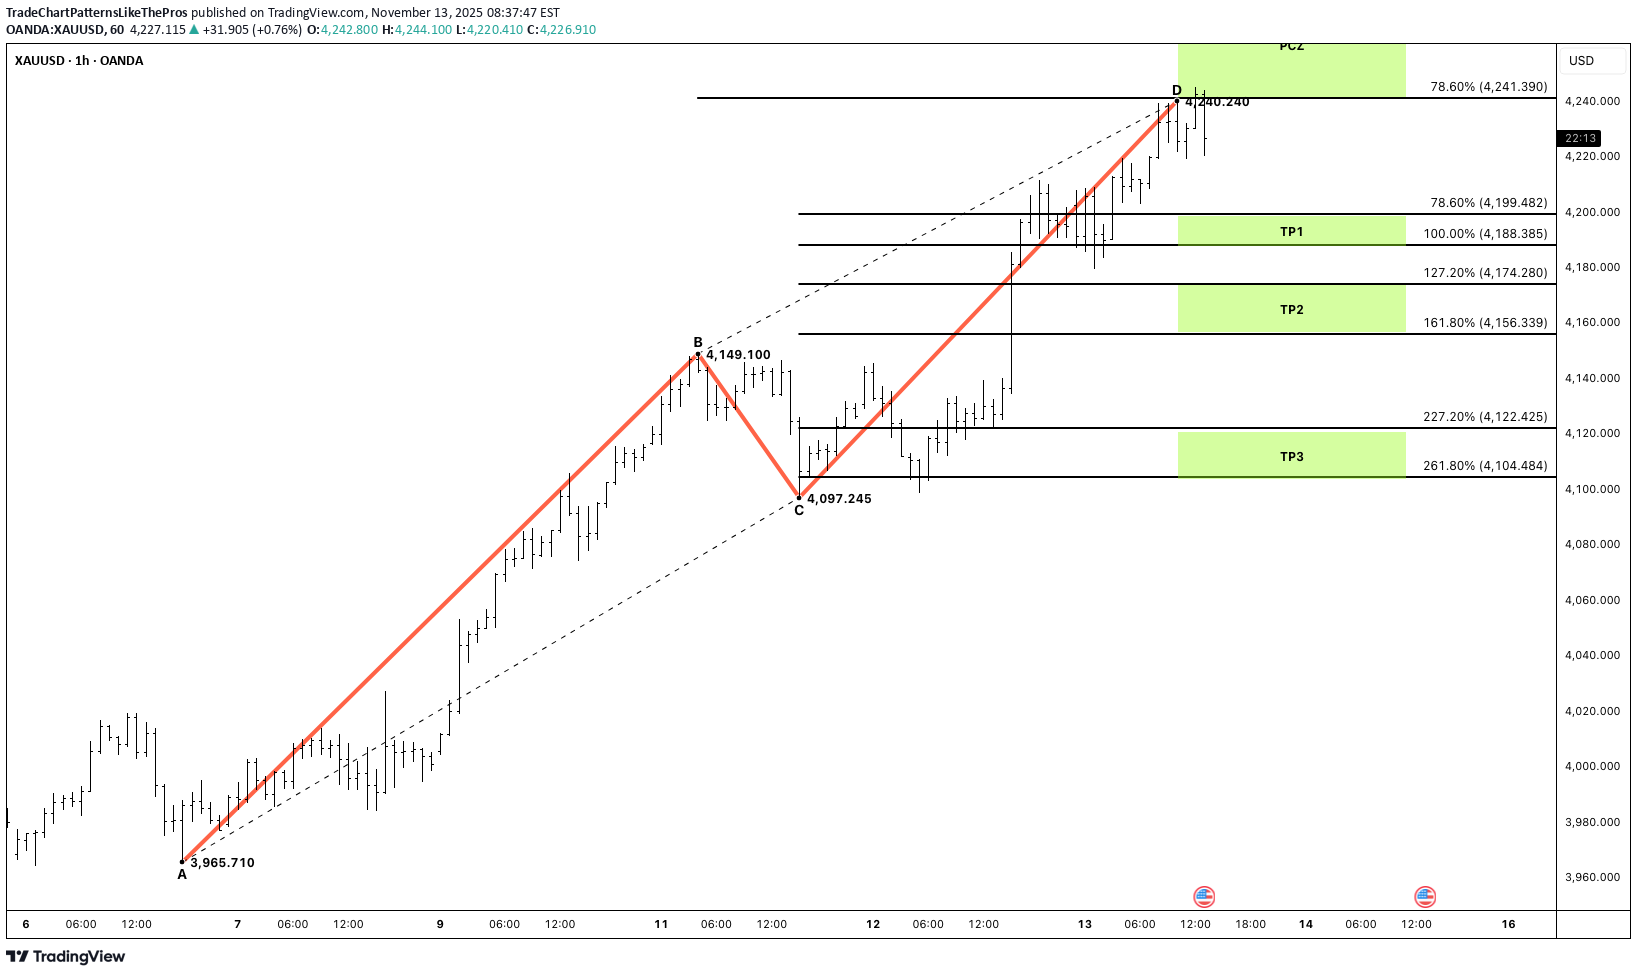
Hello traders, hope you’re doing well this trading week and that you’re all catching some nice pips from the markets. Today I’m looking at Gold (XAUUSD, 1H) and we’ve got a clean bearish AB=CD symmetry setup on the chart, offering a potential short opportunity. Price has completed the AB=CD leg into the PCZ, with point D landing right around the 0.786–1.000 AB zone (≈ 4,241–4,280). This is my Potential Completion Zone (PCZ) where I’m watching for signs of exhaustion and rejection. Key Levels PCZ (short idea zone): 4,241 – 4,280 TP1: 4,199 – 4,188 (first reaction target) TP2: 4,174 – 4,156 (127–161.8% extension zone) Invalidation: Clean break and hold above 4,280 Trading Plan If I get bearish confirmation (wick rejections, bearish candle close, or breakdown from local structure), I’ll look for shorts from the PCZ, targeting TP1 first and then TP2 if momentum continues. A sustained move above 4,280 cancels the bearish idea and suggests standing aside or reassessing for a bullish continuation. Manage risk carefully, keep size controlled, and let the AB=CD symmetry do the heavy lifting.
TradeChartPatternsLikeThePros
تحلیل تکنیکال اتریوم: آیا موج صعودی بزرگ ETH آغاز شده است؟ (الگوی AB=CD)
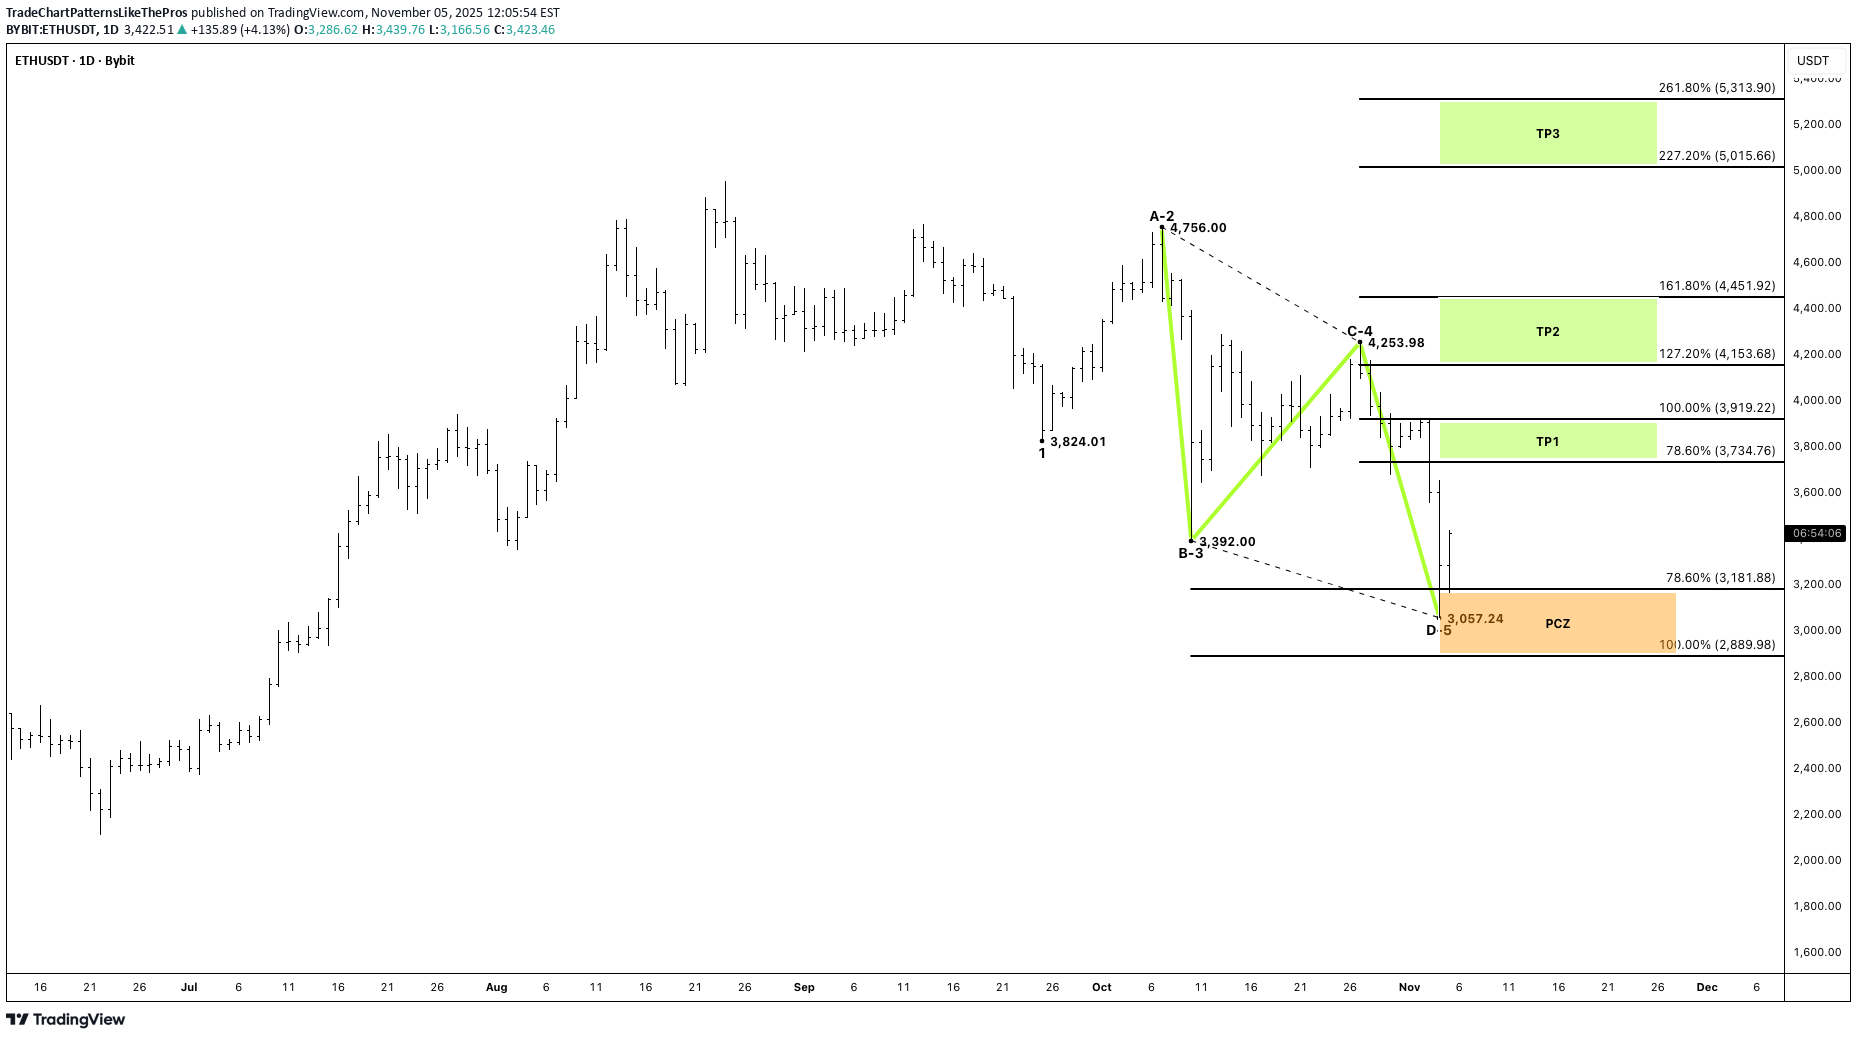
Hello traders — hope you’re all gathering some pips! Quick ETH update on the 1D chart: we’ve just completed a clean AB=CD (1:1) after a five-wave drop into the PCZ, and price rejected the zone with a bounce from D ≈ 3,057. Bias turns bullish while we hold above the PCZ. Symbol: ETHUSDT (1D) Key Levels A–B–C–D: A ≈ 4,756 → B ≈ 3,392 → C ≈ 4,254 → D ≈ 3,057 PCZ: 3,182 – 2,889 (D printed inside, strong reaction) TP1: 3,735 – 3,919 TP2: 4,154 – 4,452 TP3: 5,016 – 5,314 Invalidation: daily close < 2,889 Plan Long on a retest/hold of 3,18x–3,05x or on continuation above last bounce high. Scale out 30% / 40% / 30% at TP1/TP2/TP3; trail under rising swing lows. Risk Risk ≤1%. Initial SL just below 2,889 (beyond PCZ). Move to BE after ~1R. Notes Structure respects Equal Length (AB=CD) and fib confluence; staying above the PCZ keeps the path open toward TP1 → TP2 → TP3.
TradeChartPatternsLikeThePros
GARTLEY
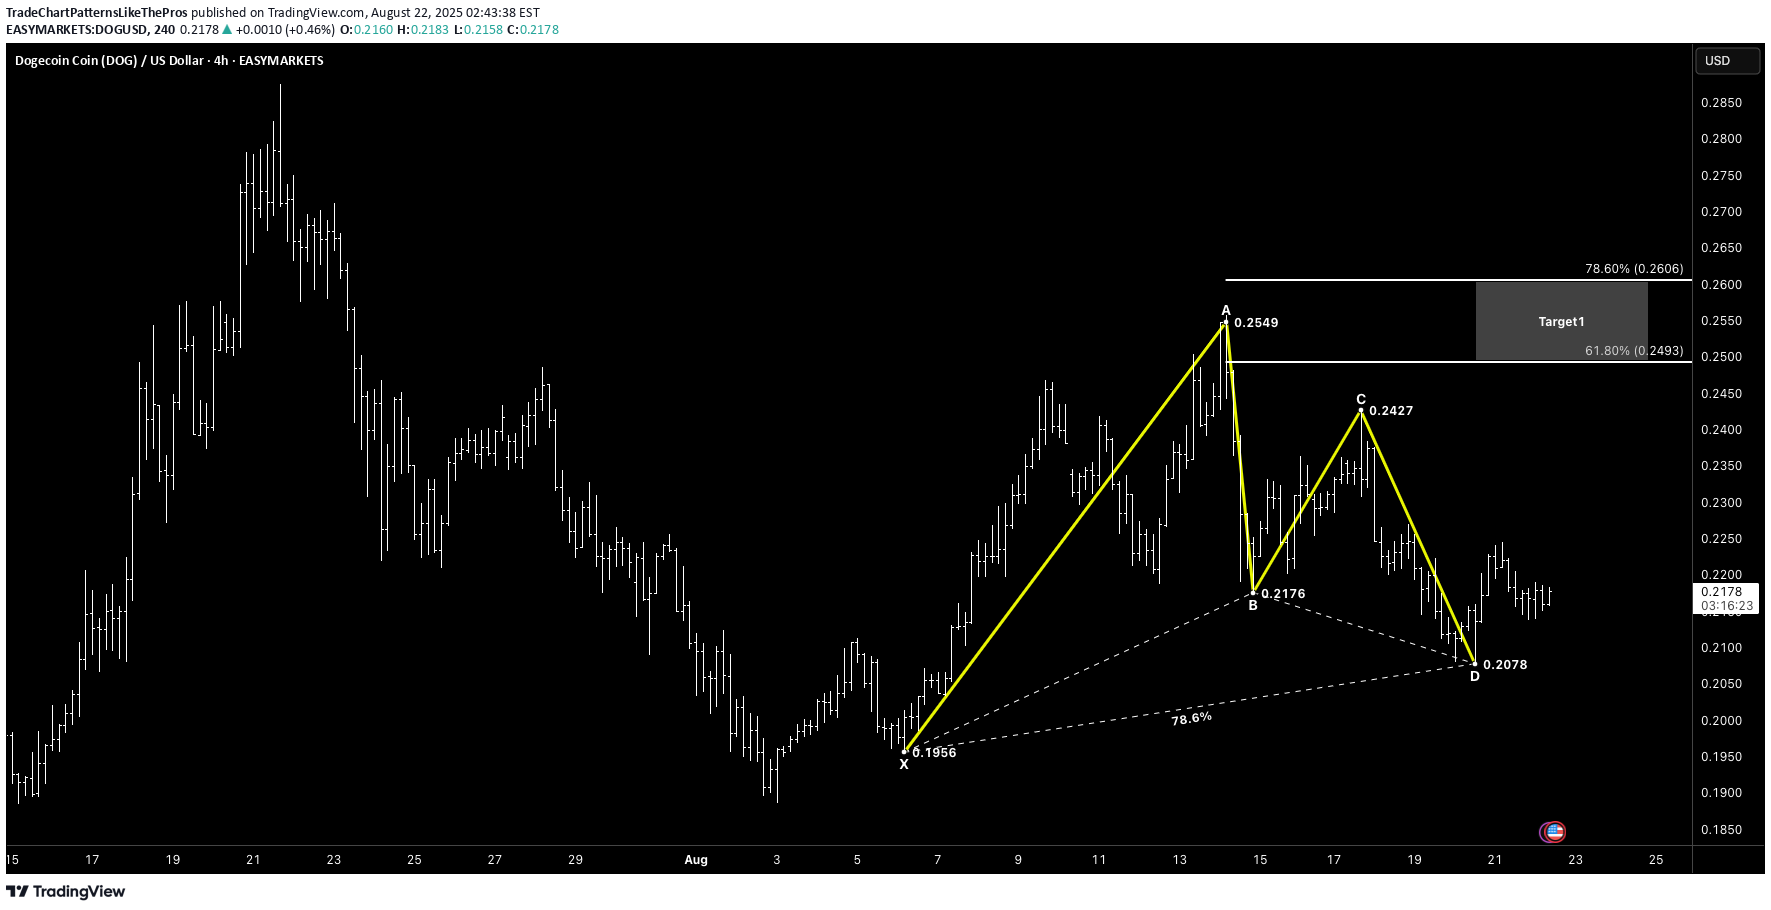
DOGE/USD (4H) – Bullish Gartley at D (Reversal → T1/T2) Quick summer check-in while I sneak some downtime: DOGE just printed a clean Gartley-style completion and buyers are reacting at D. 📌 Pattern Overview Pattern: Gartley (Bullish) Asset: Dogecoin / USD Timeframe: 4H Bias: Long from D/PRZ on confirmation and structure reclaim 🔑 Key Levels X: 0.1956 A: 0.2549 B: 0.2176 (shallow retrace of XA) C: 0.2427 D (PRZ): 0.2078 (confluence with XA fib + AB=CD symmetry) Target 1: 0.2493 – 0.2606 (≈ 61.8%–78.6% of AD) Target 2: 0.2933 – 0.3165 (≈ 127.2%–161.8% extension) 📐 Technical Confirmation BC retrace ≈ 67% of AB, CD ≈ 1.27–1.41 × BC into D. Confluence at 0.207–0.210 forms the PRZ; first bullish reaction printed. Structure pivot to watch: 0.224–0.226 (break/hold confirms momentum). ⚡️ Price Action & Trade Setup Plan A (confirmation): Wait for a close above 0.224–0.226, buy the retest → T1, trail remainder toward T2. Plan B (PRZ fade): Scale in small on holds within 0.208–0.212 with a tight stop; add on higher-low + pivot reclaim. 🧠 Market Sentiment Choppy, but dip-buyers active near structure lows; holding above D keeps the recovery path open. 📊 Next Potential Movements Upside path: 0.226 → 0.235 → 0.249–0.261 (T1), extension toward 0.293–0.317 (T2) if momentum broadens. Pullbacks: 0.214 / 0.210 are spots to defend for higher-low continuation. 🛡 Risk Management Invalidation: clean close below 0.2078 (D); conservative invalidation below 0.1956 (X). Stops: just under 0.205 (aggressive) or < 0.195 (structure). TP: scale at T1, trail to T2; move stop to BE after ~1R. 🚀 Conclusion Gartley completion at D is holding. A firm 0.224–0.226 reclaim unlocks T1 (0.249–0.261), with room toward T2 (0.293–0.317) if buyers keep control. “Patterns set the map — discipline drives the journey.” @TRADECHARTPATTERNSLIKETHEPROS.
TradeChartPatternsLikeThePros
Symmetry
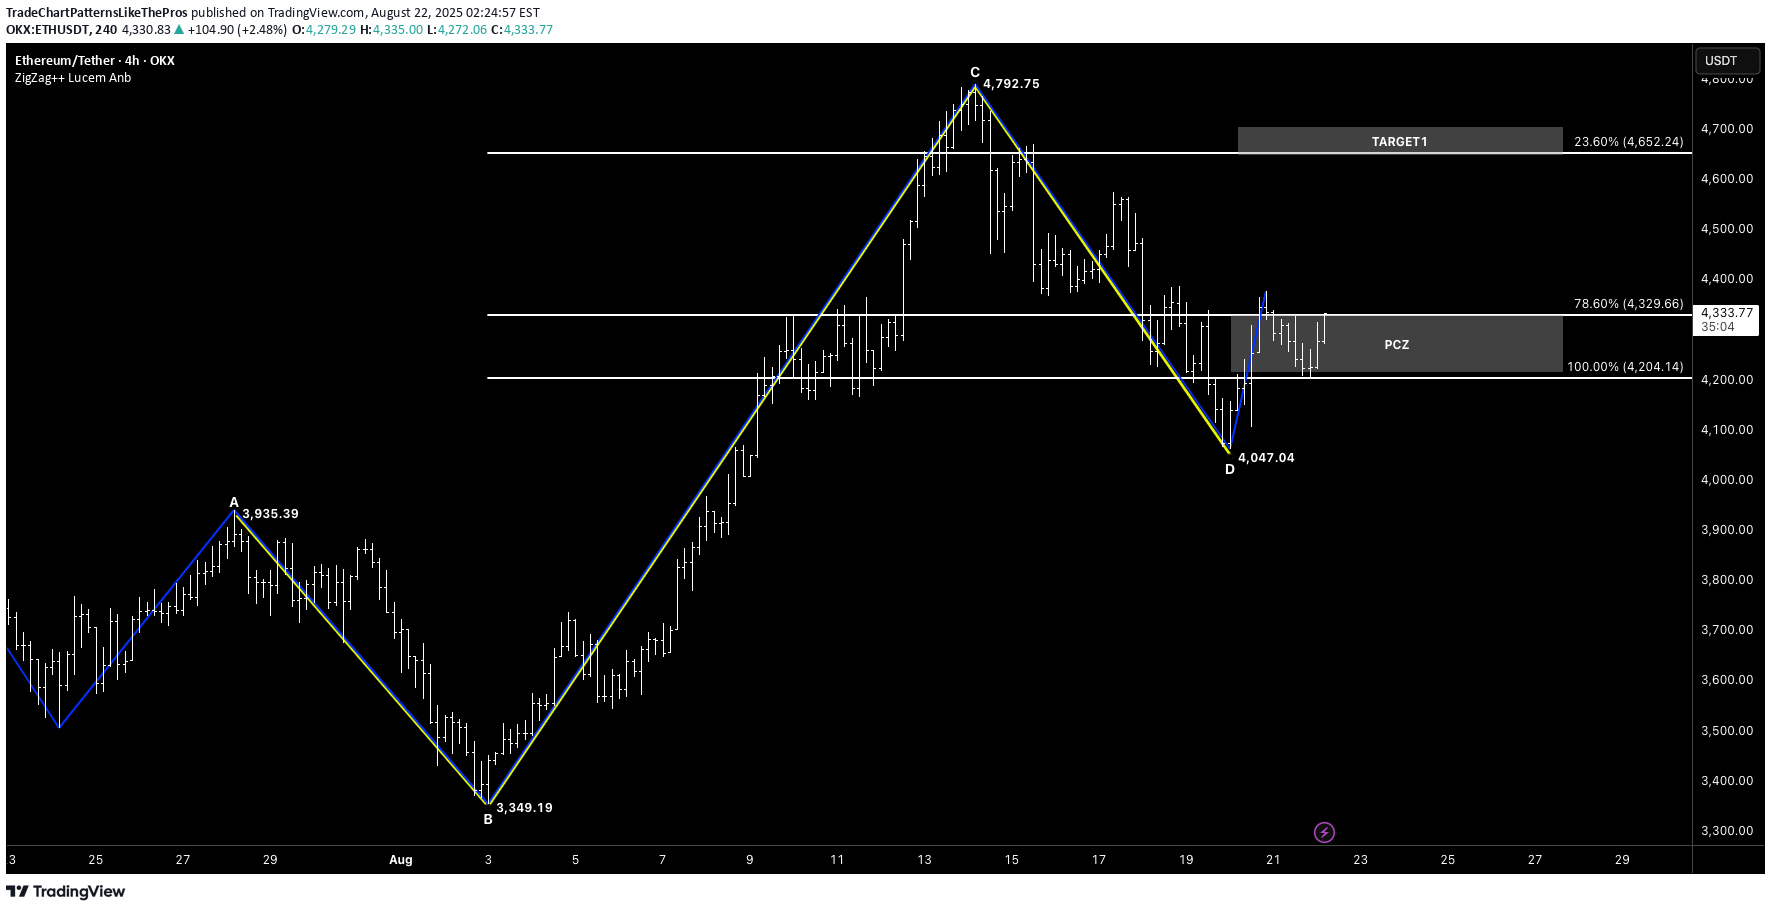
Hello awesome traders! Hope you’re having a great summer. I’ve been juggling a few projects and a little time off—but eyes always on the charts. Today: Ethereum showing a clean symmetry (equal-legs) bullish setup. Overview Pattern: Symmetry / AB=CD (equal-legs) bullish Context: Price printed D ≈ 4,047 and reclaimed momentum above 4,140, then based inside PCZ1. Bias: Bullish while holding/reclaiming the PCZ1 band. Key Levels PCZ1 (retest/reclaim zone): 4,204 – 4,329 Momentum line: 4,140 (hold above = bulls in control) Target 1: 4,652 (prior measured level on chart) Target 2 zone: 5,191 – 5,498 Trade Plan Primary long: 4H close above 4,329 (top of PCZ1) → look for continuation toward T1 4,652, then T2 5,191–5,498. Alternative long: Reactive buy on a retest/hold of 4,204–4,220 with a bullish rejection (wick + strong close back inside PCZ1). If PCZ1 rejects: Watch for a higher-low setup back near 4,260/4,220. Lose 4,140 on a 4H close → stand aside; deeper pullback to 4,080–4,050 possible. Risk Management Risk ≤ 1% per idea. Stops: Conservative below 4,120 (for PCZ1 retest entries) or below 4,040 (for deeper-pullback entries). Management: Scale at T1, trail to BE after ~1R, leave a runner toward T2 if momentum holds. Notes Structure stays valid while 4,140 holds on closing basis and price continues to respect PCZ1. Confirmation = clean 4H close and hold above 4,329 with rising momentum. @tradechartpatternslikethepros.
TradeChartPatternsLikeThePros
SYMMETRY

Hey traders, hope you’re crushing it this week! 🚀 Quick note on our BTC/USD 4-hour ABC setup: the symmetry I’m talking about is purely price-based—AB and BC move roughly the same number of ticks, not the same amount of time. So when we say “symmetry,” we mean: A→B drop: ~3,670 ticks B→C rally: ~3,427 ticks That close price match gives us confidence in our PCZ at 107,600–107,300 (78.6%–100% retrace of B→C). ⚔️ Trade Plan Recap Entry: Long between 107,300–107,600 Stop: Below 107,000 (keeps risk tight) Targets: Zone 1: 61.8–78.6% of B→C → 110,657–111,569 Zone 2: 127.2–161.8% extension of A→B → 114,206–116,084 Remember: look for that bullish pin-bar or engulfing candle down in our PCZ before pulling the trigger, and bail if we lose 107,000. No time-based symmetry here—just clean price alignment. Trade with structure, not emotion, and keep an eye on any macro or on-chain news for extra context. ✌️
TradeChartPatternsLikeThePros
Cup and Handle

Hello Traders 👋 — Hope you're having a strong start to the week! Let's dive into the BTCUSD Daily Chart 📈 — we’re looking at a Cup and Handle setup that's matured beautifully. 🔵 Price carved out a clean rounded base (cup), followed by a consolidation handle right below resistance. 🟠 The 200 SMA is holding as dynamic support. ⚡️ A confirmed break above 109K could launch price toward 130K+, with clear Fibonacci extension targets in sight. Key Zones: Handle Support: 100,472 Breakout Line: 109,360 Main Target: 130,867 Extended: 136K–144K Structure ✅ | Momentum Building ⚡ | Risk Managed 🎯 Stay sharp, stay patient. Structure first — breakout next.
TradeChartPatternsLikeThePros
Chart Breakdown – GOLD (4H) KEY LEVEL TO WHATCH AND WHY

Hello traders!It’s been a while since our last market update — I’ve been tied up working on a few exciting projects behind the scenes. But let’s dive straight into the action with a fresh look at GOLD for this week.🔍 Chart Breakdown – GOLD (4H)We’ve been tracking a Double Drive Bullish setup that activated from the Entry Level at 3177.11, and since then, price has unfolded a sequence of high-probability structures:✅ ABC bullish continuation✅ Multiple Double Drive formations✅ A clean 121 Bullish Symmetry Pattern✅ Rectangular Channel breakout✅ Local Head & Shoulders bottomAs expected, price found support near the 78.6% retracement at 3308, which was also the final wall of the last 121 structure. From there, GOLD pushed impulsively and is now trading at 3432.🟩 Key Level to Watch: 3432.50This is our pivot. If price holds this zone, we may be setting up for an extension move — potentially toward:🔹 61.8% Extension – 🔹 78.6% Extension – 🔹 100% 121 target – full symmetry alignment and major exhaustion zone📈 Summary:We’re in a continuation structure with bullish pressure building. GOLD is respecting all key reversal structures and fib symmetry so far. As long as 3432.50 holds, we’re eyeing new highs — with the potential to challenge ATH zones through the layered completion targets above.Let’s keep our focus sharp, manage risk like pros, and trade with discipline.Stay tuned for real-time updates and new pattern alerts throughout the week.— Trade Chart Patterns Like The Pros
TradeChartPatternsLikeThePros
GOLD KEY LEVELS TO WATCH

Hello Traders, I hope you're having a fantastic trading week so far! Let’s dive into the current setup on Gold, as it's presenting an exciting trading opportunity.H4 Chart: Price Action Reversal with Key Fibonacci LevelsOverview: On the 4-hour chart, we observe a price action reversal pattern aligning with a 200% Fibonacci extension. The price has recently formed a higher low after completing an impulsive move.Market Structure: As long as the price remains below the previous higher high (HH), we anticipate the formation of a lower high (LH).Key Entry Level (EL): The price is trading below the EL, reinforcing bearish potential.Target: The 100% Fibonacci extension serves as the initial key target, aligning with the ABC pattern’s symmetrical swing.H1 Chart: Bearish Gartley Harmonic PatternOverview: The 1-hour chart showcases a Gartley bearish pattern, nearing the Potential Reversal Zone (PRZ).False Breakout: There is a clear false breakout above the EL, indicating possible exhaustion of buyers at this level.Key Levels:PRZ: Acts as a strong confluence zone for a potential short opportunity.Target: The first bearish target aligns with the subconfluent low (H4) and the ABC extension target from the higher timeframe.Trading PlanMonitor Price Action During U.S. Trading Hours:Focus on key reactions at the PRZ and any bearish reversal signals (e.g., engulfing candles, 3-candle reversal).Bearish Case:A rejection at the PRZ and a sustained move below the EL could confirm bearish continuation.Bullish Invalidity:If the price closes significantly above the EL, this would invalidate the bearish setup and indicate continued upward momentum.Final Notes:We’ll keep an eye on the movement and provide any updates as the price unfolds. Let the pips be with you—stay tuned for the outcome!
TradeChartPatternsLikeThePros
👑 GOLD XAUUSD 🗝️ LEVELS TO WATCH 👀AND WHY 🤔

Hello, fellow traders! I hope your trading week has been nothing short of fantastic. The recent movements in the gold market have certainly been thrilling. However, as we all know, prices in trading don't ascend perpetually, and it's crucial to adapt our strategies accordingly. Let's delve into a promising opportunity presented by gold.Hello, fellow traders! I hope your trading week has been nothing short of fantastic. The recent movements in the gold market have certainly been thrilling. However, as we all know, prices in trading don't ascend perpetually, and it's crucial to adapt our strategies accordingly. Let's delve into a promising opportunity presented by gold.Observing the gold chart reveals a pattern we've encountered before: a higher high and a higher low at the 61.8 percent retracement, commonly known as the ABC pattern. Why patterns, you might wonder? Well, each pattern offers valuable insights, allowing us to project Fibonacci retracement levels not only for targets but also for determining support, resistance, and entry points.Currently, the gold chart exhibits an ABC bearish pattern, with the price trading below the level of 2360.40. Our analysis primarily focuses on the daily timeframe, although trading opportunities may also arise on lower timeframes such as H4. It's worth noting that prudent risk management is essential to mitigate potential losses, particularly if the trade veers off course. Should the price surpass the C stop at 2380.37, adjustments to our setup will be necessary.Turning to our targets, we've identified two key zones: Zone 62% at 2282.89 and Zone 79% at 2256.81. For those inclined to let profits run, the 138% target sits at 2218.37, with the 162% target following closely at 2182.34.This strategy is straightforward yet effective, and additional trades may be executed on lower timeframes for those interested. Stay tuned for further updates! Wishing you all successful trades ahead, and may the pip be ever in your favor!Observing the gold chart reveals a pattern we've encountered before: a higher high and a higher low at the 61.8 percent retracement, commonly known as the ABC pattern. Why patterns, you might wonder? Well, each pattern offers valuable insights, allowing us to project Fibonacci retracement levels not only for targets but also for determining support, resistance, and entry points.Currently, the gold chart exhibits an ABC bearish pattern, with the price trading below the level of 2360.40. Our analysis primarily focuses on the daily timeframe, although trading opportunities may also arise on lower timeframes such as H4. It's worth noting that prudent risk management is essential to mitigate potential losses, particularly if the trade veers off course. Should the price surpass the C stop at 2380.37, adjustments to our setup will be necessary.Turning to our targets, we've identified two key zones: Zone 62% at 2282.89 and Zone 79% at 2256.81. For those inclined to let profits run, the 138% target sits at 2218.37, with the 162% target following closely at 2182.34.This strategy is straightforward yet effective, and additional trades may be executed on lower timeframes for those interested. Stay tuned for further updates! Wishing you all successful trades ahead, and may the pip be ever in your favor!
TradeChartPatternsLikeThePros
👑 XAUUSD GOLD KEY🗝️LEVELS TO WATCH 👀AND WHY🤔

Hello Traders! Let's delve into the recent movements of Gold (XAU/USD) on the daily timeframe, exploring potential opportunities:📉 Patterns Unfolding: V Bottom & AB=CD FormationThe charts reveal the presence of a V Bottom pattern, coupled with an AB=CD formation, signaling the potential for a bullish upswing.🔍 Current Scenario:Notably, the price has surpassed the breakout level situated at 2031.72, showcasing strength in the bullish sentiment.🎯 Critical Levels to Observe:Keep a watchful eye on key levels, particularly around 2044.95 and the 38% retracement at 2049.96.Traders may consider securing partial profits as the price approaches the 38% retracement.🚨 Risk Management Strategies:Mitigate risks by placing a stop-loss order strategically below the low preceding the breakout level.🎯 Exploring Target Zones:Potential target zones include the 62% retracement around 2061.29 and the 79% retracement at 2069.24.
Disclaimer
Any content and materials included in Sahmeto's website and official communication channels are a compilation of personal opinions and analyses and are not binding. They do not constitute any recommendation for buying, selling, entering or exiting the stock market and cryptocurrency market. Also, all news and analyses included in the website and channels are merely republished information from official and unofficial domestic and foreign sources, and it is obvious that users of the said content are responsible for following up and ensuring the authenticity and accuracy of the materials. Therefore, while disclaiming responsibility, it is declared that the responsibility for any decision-making, action, and potential profit and loss in the capital market and cryptocurrency market lies with the trader.