
DIA
DIA
| تریدر | نوع سیگنال | حد سود/ضرر | زمان انتشار | مشاهده پیام |
|---|---|---|---|---|
No results found. | ||||
Price Chart of DIA
سود 3 Months :
سیگنالهای DIA
Filter
Sort messages by
Trader Type
Time Frame

mastercrypto2020
سیگنال خرید قوی DIA/USDT: بهترین نقطه ورود با پتانسیل سود 6 برابری!
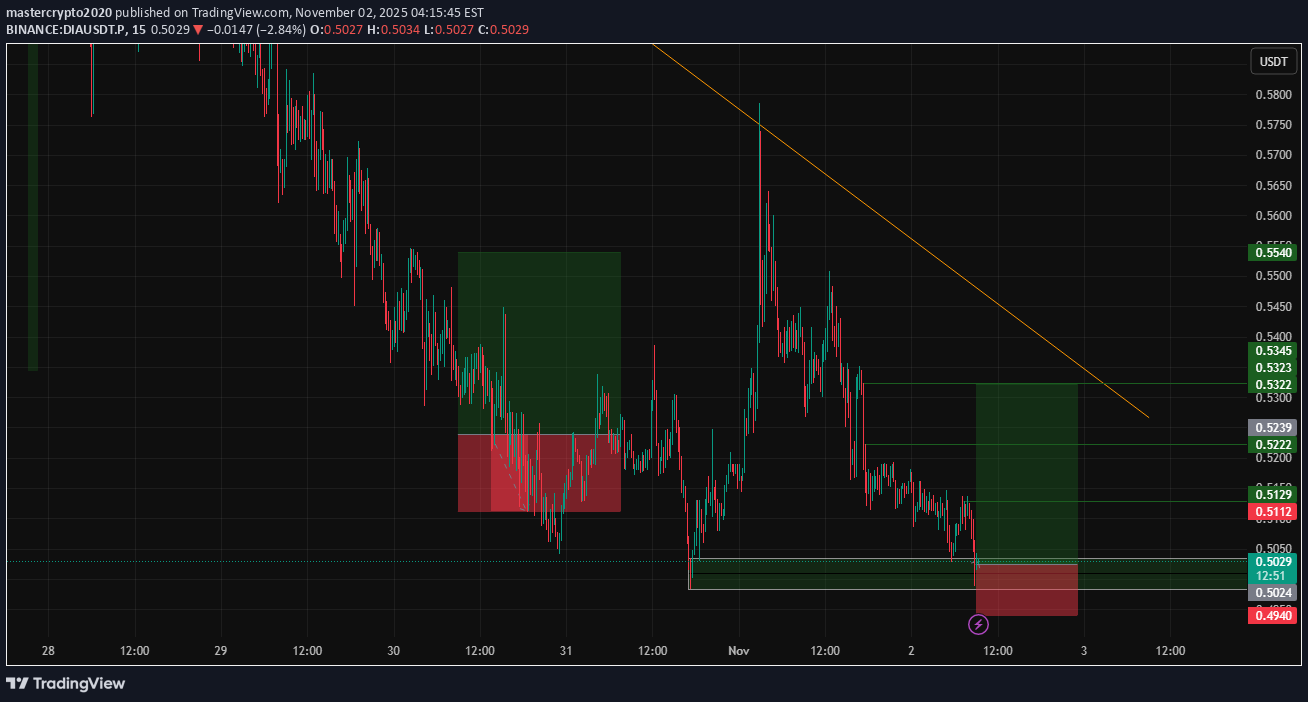
--- 📢 Signal Alert 🔹 Pair: DIA / USDT 📈 Trade Type: Long 💰 Entry Price: 0.05024 🎯 Take-Profit Targets: TP1 = 0.05130 → R/R = 1 : 2.5 TP2 = 0.05220 → R/R = 1 : 4.2 TP3 = 0.05320 → R/R = 1 : 6.1 🛑 Stop-Loss: 0.04940 📊 Timeframe: 1H ⚖️ Average Risk/Reward Ratio: ≈ 1 : 4.2 📌 Suggested Leverage: 10 --- 🧠 Technical Analysis Explanation DIA has successfully retested the demand zone around 0.0494–0.0496, forming a new higher low and confirming bullish momentum. Price action is holding above the EMA 50, and RSI has rebounded from the midline (50), showing renewed buyer strength. The entry at 0.05024 provides an optimal setup just above dynamic support, with multiple target levels aligned with short-term resistance zones. The stop-loss is placed below the local swing low to protect against fake breakdowns. --- ⚙️ Trade Management Rule Once TP1 is reached, move your Stop-Loss to Entry (0.05024) to secure capital. Wait for bullish confirmation (like a 1H engulfing or hammer candle) before executing the trade. Always follow strict risk management for consistency and capital growth.

SatochiTrader
هشدار فوری: سقوط دیآیای آغاز شد! آیا قیمت به کف ۰.۳۸ میرسد؟
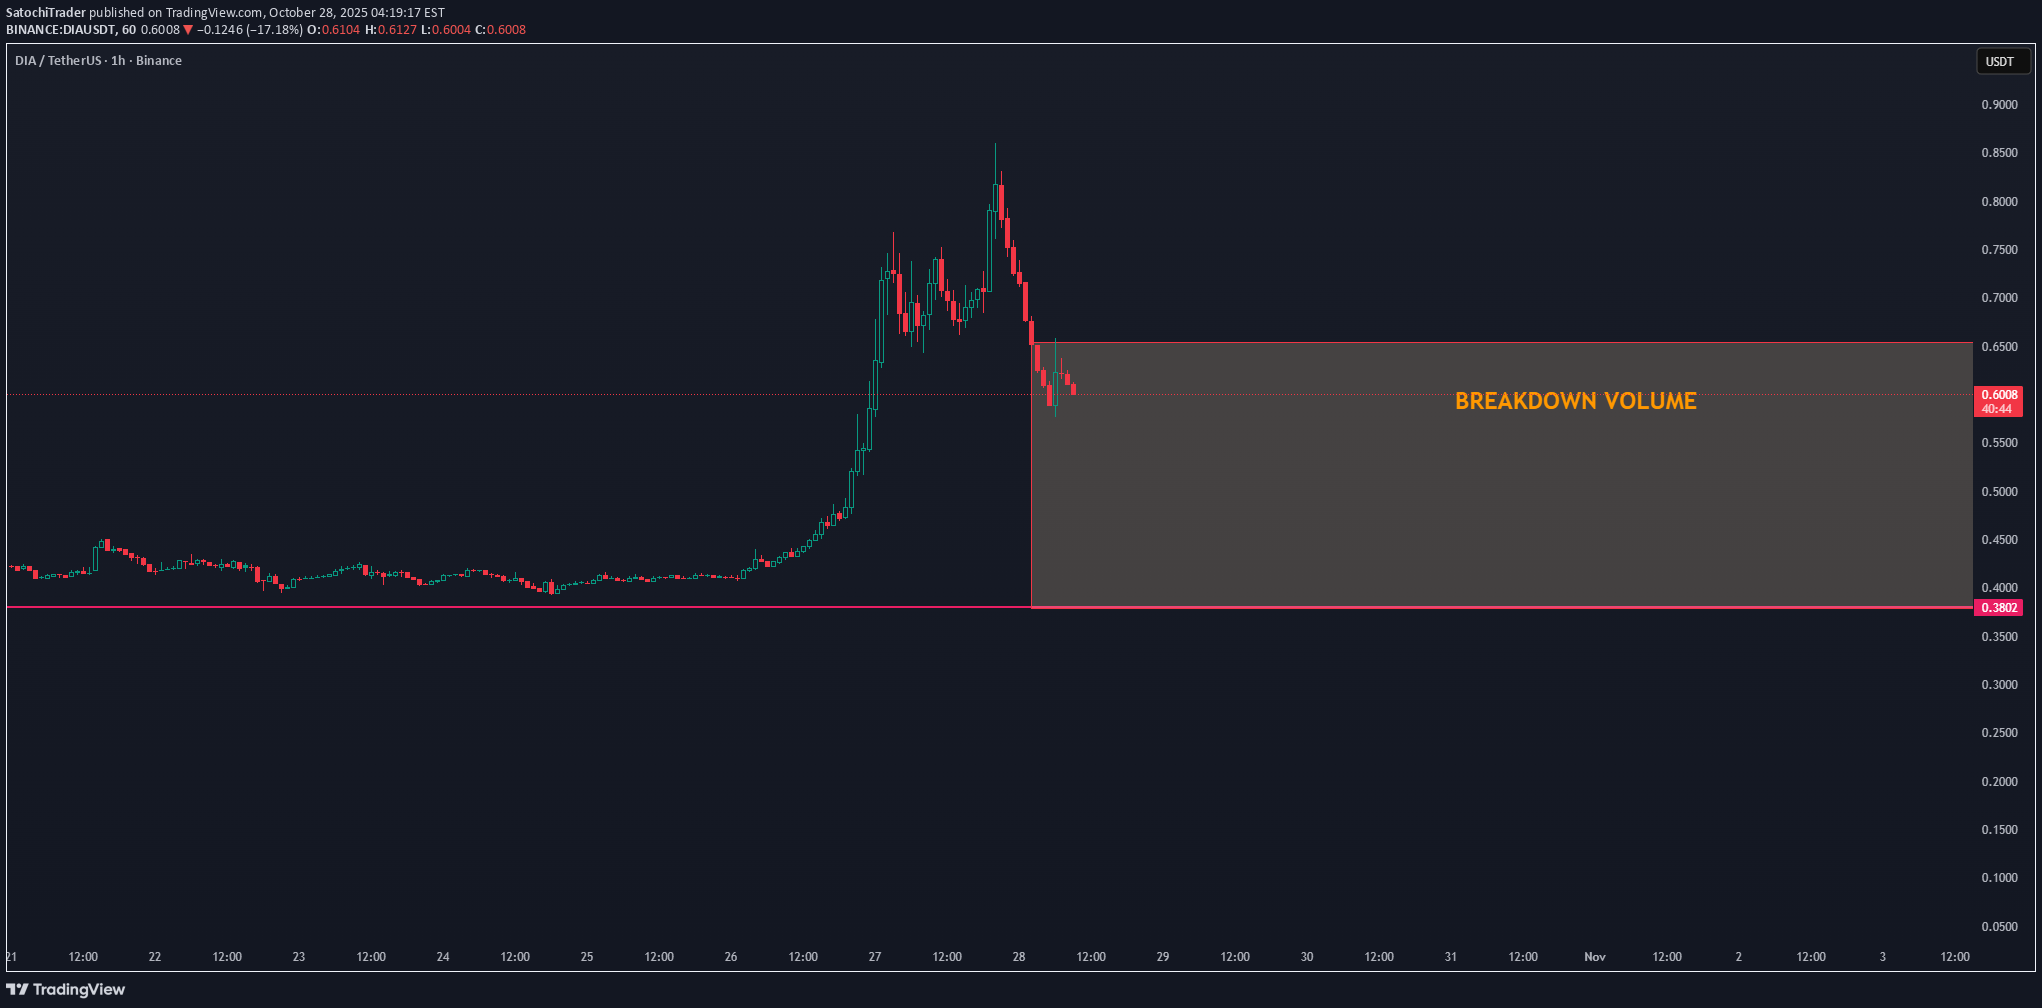
DIA has officially entered a breakdown phase after losing its key short-term structure and falling back into the breakdown volume zone. The sharp rejection from the $0.86 level triggered heavy selling pressure, confirming a shift in short-term trend momentum. 📉 Current outlook: Price is now consolidating between $0.60 – $0.38 within the breakdown range. Volume is elevated, suggesting distribution rather than accumulation. Unless DIA reclaims $0.65+, the trend remains bearish. 📊 Observation: This move resembles a post-hype correction where early buyers exit and liquidity thins out. The next key level to monitor for reaction sits near $0.38 support — a potential short-term base if selling slows down. 💬 Summary: DIA is currently trading in a breakdown trend, with risk leaning to the downside until structure rebuilds above $0.65.

DragonCaoB
خرید قوی در ارز DIA: آماده انفجار قیمت پس از تست حمایت!
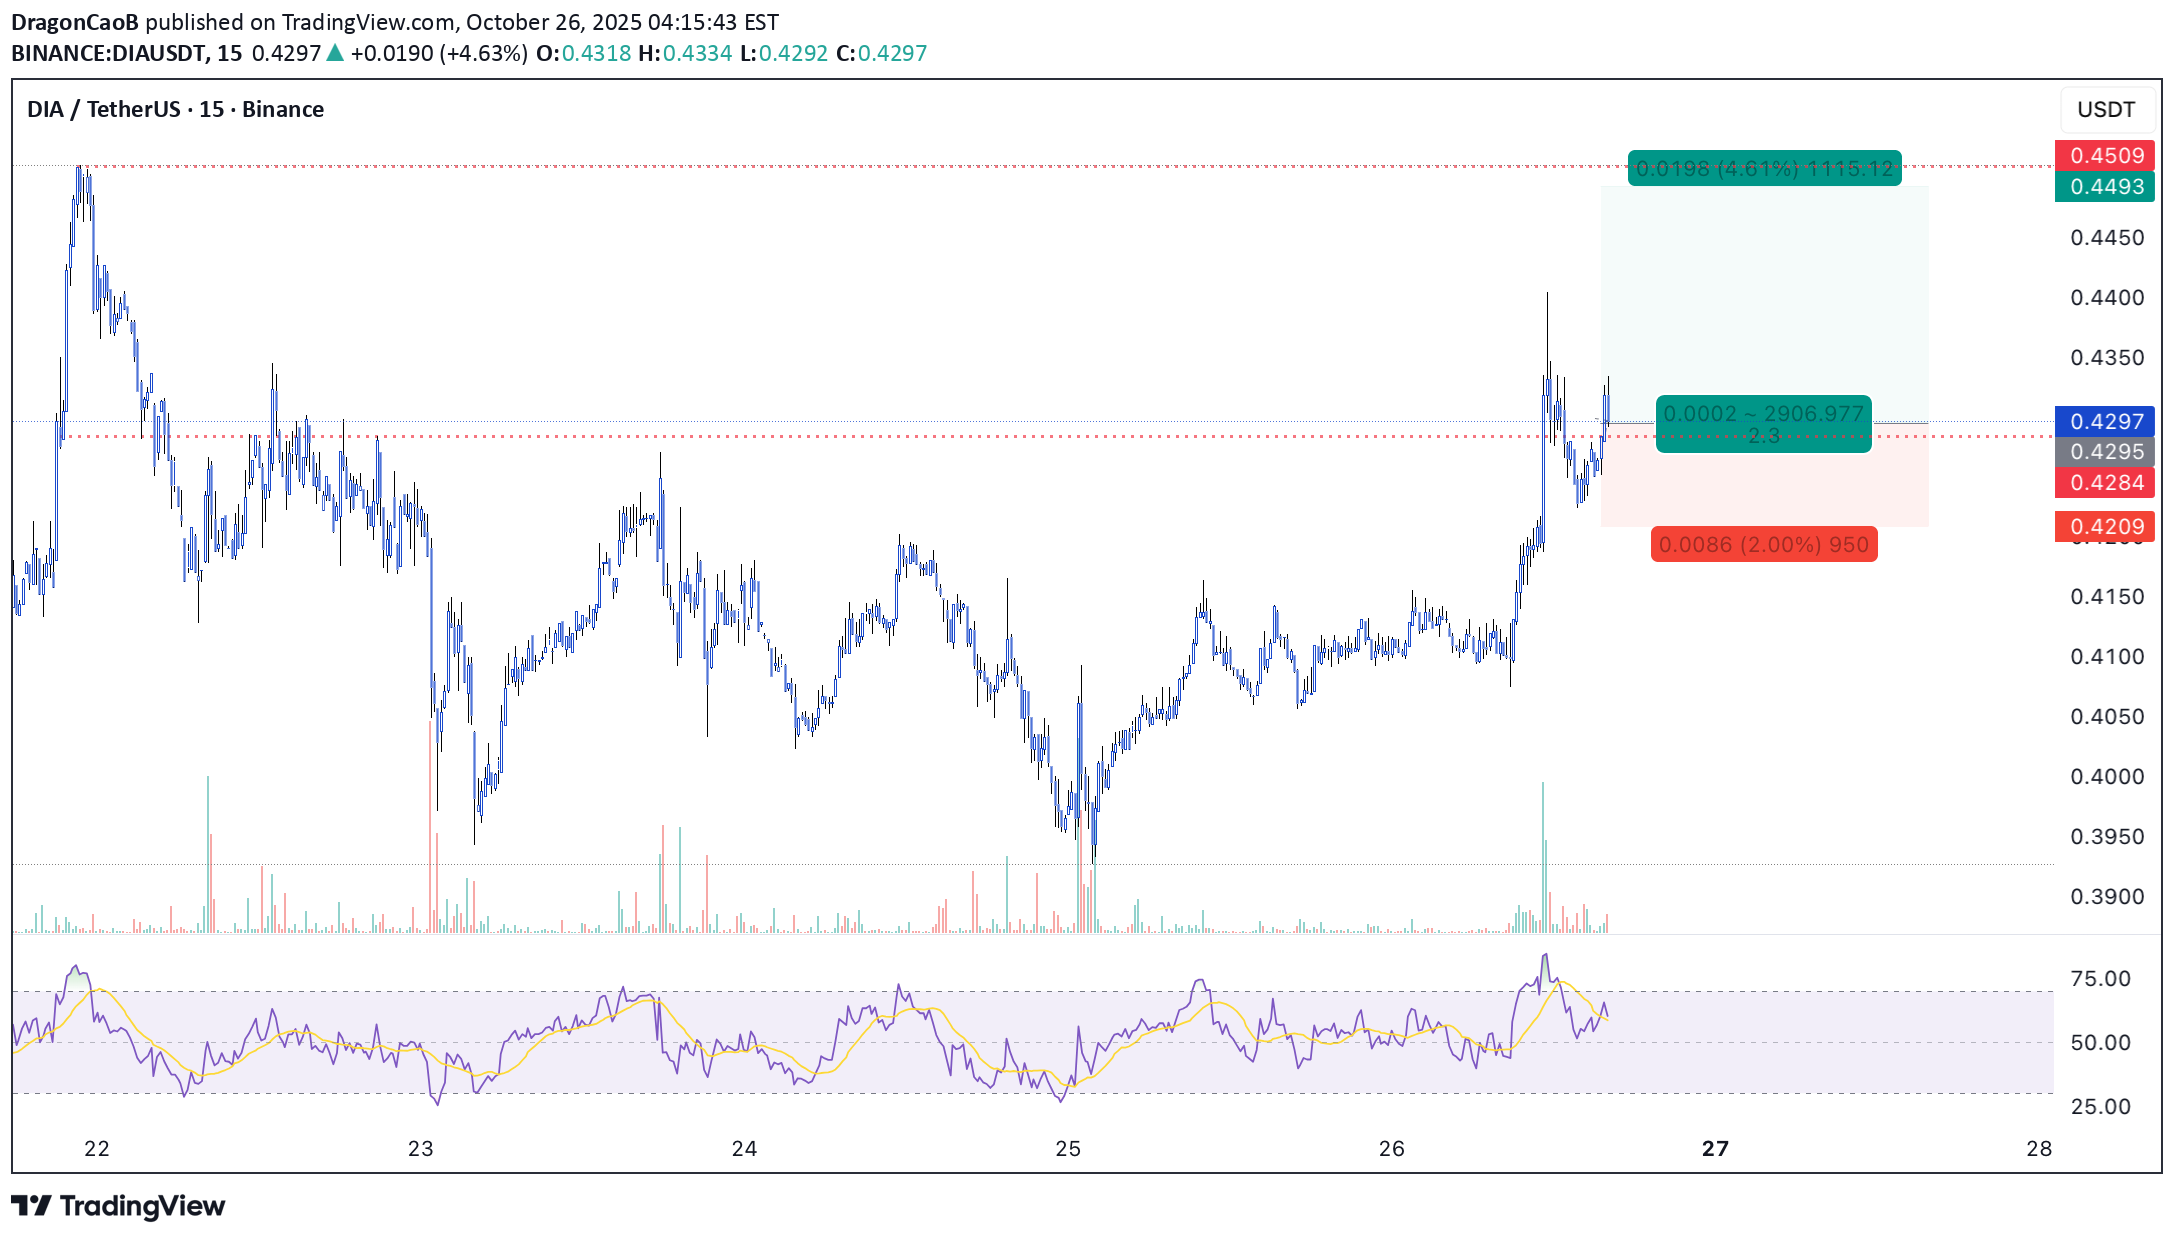
💎 Scalp Long – DIA Price has returned to the buying zone, showing clear recovery momentum. The trend is backtesting the previous high — a classic accumulation phase before a breakout. Buying volume is rising sharply, confirming strong inflow from buyers. 🎯 Plan: → Enter after price confirms support or retests the trendline. → TP: 0.4493 | SL: 0.4209 | RR: 1 : 2 Short-term structure favors the bulls. Keep positions light and risk managed. No FOMO — execute only when the setup is complete.

Raindropas
تحلیل DIA/USDT: آیا زمان اوج گرفتن فرا رسیده است؟

What are your thoughts on DIA/USDT. Is it possible we tap the .786 and break out ? I think its a high Probability that we do reverse somewhere in here heading high or just maybe we come down even further? Let me know time will tell. Good Ole Crypto Folk.

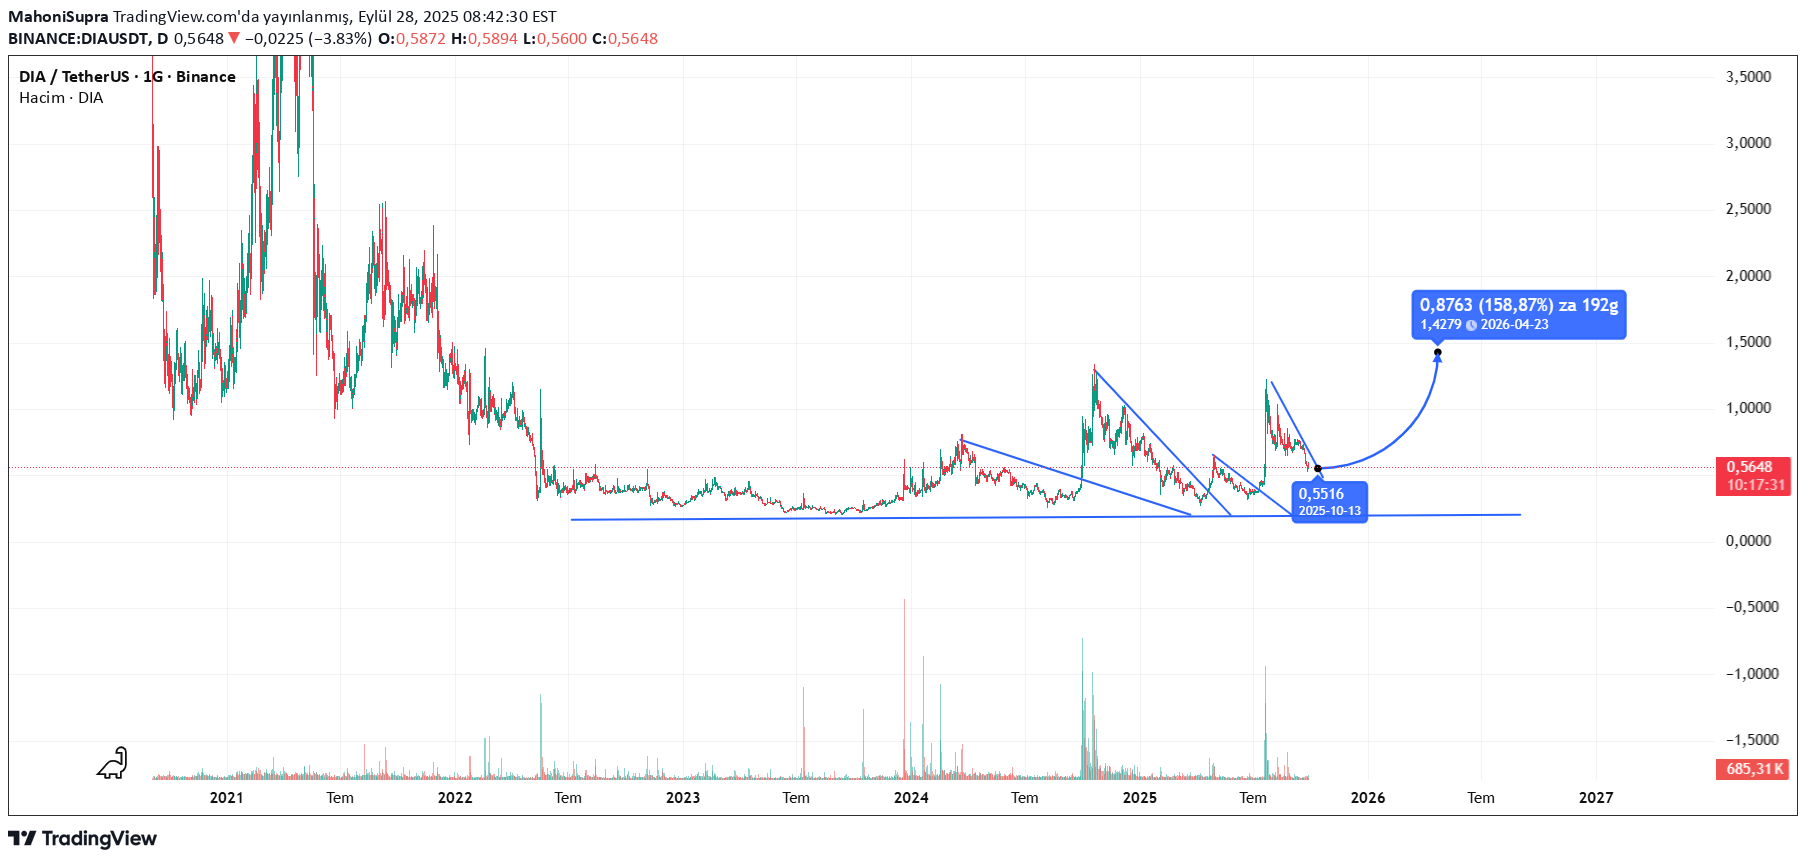
MahoniSupra
Dia Dejavu

CryptoNuclear
DIA/USDT — Golden Pocket Battle: Accumulation or Breakdown?
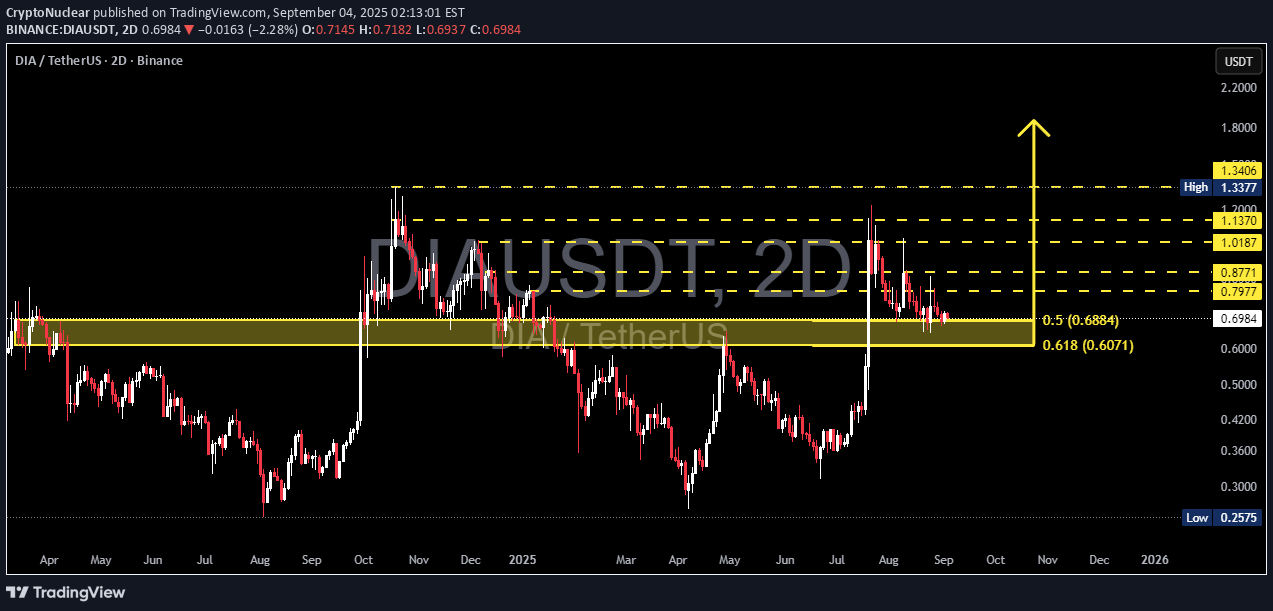
🔑 Key Highlights DIA price is currently testing the Fibonacci golden pocket (0.5–0.618) range around 0.6884 – 0.6071 USDT, a highly crucial zone that will decide whether the market resumes a bullish rally or extends the bearish trend. This area also acts as a flip level (former resistance turned potential support). If buyers defend this level, a strong bounce may follow. But if it fails, the downside risk increases significantly. --- 📌 Structure & Technical Context Major Support (Golden Pocket): 0.6884 – 0.6071. Confluence of Fibonacci retracement and structural support. Key Resistances: 0.7977 → 0.8771 → 1.0187 → 1.1370 → 1.3377 (recent high). Candle Behavior: Multiple long wicks indicate liquidity grabs and indecision. Trend Outlook: Medium-term remains sideways-to-bearish, but momentum can shift bullish if this golden pocket holds. --- 🚀 Bullish Scenario Confirmation: 2D candle close above 0.70 with bullish reversal signals (hammer / engulfing) + increasing volume. Upside Targets: Target 1: 0.7977 (+14%). Target 2: 1.0187 (+46%). Target 3: 1.1370 – 1.3377 (+60–90%). Plan: Conservative entry near 0.68–0.70 with stop below 0.60. Use ladder take profits at each resistance level. --- ⚠️ Bearish Scenario Confirmation: 2D close below 0.6071 (golden pocket breakdown). Downside Targets: First support: 0.42 (~40% drop). Deeper support: 0.2575 (~63% drop). Plan: Short entry on confirmed breakdown + retest. Stop loss above 0.655, target 0.42 / 0.2575. --- 📈 Risk Management Notes 2D timeframe = swing trade context (weeks to months). Avoid reacting too much to small intraday candles. Wait for candle + volume confirmation. Take profits gradually and use trailing stops if resistance breaks. Always size positions according to your personal risk tolerance. --- DIA is testing the Fibonacci golden pocket (0.688–0.607), which also acts as a key flip level. This is a decisive battleground: will it turn into accumulation for a rally toward 0.7977 → 1.0187 → 1.1370, or will it break down toward 0.42 → 0.2575? 🔵 Bullish: needs a 2D close above 0.70 with strong reversal signals. Upside targets: 0.7977 → 1.0187 → 1.1370+. 🔴 Bearish: breakdown below 0.607 opens downside toward 0.42 → 0.2575. This zone is where buyers and sellers will decide the next big move. ⛔️ Not financial advice. For educational purposes only. #DIA #DIAUSDT #CryptoAnalysis #SwingTrade #Fibonacci #GoldenPocket #TechnicalAnalysis #PriceAction #Crypto

MergicNet
DIA/USDT | Ready for a Massive Upside
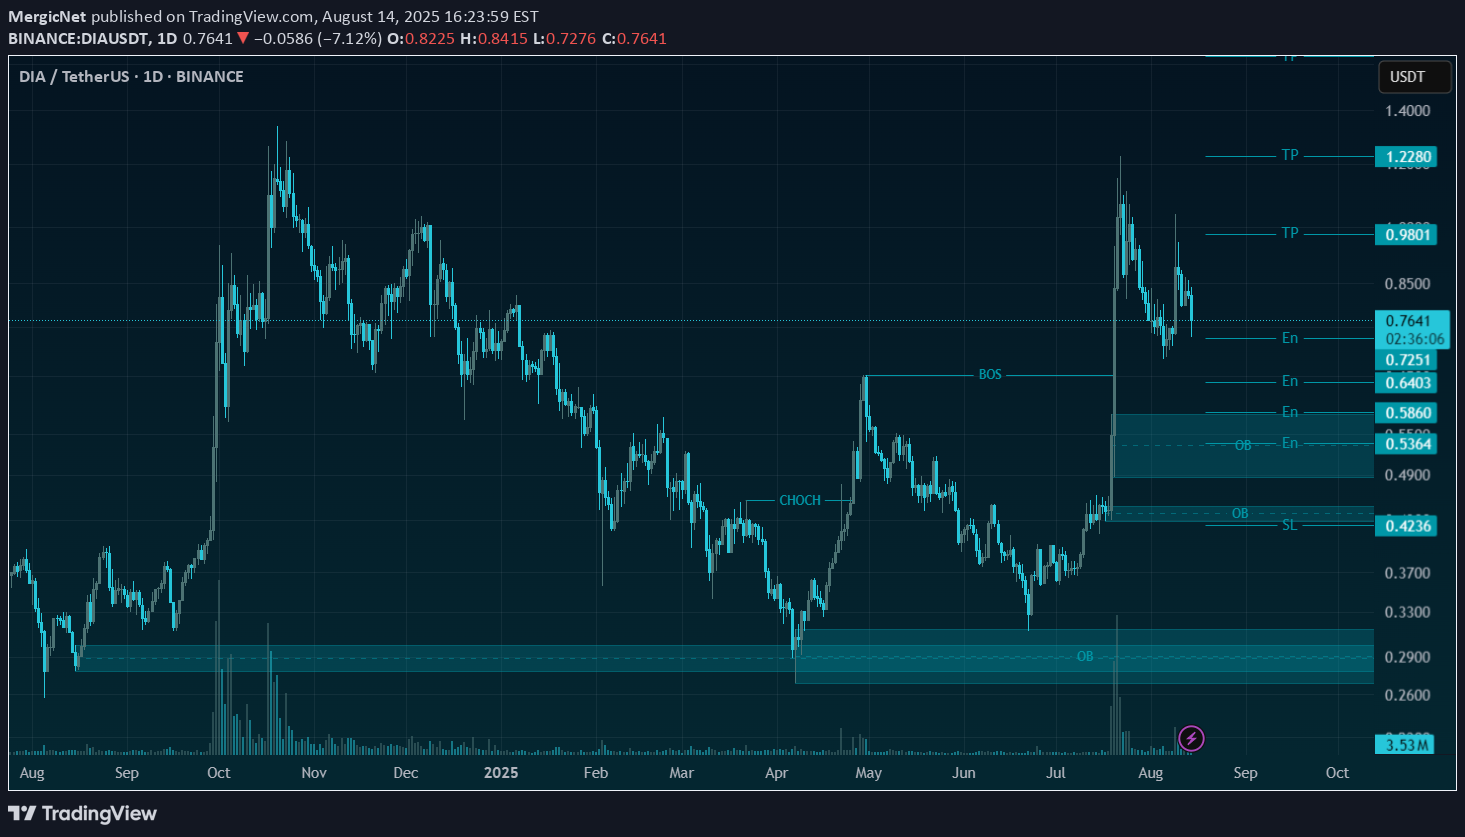
🚀 Trade Setup Details: 🕯 # DIA/USDT 🔼 Buy | Long 🔼 ⌛️ TimeFrame: 1D -------------------- 🛡 Risk Management: 🛡 If Your Account Balance: $1000 🛡 If Your Loss-Limit: 1% 🛡 Then Your Signal Margin: $32.23 -------------------- ☄️ En1: 0.7251 (Amount: $3.22) ☄️ En2: 0.6403 (Amount: $11.28) ☄️ En3: 0.586 (Amount: $14.5) ☄️ En4: 0.5364 (Amount: $3.22) -------------------- ☄️ If All Entries Are Activated, Then: ☄️ Average.En: 0.6142 ($32.23) -------------------- ☑️ TP1: 0.9801 (+59.57%) (RR:1.92) ☑️ TP2: 1.228 (+99.93%) (RR:3.22) ☑️ TP3: 1.6356 (+166.3%) (RR:5.36) ☑️ TP4: 2.3552 (+283.46%) (RR:9.14) ☑️ TP5: 3.5225 (+473.51%) (RR:15.26) ☑️ TP6: Open 🔝 -------------------- ❌ SL: 0.4236 (-31.03%) (-$10) -------------------- 💯 Maximum.Lev: 2X ⌛️ Trading Type: Swing Trading ‼️ Signal Risk: 🙂 Low-Risk! 🙂 🔎 Technical Analysis Breakdown: This technical analysis is based on Price Action, Elliott waves, SMC (Smart Money Concepts), and ICT (Inner Circle Trader) concepts. All entry points, Target Points, and Stop Losses are calculated using professional mathematical formulas. As a result, you can have an optimal trade setup based on great risk management. ⚠️ Disclaimer: Trading involves significant risk, and past performance does not guarantee future results. This analysis is for informational purposes only and should not be considered financial advice. Always conduct your research and trade responsibly. 💡 Stay Updated: Like this technical analysis? Follow me for more in-depth insights, technical setups, and market updates. Let's trade smarter together!Trade is active. Let it open other entries and then let's go for TPs. Have good trade guys.

Stoic-Trader
DIA Motive Wave
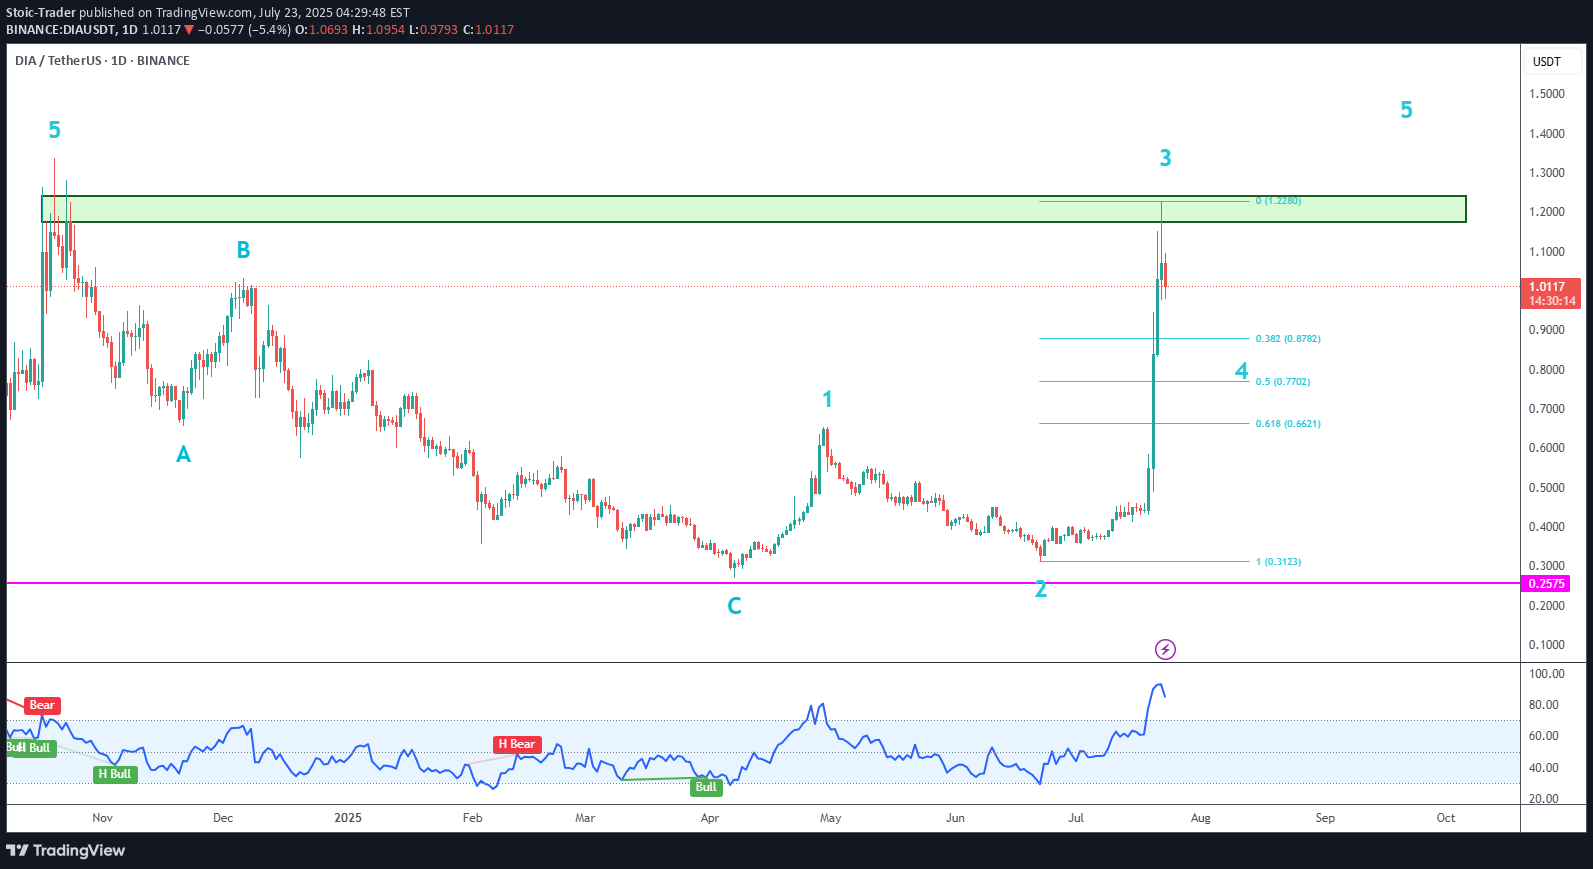
➡️ After confirming blue wave C, price is making a motive wave with sub-waves 1 and 2 complete. ➡️ Price is initially being held by the gray supply zone, which dates from October 2024. ➡️ This high could have marked the end of wave 3. Pullbacks are buying opportunities, but I prefer to see at least a 38.2% pullback for wave 4 before looking for new long trades.

Alpha-GoldFX
DIAUSDT Forming Descending Channel

DIAUSDT has recently broken out of a well-defined descending channel pattern on the weekly timeframe, signaling the start of a major bullish reversal. This breakout, accompanied by a strong surge in volume, suggests that buying momentum is entering the market decisively. The DIA token, which underpins the DIA data oracle platform, is starting to gain traction again as attention shifts toward real-world DeFi infrastructure and decentralized data solutions. Technical indicators further support the bullish thesis. After consolidating within the descending channel for several months, the breakout candle has closed above resistance with conviction, pointing to a shift in sentiment. Projections based on technical targets suggest an upside potential ranging from 140% to 150%, with the possibility of price reaching as high as $2.50 in the coming months if momentum sustains. The long accumulation phase visible on the chart strengthens the case for this extended rally. The market has also shown a renewed interest in fundamental oracles and trusted data feeds, which puts DIA back in the spotlight. As DeFi protocols evolve, the role of decentralized data becomes increasingly critical—positioning DIA to benefit from this narrative. With investor interest returning and the token breaking structure on the macro chart, DIA is now on many traders’ watchlists. ✅ Show your support by hitting the like button and ✅ Leaving a comment below! (What is You opinion about this Coin) Your feedback and engagement keep me inspired to share more insightful market analysis with

Crypto_robotics
DIA/USDT Analysis: High Probability of Correction

This asset has experienced a trend break and a breakdown of the ascending trendline. A volume cluster has formed above the current price, which triggered the current correction. If these levels are retested and met with a reaction, we consider a short position with a potential target of $0.9. Sell Zone: $1.125–$1.2 This publication is not financial advice.
Disclaimer
Any content and materials included in Sahmeto's website and official communication channels are a compilation of personal opinions and analyses and are not binding. They do not constitute any recommendation for buying, selling, entering or exiting the stock market and cryptocurrency market. Also, all news and analyses included in the website and channels are merely republished information from official and unofficial domestic and foreign sources, and it is obvious that users of the said content are responsible for following up and ensuring the authenticity and accuracy of the materials. Therefore, while disclaiming responsibility, it is declared that the responsibility for any decision-making, action, and potential profit and loss in the capital market and cryptocurrency market lies with the trader.