
DASH
Dash
| تریدر | نوع سیگنال | حد سود/ضرر | زمان انتشار | مشاهده پیام |
|---|---|---|---|---|
فروش | حد سود: تعیین نشده حد ضرر: تعیین نشده | 7 hour ago |

Price Chart of Dash
سود 3 Months :
سیگنالهای Dash
Filter
Sort messages by
Trader Type
Time Frame
سیگنال شورت DASH/USDT: فرصت فروش با اهداف سود دقیق و مدیریت ریسک حرفهای
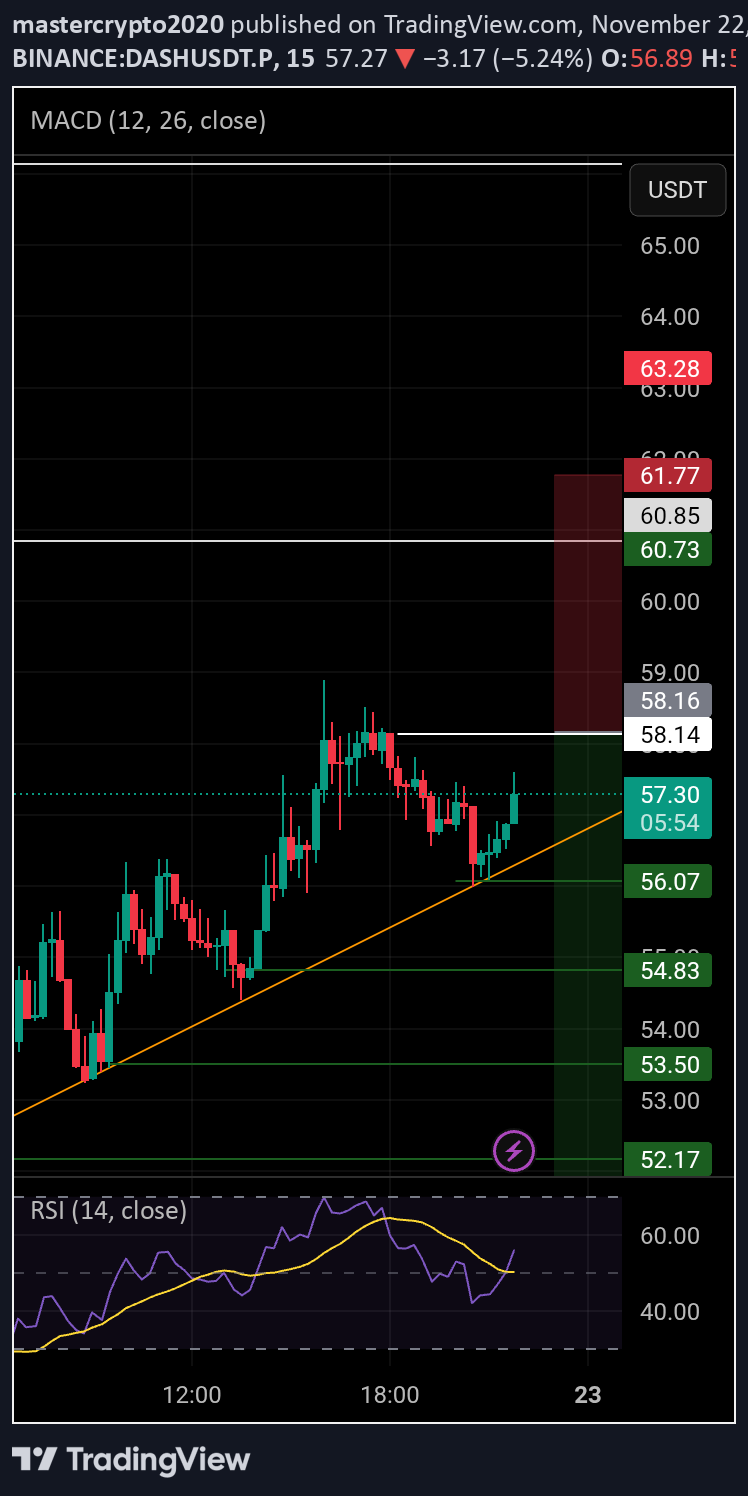
--- 📢 Official Trade Signal – DASH/USDT 📉 Position Type: SHORT 💰 Entry Zone: 56.96 – 58.15 60.88 --- 🎯 Take-Profit Targets (Partial Exits) TP1 = 56.10 TP2 = 54.83 TP3 = 53.50 TP4 = 52.17 TP5 = 50.48 TP6 = 48.40 --- 🛑 Stop-Loss: 61.90 📊 Timeframe: 15m ⚖️ Risk/Reward Ratio: 3.56 💥 Suggested Leverage: 5× – 10× --- 🧠 Technical Analysis Summary DASH is approaching a major supply zone near 57–58.20, where strong selling pressure previously emerged. Price is showing early signs of weakness, with multiple rejections confirming bearish momentum. Key bearish signals supporting this short setup: Price is forming lower highs on intraday timeframes Momentum indicators show declining buying power Breakdown signs from the short-term structure Volume divergence signaling potential trend reversal Targets align with important liquidity pockets and untested demand zones below. --- ⚙️ Trade Management Rules ✔️ Take partial profit at TP1 ✔️ Move SL to Break Even after TP1 hits ✔️ Trail SL gradually as price moves toward TP2–TP5 ✔️ Avoid re-entry if SL is triggered at 59.45 ✔️ Use proper position sizing and strict risk management --- ⚠️ Important Risk Management Note When TP1 is reached, move SL to Entry Price (Break-Even). This eliminates downside risk and locks in a safe position. ❗ If price returns and stops you out at BE, this is not a loss — it is correct and safe trade management. 🔐 The priority is always capital protection first, profits second. --- 📌 TradingView Hashtags #DASHUSDT #DASH #CryptoSignal #ShortSetup #TradingView #TechnicalAnalysis #FuturesTrading #Altcoins ---
سیگنال فروش فوری بیت کوین کش (DASH/USDT): ورود به موقعیت شورت با اهداف جذاب و مدیریت ریسک دقیق!

--- 📢 Official Trade Signal – DASH/USDT 📉 Position Type: SHORT 💰 Entry Zone: 56.96 – 58.15 --- 🎯 Take-Profit Targets (Partial Exits) TP1 = 56.10 TP2 = 54.83 TP3 = 53.50 TP4 = 52.17 TP5 = 50.48 TP6 = 48.40 --- 🛑 Stop-Loss: 59.45 📊 Timeframe: 15m ⚖️ Risk/Reward Ratio: 3.56 💥 Suggested Leverage: 5× – 10× --- 🧠 Technical Analysis Summary DASH is approaching a major supply zone near 57–58.20, where strong selling pressure previously emerged. Price is showing early signs of weakness, with multiple rejections confirming bearish momentum. Key bearish signals supporting this short setup: Price is forming lower highs on intraday timeframes Momentum indicators show declining buying power Breakdown signs from the short-term structure Volume divergence signaling potential trend reversal Targets align with important liquidity pockets and untested demand zones below. --- ⚙️ Trade Management Rules ✔️ Take partial profit at TP1 ✔️ Move SL to Break Even after TP1 hits ✔️ Trail SL gradually as price moves toward TP2–TP5 ✔️ Avoid re-entry if SL is triggered at 59.45 ✔️ Use proper position sizing and strict risk management --- ⚠️ Important Risk Management Note When TP1 is reached, move SL to Entry Price (Break-Even). This eliminates downside risk and locks in a safe position. ❗ If price returns and stops you out at BE, this is not a loss — it is correct and safe trade management. 🔐 The priority is always capital protection first, profits second. --- 📌 TradingView Hashtags #DASHUSDT #DASH #CryptoSignal #ShortSetup #TradingView #TechnicalAnalysis #FuturesTrading #Altcoins ---

c_views
احتمال انفجار قیمت دش (DASH): چه زمانی به مرز ۸۵ دلار میرسیم؟
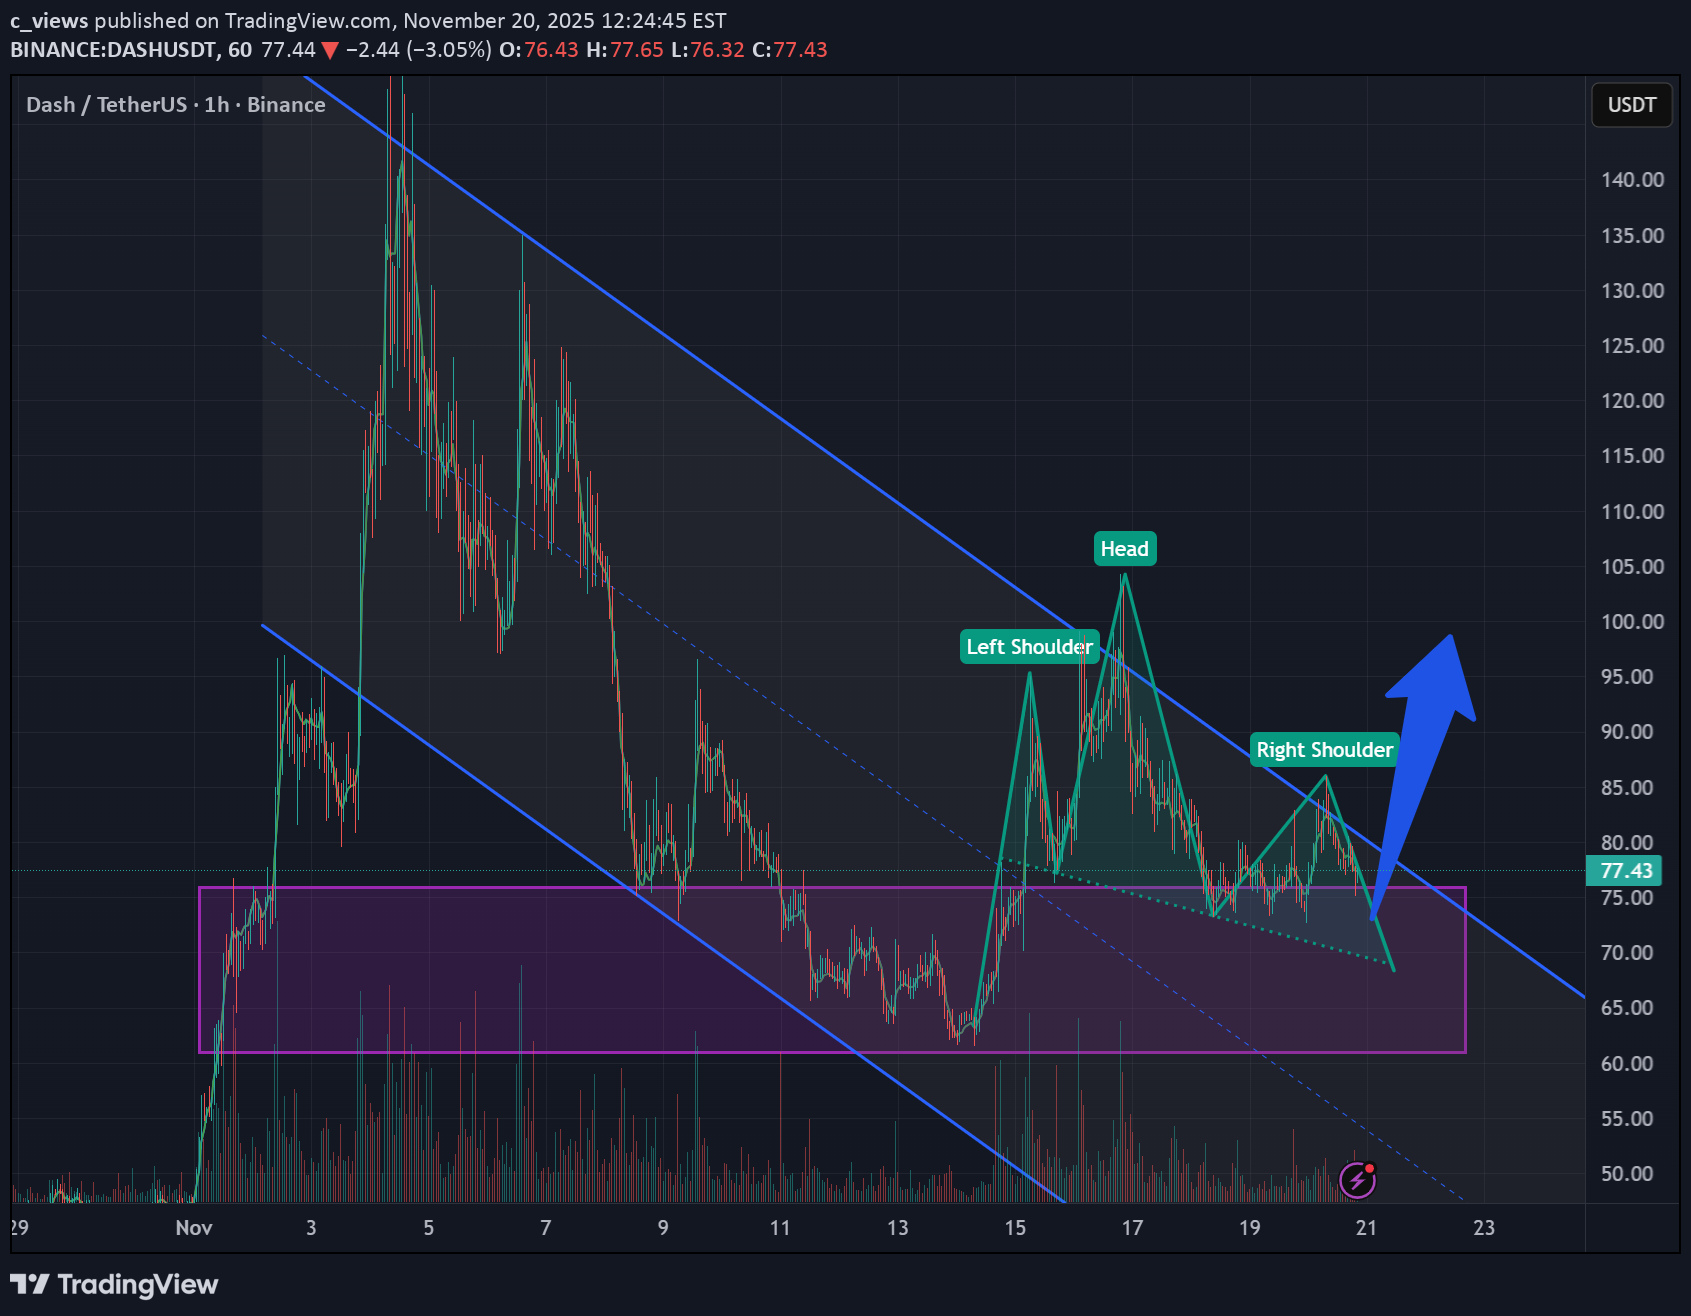
It's highly likely that DASH will break out of its accumulation zone A typical pattern has formed on the chart Declining within the channel – forming a bullish formation (pGIP in this case) – transition to growth A locally developed Head and Shoulders pattern, which is usually followed by growth Dash is also in the anonymous coin narrative, which is currently performing well... Current price: $76 Based on the above, it's highly likely that the price could reach $85 and above... If the price breaks below the purple area shown in the chart and consolidates, a downward movement is likely
سیگنال خرید (لانگ) فوری DASH/USDT: نقطه ورود و اهداف سود با اهرم پیشنهادی!
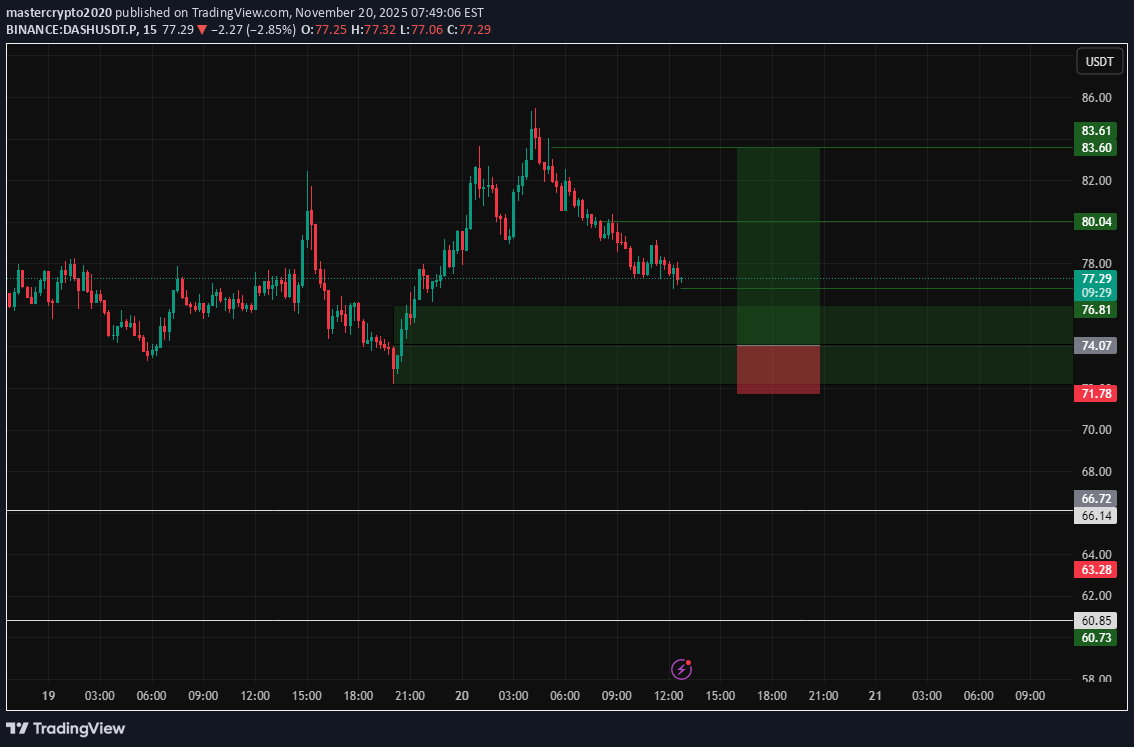
Sir📢 Signal 🔹:DASh.USDT 📉 Trade Type:long 💰 Entry Point:. 74 🎯 Targets (with withdrawal management): ▫️ TP1=74.85 ▫️ TP2=80 ▫️ TP3 =83.60 TP4= TP5= TP6= 🛑 Stop Loss= 71.70 📊 Time Frame: ⚖️ R/R:4.17 📌 Recommended Leverage:.5 or 10 ⚠️ Money Management Required Please login after checking the chart

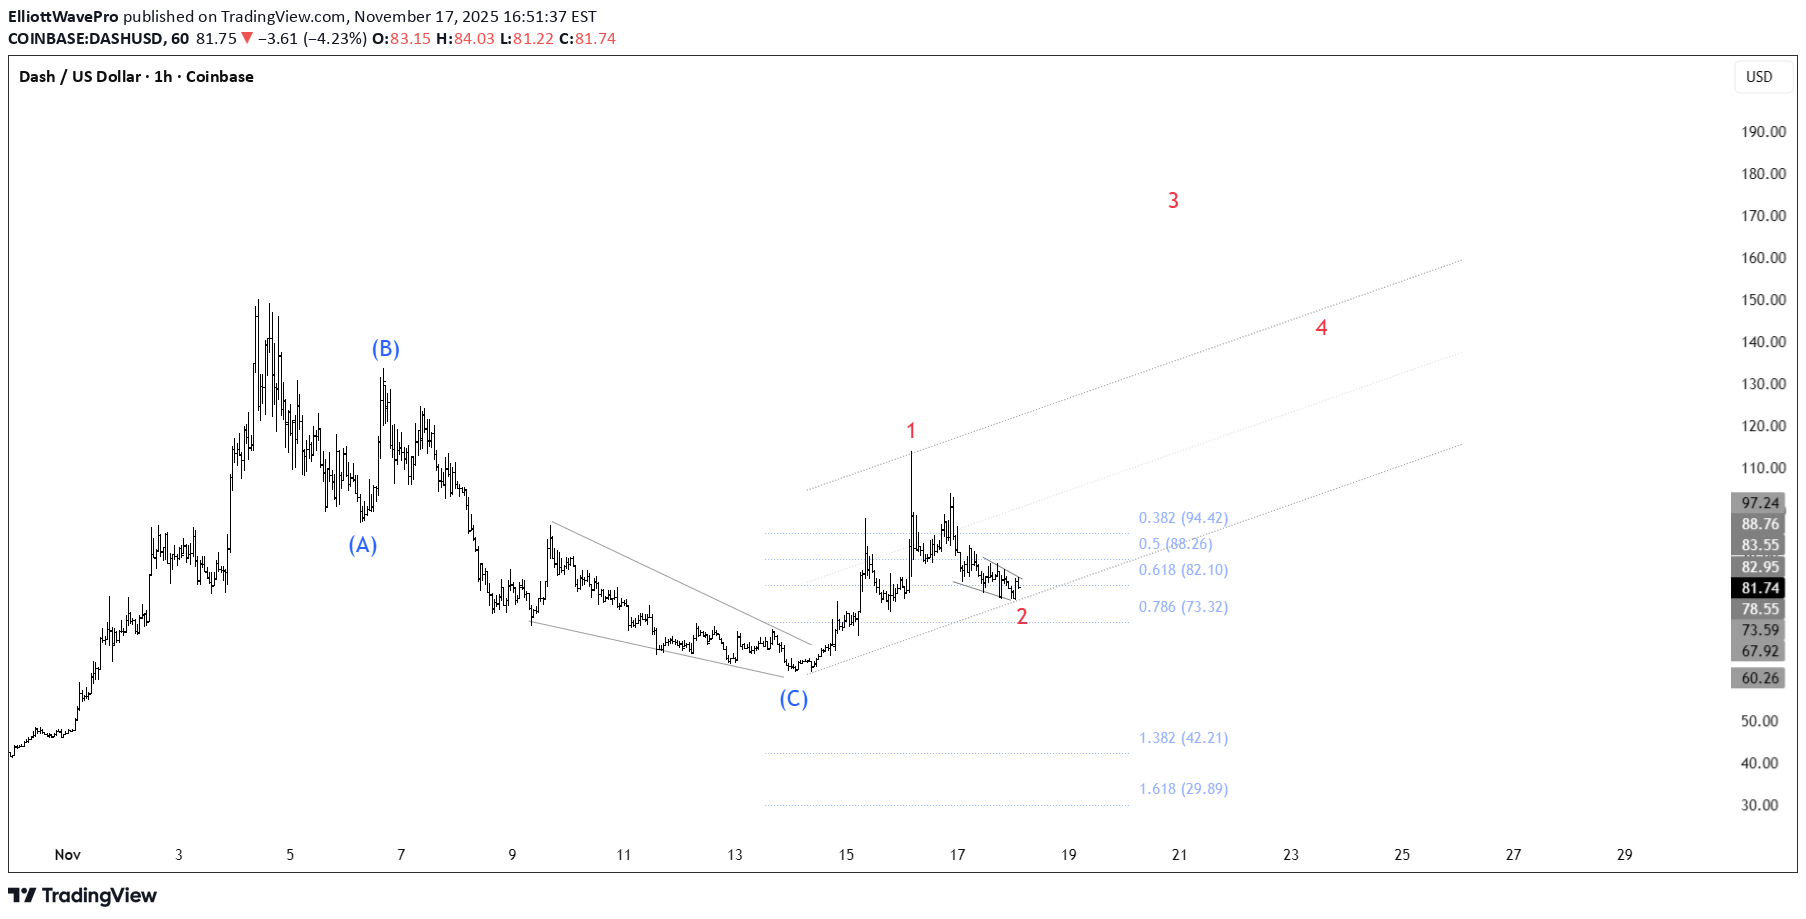
دش (DASH) در آستانه انفجار قیمتی: مسیر صعودی تا ۱۸۰ دلار با حمایت کلیدی ۷۰ دلار!
The corrective structure of Wave (2) is still intact and price is holding inside the major demand zone between $72–$76. As long as DASH stays above $70, the bullish Elliott structure remains valid. Price is consolidating right on top of the support box, which is exactly where Wave (3) typically begins its expansion phase. 🔹 Primary Targets (Wave 3): $105 – $116 (Fib 0.5 / 0.618) $131 – $140 (Fib 0.786 / 0.886) 🔹 Extended Targets (Wave 5): $168 – $180 $230+ if the full impulsive cycle plays out ⚠️ Invalidation: A clean break below $70 invalidates the bullish count and delays the impulse.

julia17
تحلیل تکنیکال DASH/USD: دو هدف صعودی بزرگ منتظر دَش!

Dash has completed a bullish shark and has tested a broken triangle from above. There are 2 next targets - 200 and 310.
DASH در آستانه انفجار: فرصت طلایی خرید در سطح فیبوناچی 61.8!
This could be an amazing opportunity. Resting well at 61.8 fib level, next is a wave 3 advance.Did not go as planned. Stopped out!
اخطار بزرگ: دَش (DASH) در شرف انفجار قیمتی است!

This could be an amazing opportunity. Resting well at 61.8 fib level, next is a wave 3 advance.

jcraider
آینده دَش (DASH): سقوط به ناحیه سفارش یا شروع صعود دوباره؟

DASH - 4HR finishes an ABC after a nice Elliott wave. May continue down to the Order Block or sideways for some accumulation.Waiting and looking for the next Pivot

tradecitypro
DASH/USDT: آیا روند صعودی ادامه دارد؟ تحلیل کلیدی ورود و خروج!
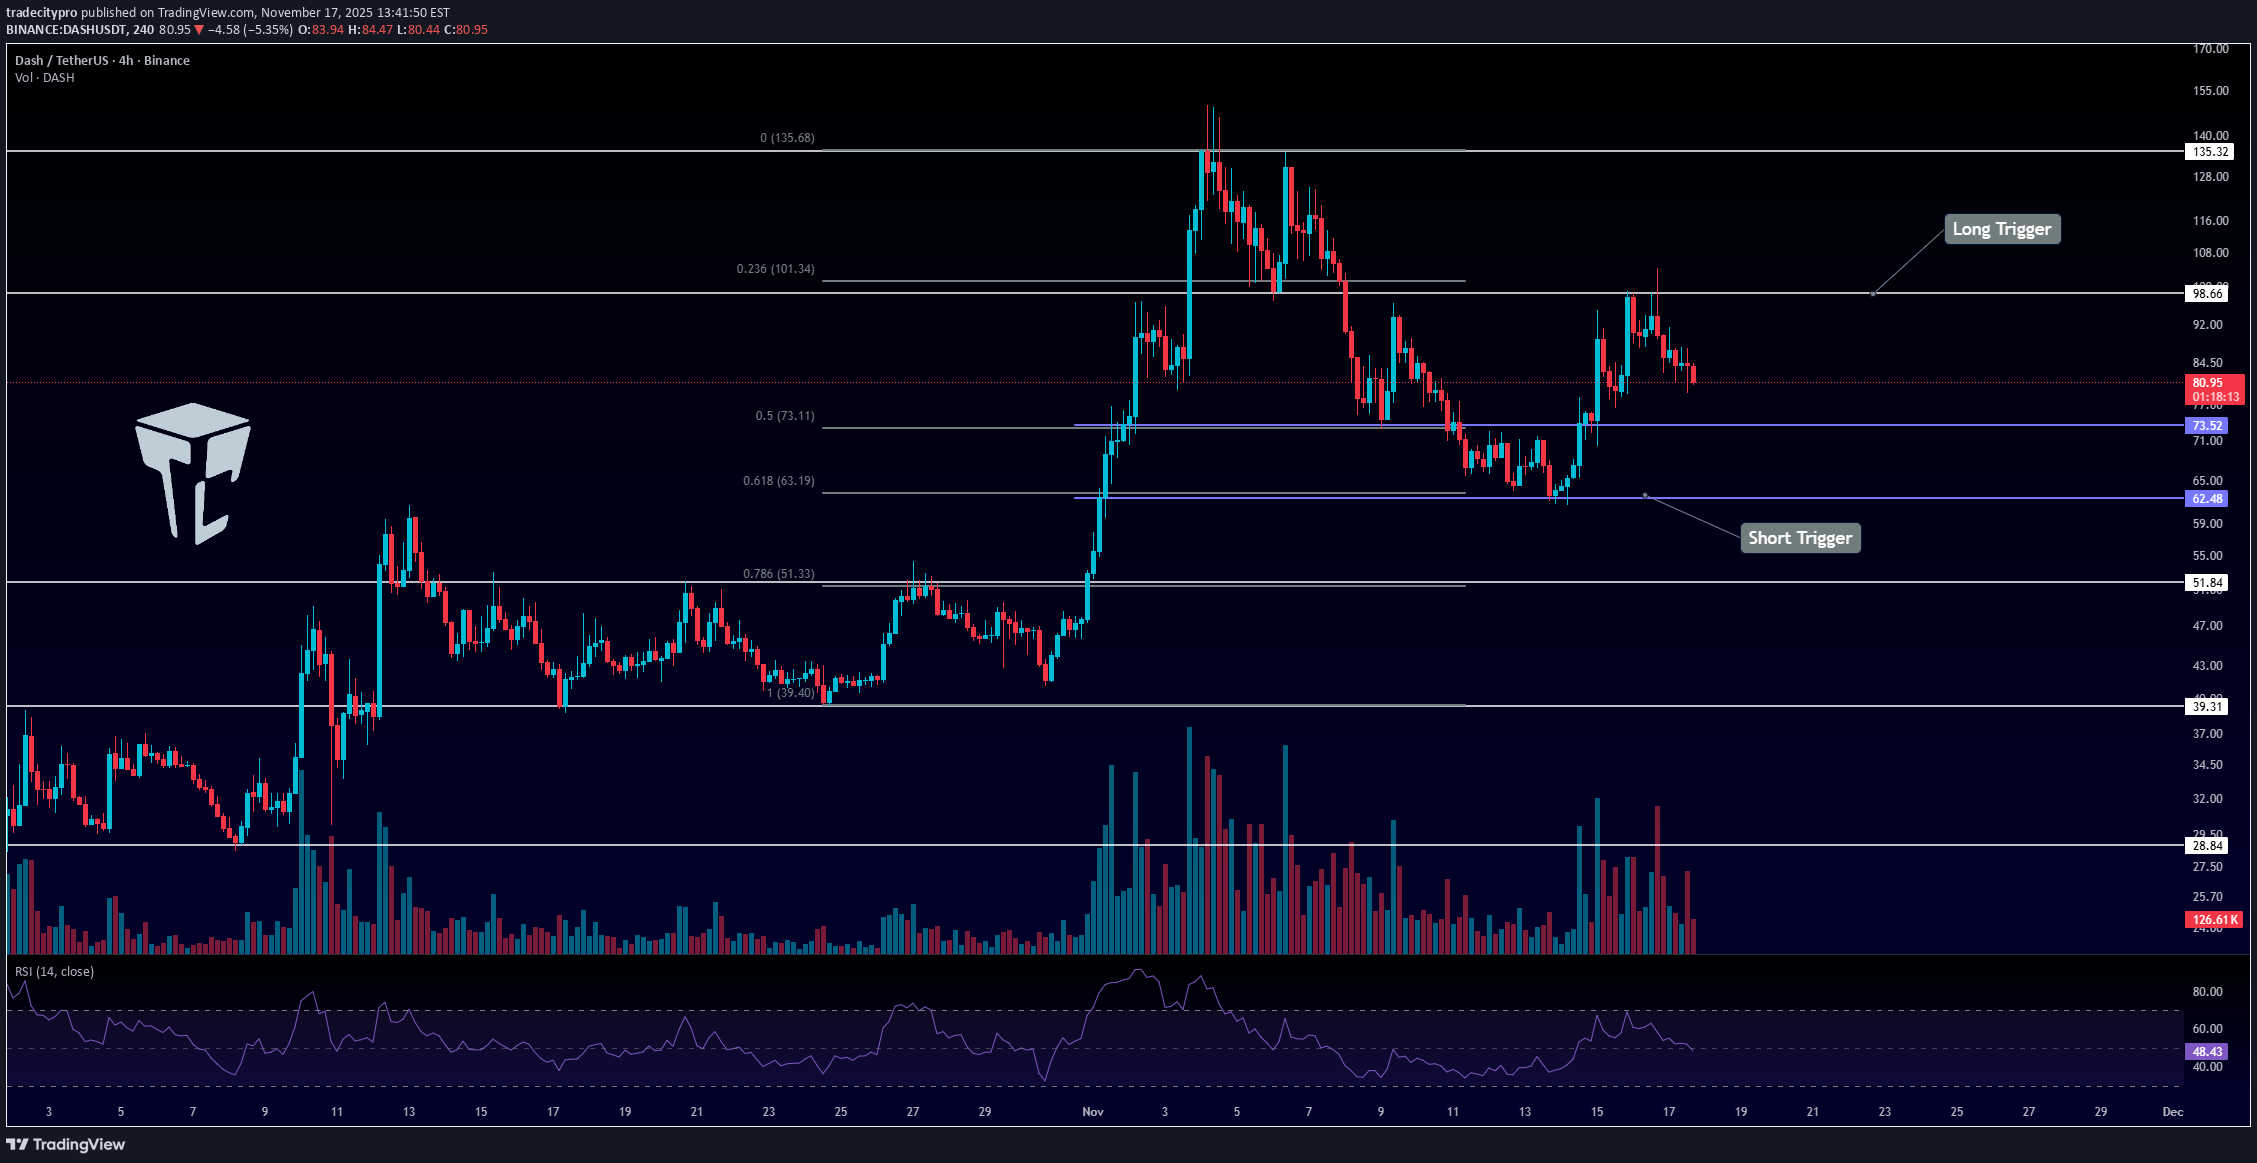
👋 Welcome to TradeCityPro! Let’s take a look at the DASH chart — one of the well-known privacy coins in the crypto market. Ever since XMR started its bullish trend, DASH has also shown strong upward movement. 🌐 Overview of Bitcoin Before starting the analysis, let me remind you once again that we’ve moved the Bitcoin analysis section to a dedicated daily report at your request — allowing us to discuss Bitcoin’s trend, dominance, and overall market sentiment in greater detail each day. In the 4-hour timeframe, after bouncing from the 28.84 support, price experienced a sharp upward move and then formed a new consolidation box. After forming a higher low inside the box, the breakout of 51.84 triggered a strong bullish rally, pushing the price all the way to the 135.32 resistance, where it faced rejection. From that resistance, price began a corrective move and retraced down to the 0.618 Fibonacci level, where it found support again. At the moment, for a long position, we can consider entering after the breakout of 98.66, especially since the previous trend structure still favors bullish continuation. For a short position, there isn’t much room to operate right now. The overall trend is still bullish, and a true trend reversal would only become valid if the price breaks below 62.48. 📝 Final Thoughts Stay calm, trade wisely, and let's capture the market's best opportunities! This analysis reflects our opinions and is not financial advice.
Disclaimer
Any content and materials included in Sahmeto's website and official communication channels are a compilation of personal opinions and analyses and are not binding. They do not constitute any recommendation for buying, selling, entering or exiting the stock market and cryptocurrency market. Also, all news and analyses included in the website and channels are merely republished information from official and unofficial domestic and foreign sources, and it is obvious that users of the said content are responsible for following up and ensuring the authenticity and accuracy of the materials. Therefore, while disclaiming responsibility, it is declared that the responsibility for any decision-making, action, and potential profit and loss in the capital market and cryptocurrency market lies with the trader.