
ElliottWavePro
@t_ElliottWavePro

What symbols does the trader recommend buying?
Purchase History
پیام های تریدر
Filter
ElliottWavePro
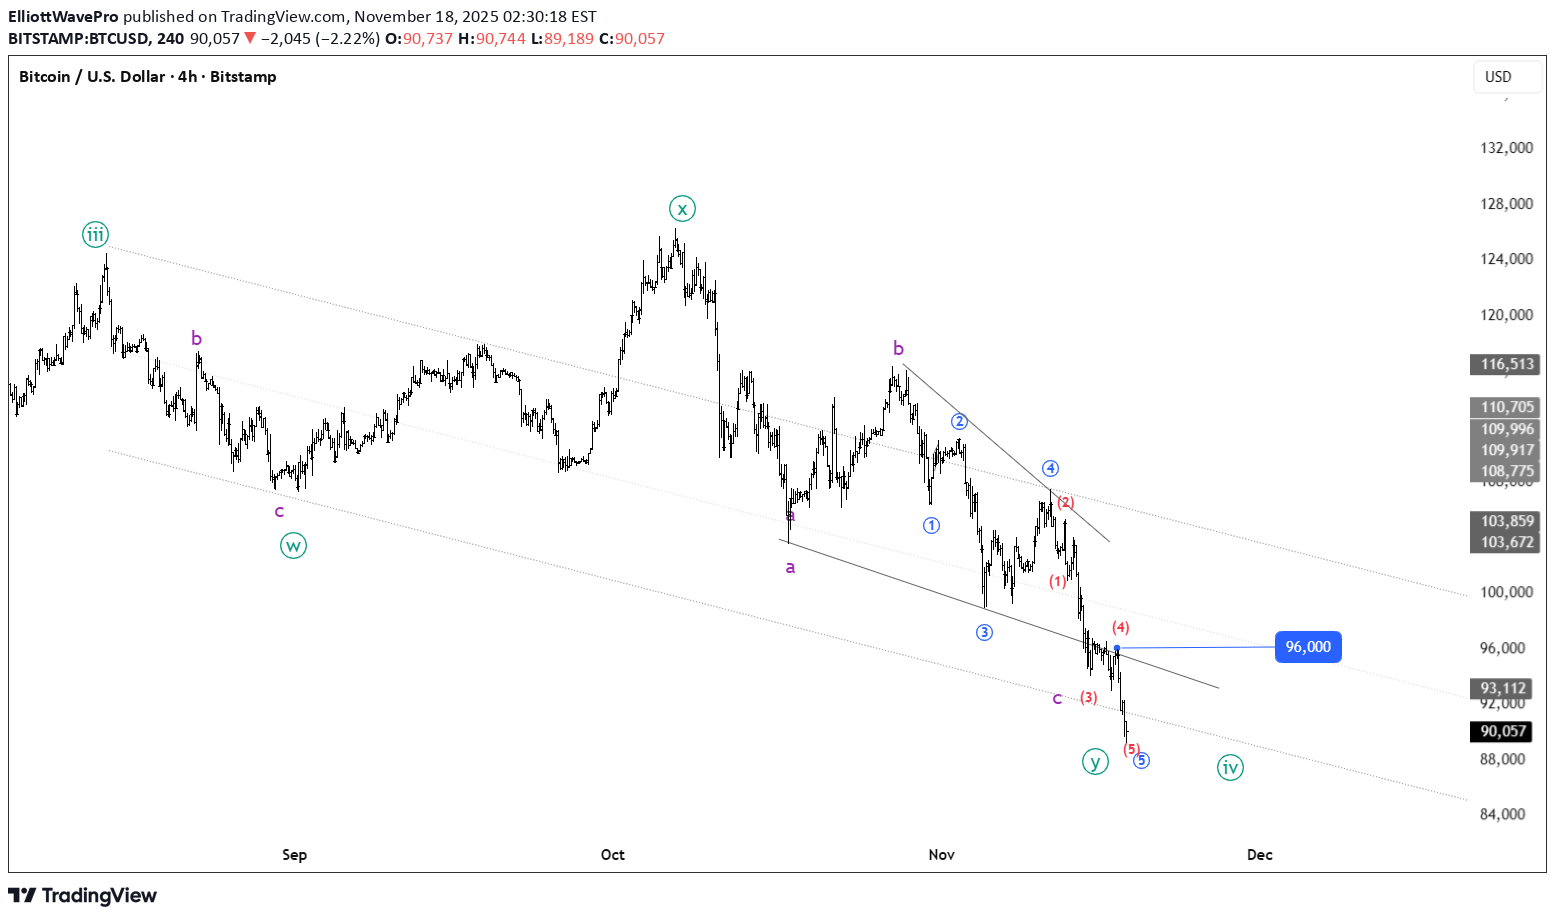
بیت کوین در آستانه انفجار صعودی: نقشه راه موج الیوت تا ۱۰۰,۰۰۰ دلار!
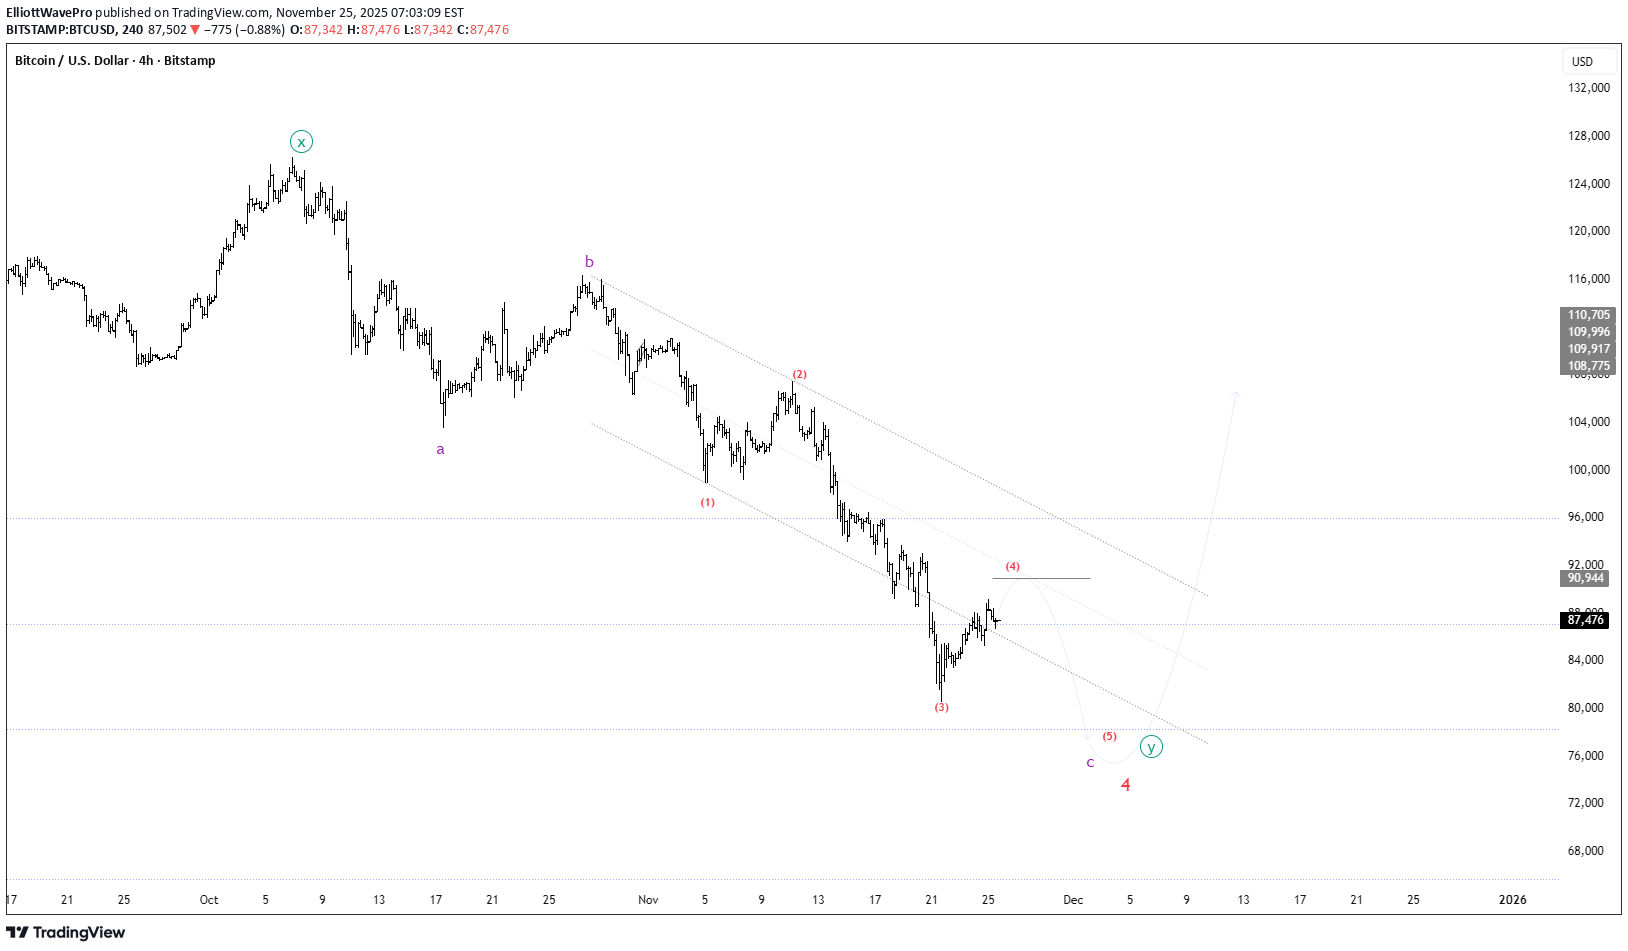
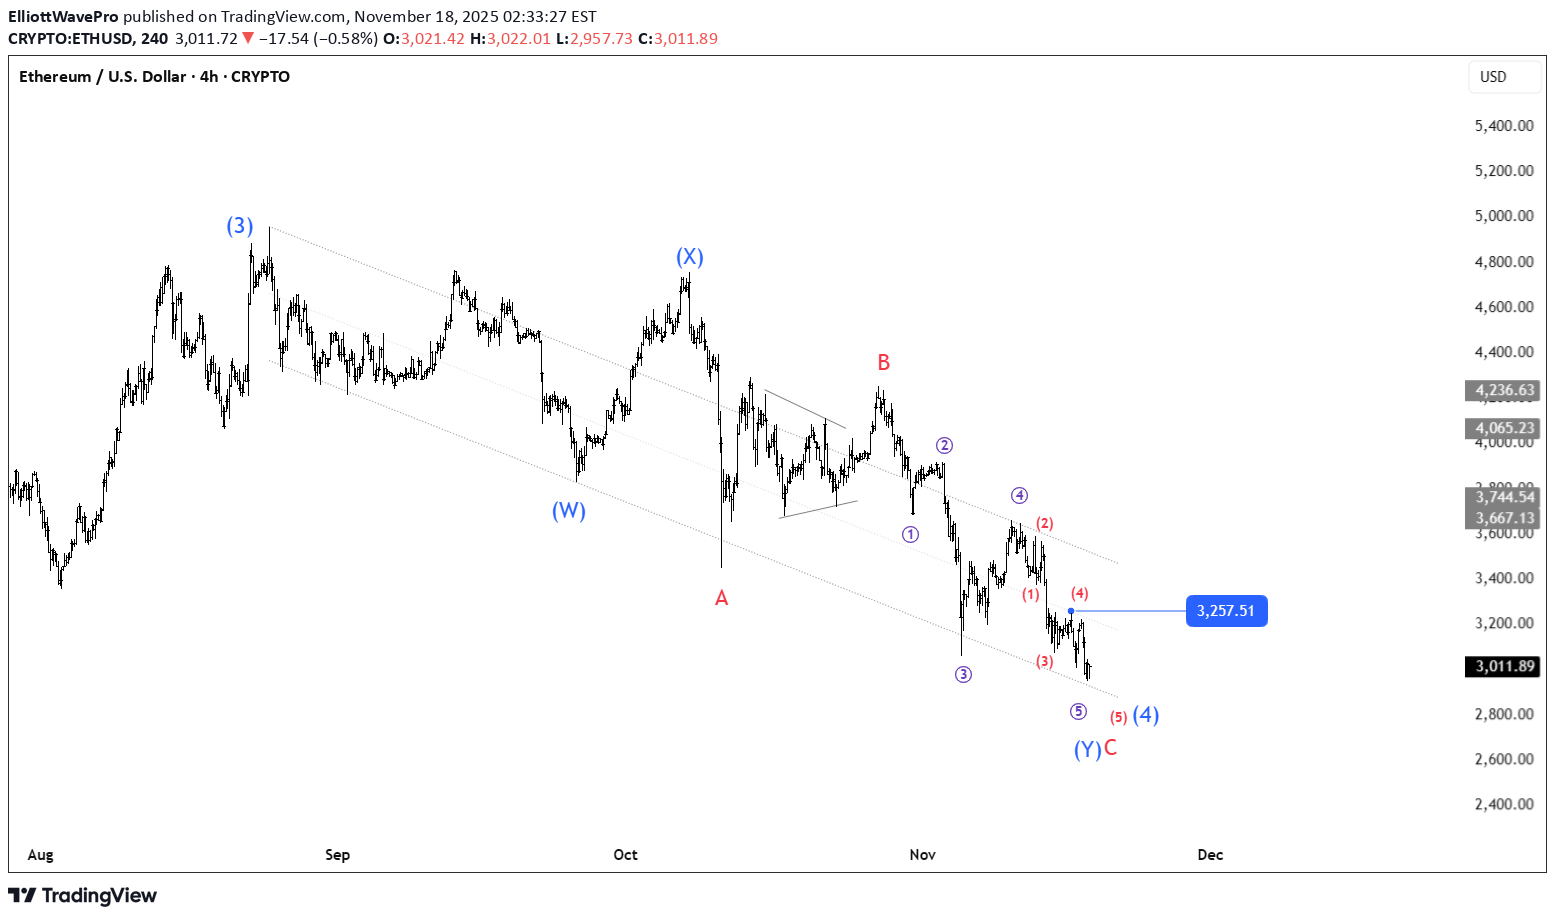
BTC – Elliott Wave Roadmap (4H Chart) Still tracking a higher-degree Wave 4 completion before the macro trend resumes upward. Structure is behaving exactly as a textbook corrective. 🧩 What the chart shows: 🔻 Wave (1) & (2) already completed • Strong impulsive (1) • Shallow corrective (2) inside the channel 🔻 Wave (3) extended: • Deep, high-momentum decline • Clean sub-waves inside the downward channel 🔵 Wave (4) bounce currently unfolding: • Reaction up from the (3) low • Expected to remain below channel resistance • Most likely forming a zigzag or flat before final drop 🔻 Wave (5) down still pending: • Should take price into the C/4 completion zone • Likely near the lower channel + horizontal support cluster 🟢 After Wave 4 completes: • Expect a major trend reversal up • First target = break out of the channel • Mid-term goal = region around the previous X high 📌 Summary: BTC is preparing a Wave (4) corrective bounce → final (5) dip → major upside leg.
ElliottWavePro
لینک (LINK) در آستانه انفجار بزرگ؟ تحلیل موجی که سیگنال خرید را مشخص میکند!
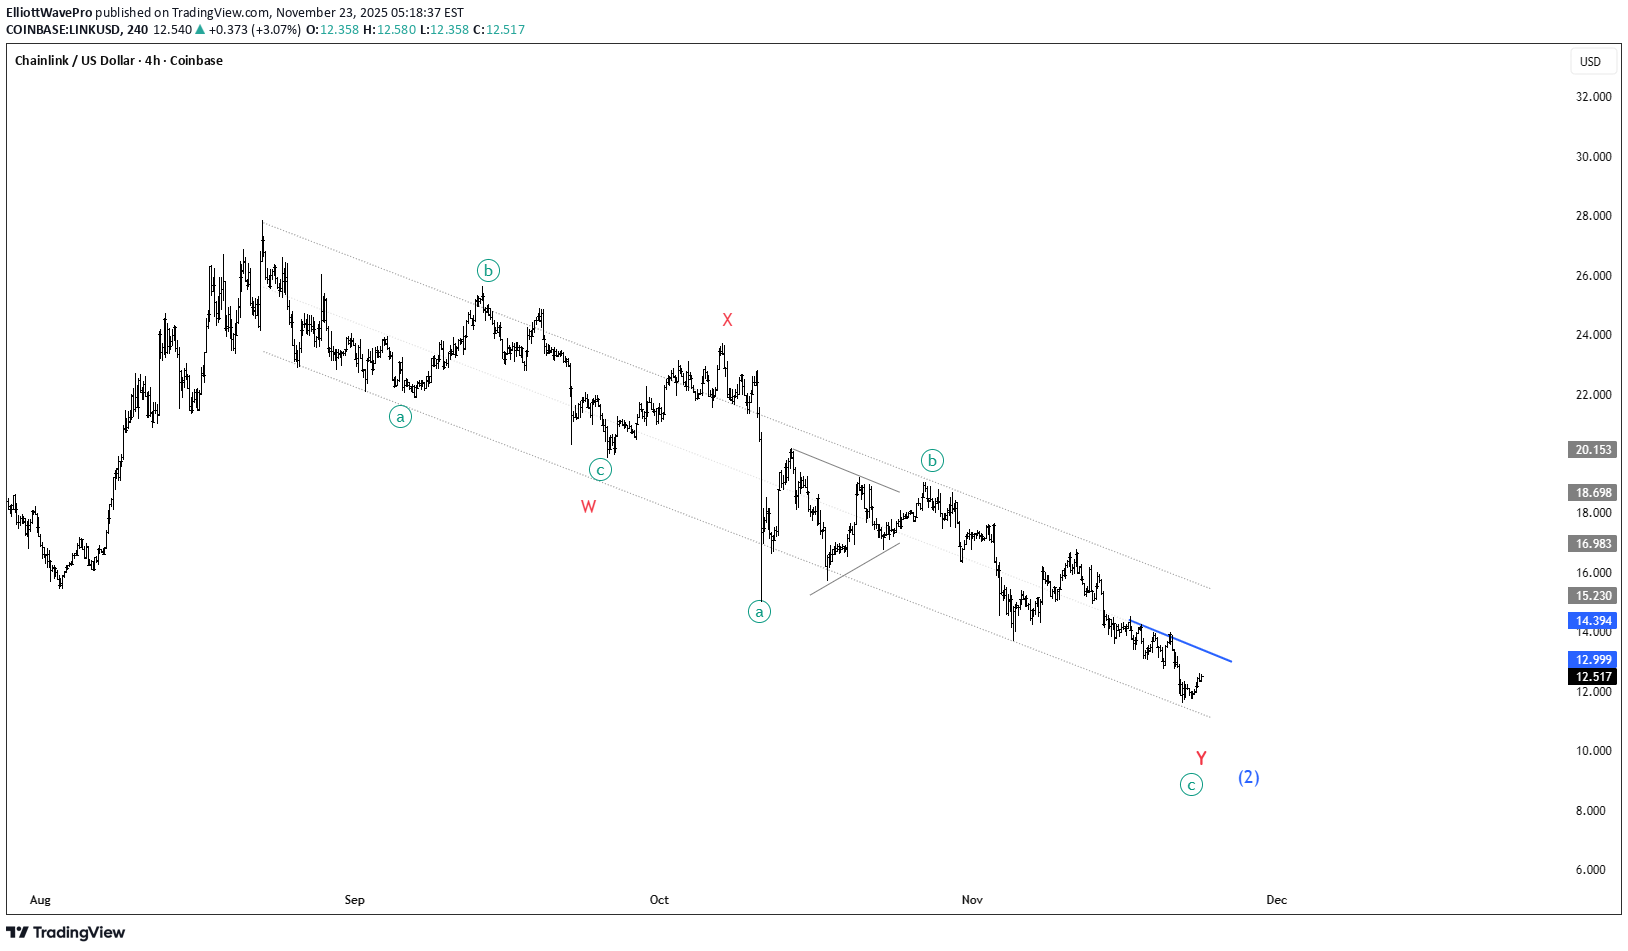
🔗 LINK – Elliott Wave Breakdown (4H Chart) Current structure still fits a W–X–Y corrective decline, but we’re now approaching a critical trigger level. A clean punch through the blue trendline = buy signal. 🎯 🟦 What the structure shows: 🔻 Wave W complete: • Clear a–b–c zigzag • Strong reaction into the X connector 🔷 Wave X at the mid-channel zone: • Acts as the next major upside target if we break out • Provides structural symmetry between W and Y 🔻 Wave Y in progress: • Again forming a–b–c • C-leg looks terminal, aligning with channel support 📉 Price is compressing under the descending blue trendline (b-wave resistance of Y) 🚀 Trade trigger: A decisive breakout above the blue trendline = start of the next impulsive leg Upside target: the region around the prior X high That zone is both: • 🔹 Structural retracement • 🔹 Upper channel magnet • 🔹 Ideal first take-profit region 📌 Summary: Break the blue line ➜ bullish confirmation ➜ target = X-level. Still corrective, but the next impulse is close. ⚡
ElliottWavePro
سقوط آزاد آیرودروم (AERO): پایان بازی و رسیدن به کف قیمتی ۰.۴۱ دلار!
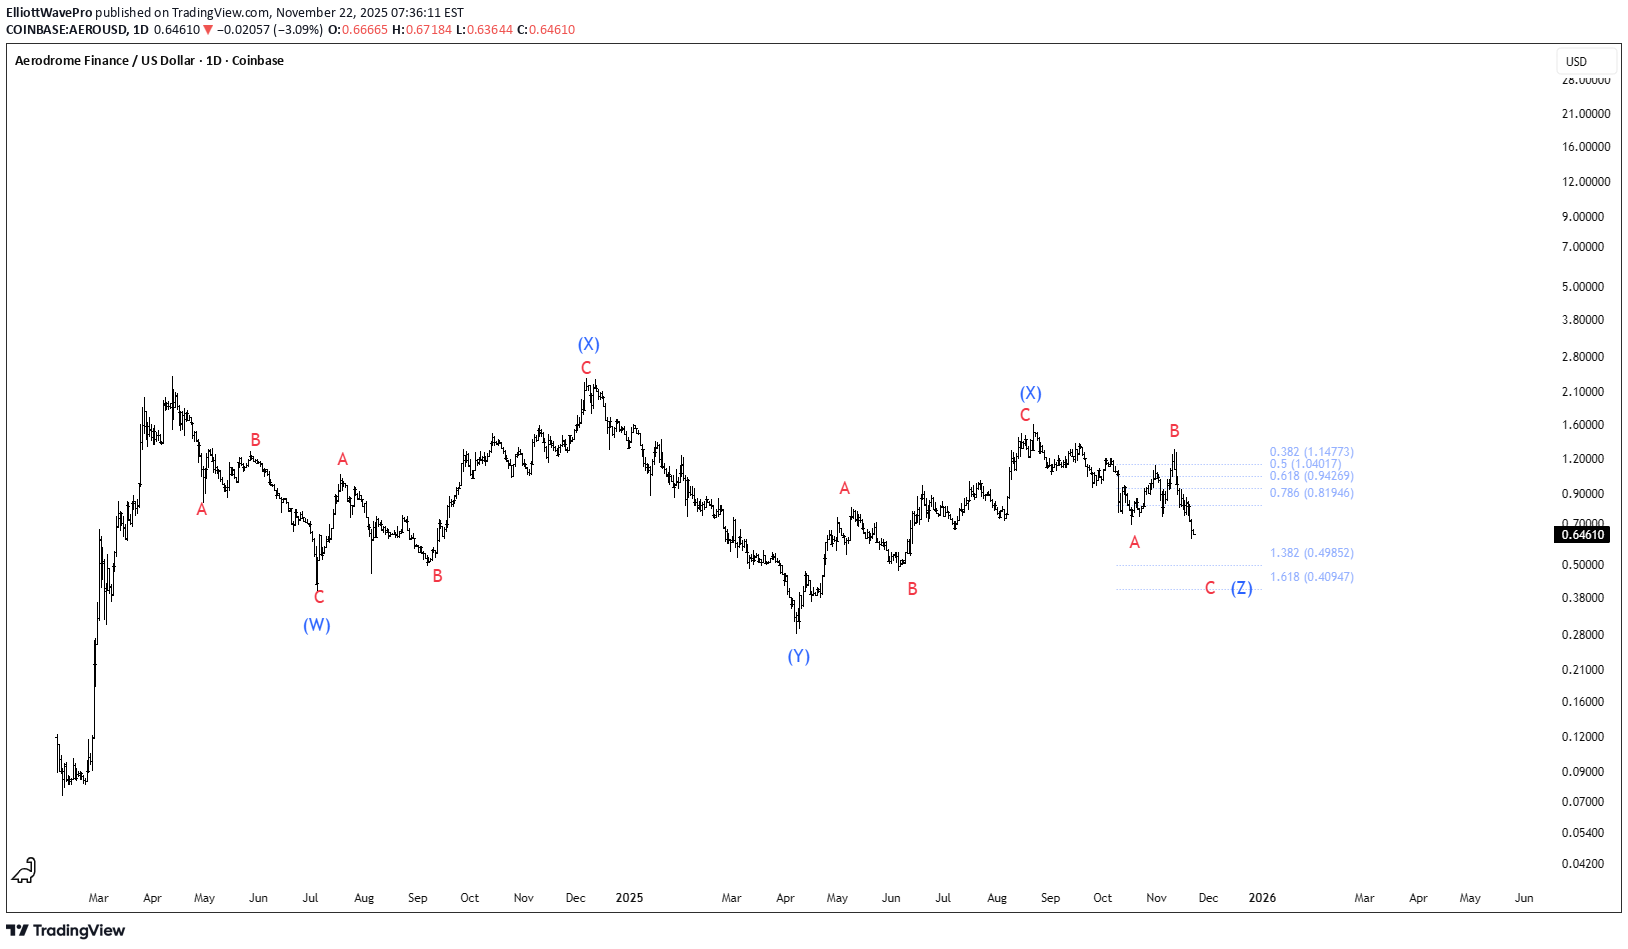
🔻 AERODROME (AERO) – Bearish Elliott Wave Breakdown AERO is moving exactly in line with a large W–X–Y–X–Z corrective pattern 📉, and price is now rolling over from the latest B-wave rejection. This breakdown strongly suggests the final Z-wave C-leg is unfolding, with bearish momentum strengthening and every bounce getting weaker 🚫📈. The structure continues to respect corrective symmetry, and the market has failed to reclaim key B-wave Fib zones — classic bearish continuation behavior. The downside roadmap is clear and Fibonacci levels now become the key magnets 🎯👇: 🔹 1.382 extension → ~$0.4985 🔹 1.618 extension → ~$0.4094 Both align perfectly with typical Z-wave depth and prior corrective proportions. No bullish divergence, no impulsive reversal signs, and no reclaim of lost structure — meaning sellers still have full control 🟥💪. As long as AERO continues printing lower highs + lower lows, the bearish bias stays firmly intact. This makes the $0.50 → $0.41 zone the main expectation area for a potential macro bottom or reaction bounce 📌. Until then, trend remains down, momentum favors sellers, and the Fib cluster below is the primary target zone. ⚠️ Bias: Bearish 🎯 Targets: $0.50 → $0.41
ElliottWavePro
سولانا تا ۱۸۵ دلار؟ سیگنال صعودی قوی با تحلیل موج الیوت!
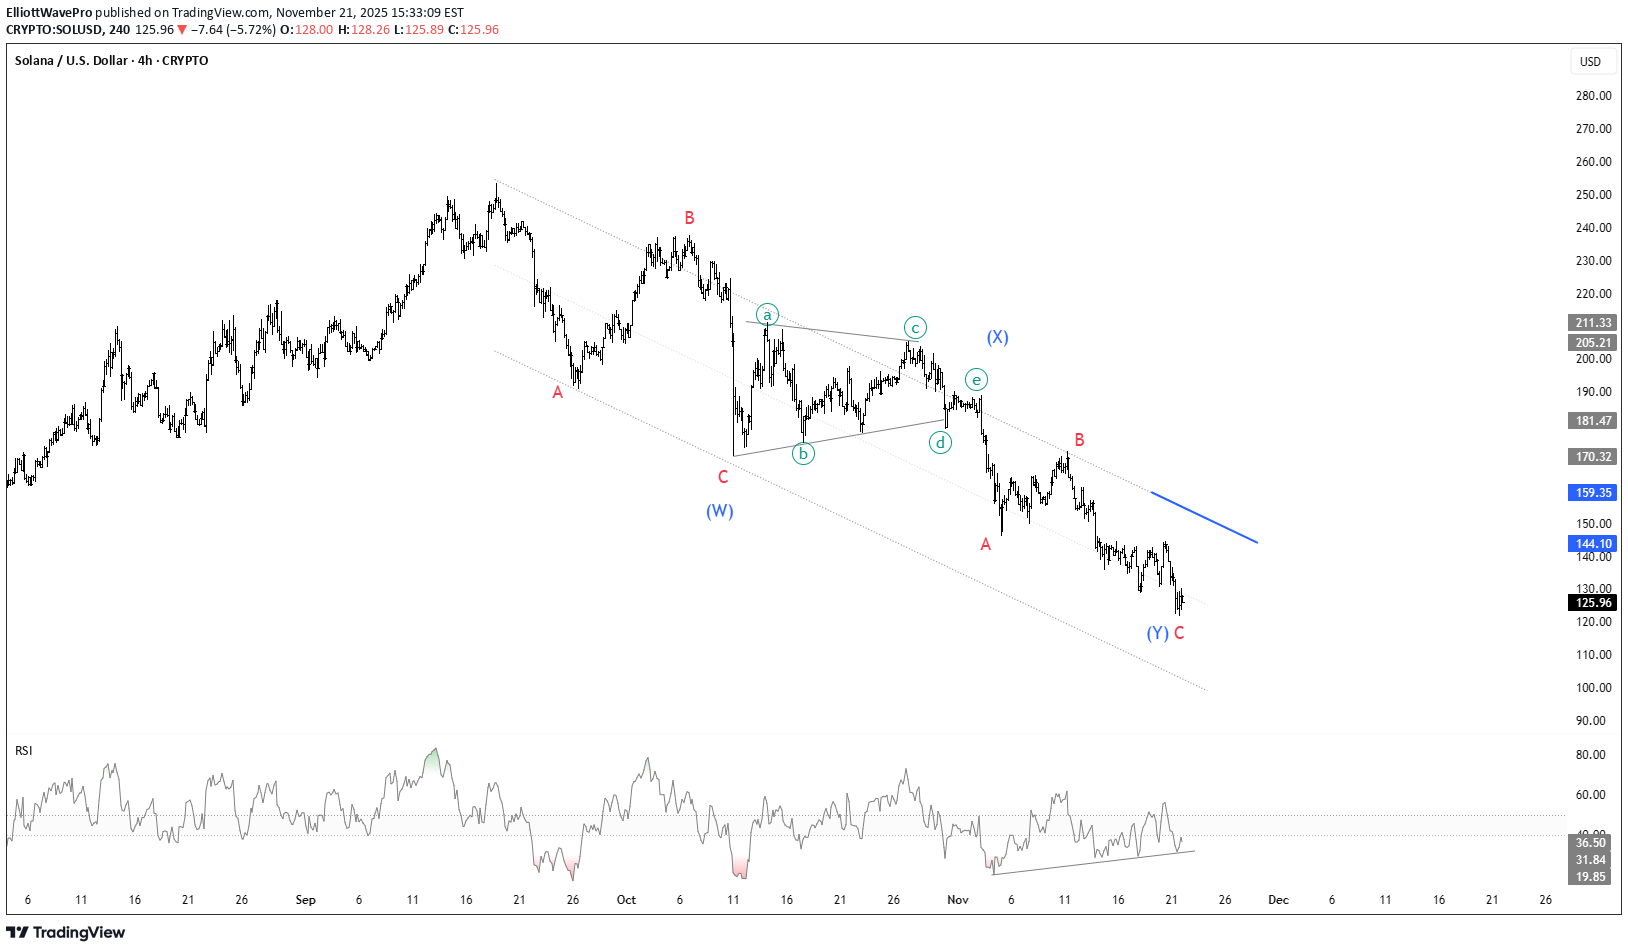
🟩 SOLANA LONG SETUP – Elliott Wave + PA After a successful short as posted a couple of days ago, SOL is nearing the end of a W–X–Y corrective structure, with the final (Y)–C wave looking mature. RSI is printing a clear bullish divergence ⚠️, signaling fading bearish momentum. The key trigger now: ➡️ A clean break above the blue channel-top trendline. That’s the level where an impulsive reversal can launch 🚀. Quick Highlights: • 🌀 Corrective pattern nearly complete • 📉 RSI bullish divergence forming • 📈 Break above blue line = long confirmation • 🎯 Impulsive upside likely once breakout holds Watching for that breakout to flip bias from defensive to aggressively bullish.
ElliottWavePro
تحلیل نهایی اتریوم: آیا موج صعودی به اوج تاریخی آغاز میشود؟
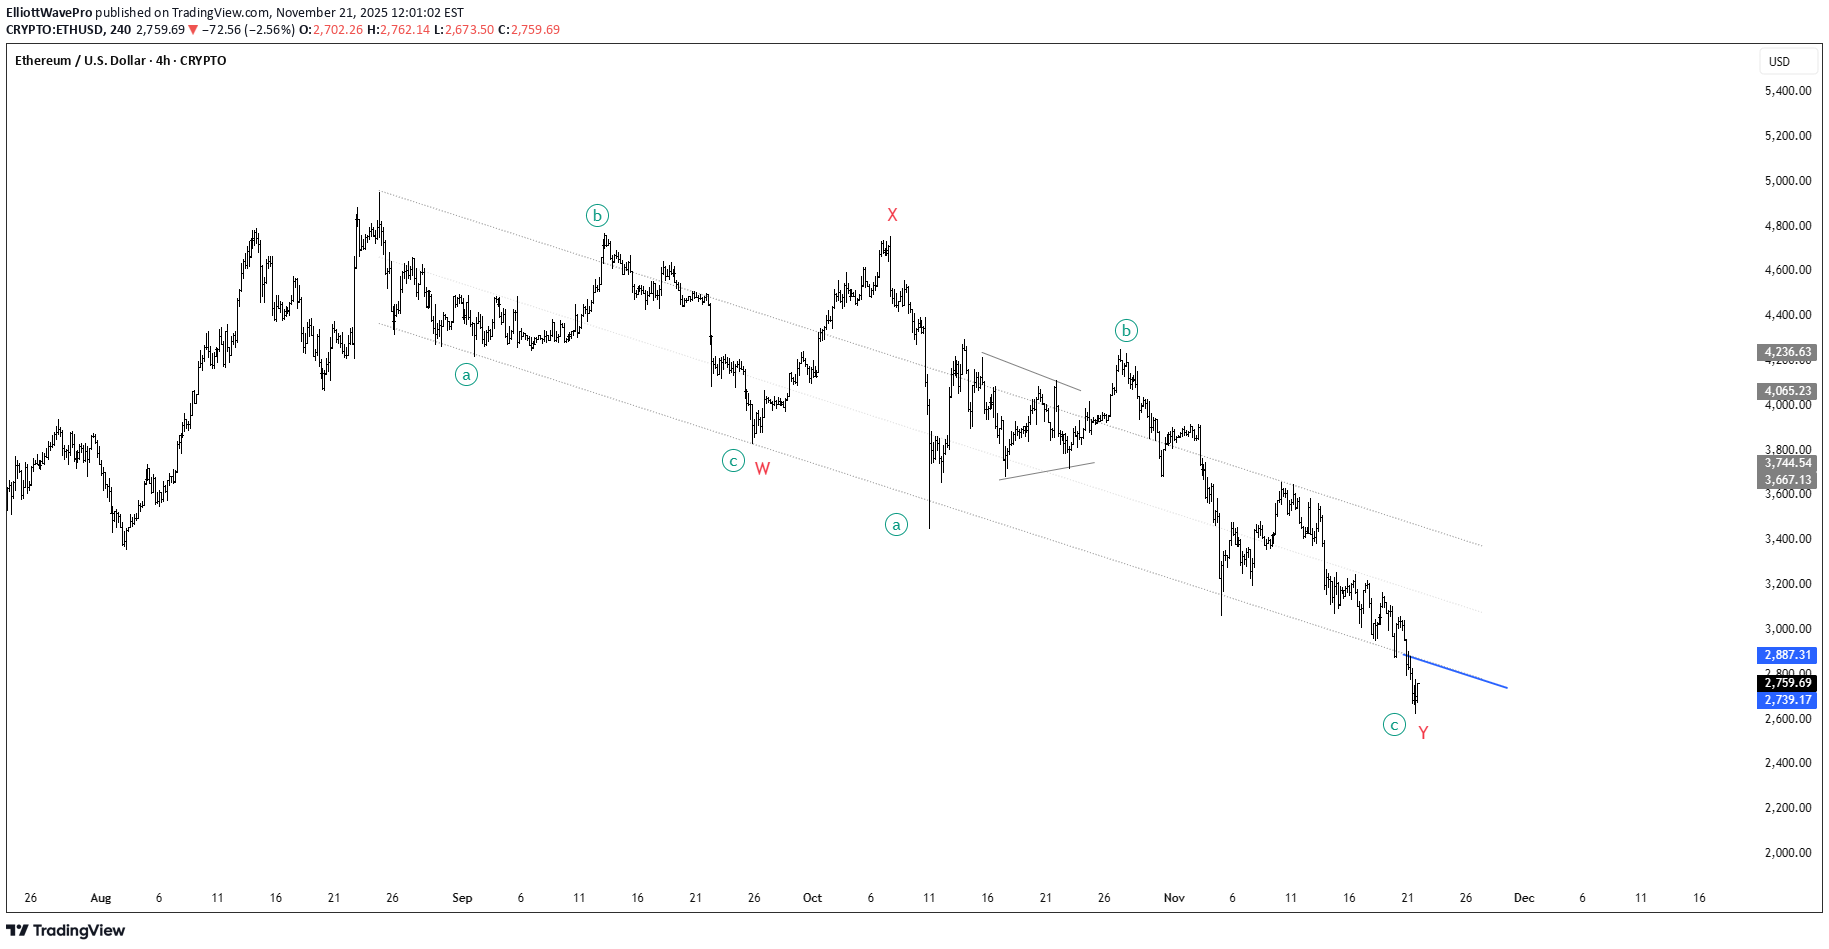
🚨 ETH Elliott Wave Update 🚨 What we’re looking at here is a clean W-X-Y complex correction unfolding over months — a classic structure when the market wants to correct deeper without breaking the macro trend. • Wave W completed with an ABC decline • Wave X gave us the relief rally everyone thought was the bottom ❌ • Wave Y extended lower, subdividing into a-b-c, pulling price into the lower boundary of the corrective channel Now we’re sitting right at the end of minor wave c of Y, the final leg of this entire structure. The pattern is mature, sellers look exhausted, and the downtrend channel is tightening — perfect conditions for a potential reversal. 🔵 The blue trendline is the key. If ETH can punch through that level with momentum, it confirms the entire WXY correction is complete and opens the door for a major impulsive leg upward. 💥 Break the blue line → reclaim macro structure → I believe ETH will begin the march toward new all-time highs. This is where long-term bottoms historically form: deep structure, clean proportions, fading downside velocity, and a clear invalidation level. 📈 Eyes on the breakout.All eyes on the blue line.Working beautifully. Will see what FED has to say today. So far so good!
ElliottWavePro
صبر طلا است: بیت کوین در آستانه اوج تاریخی جدید!
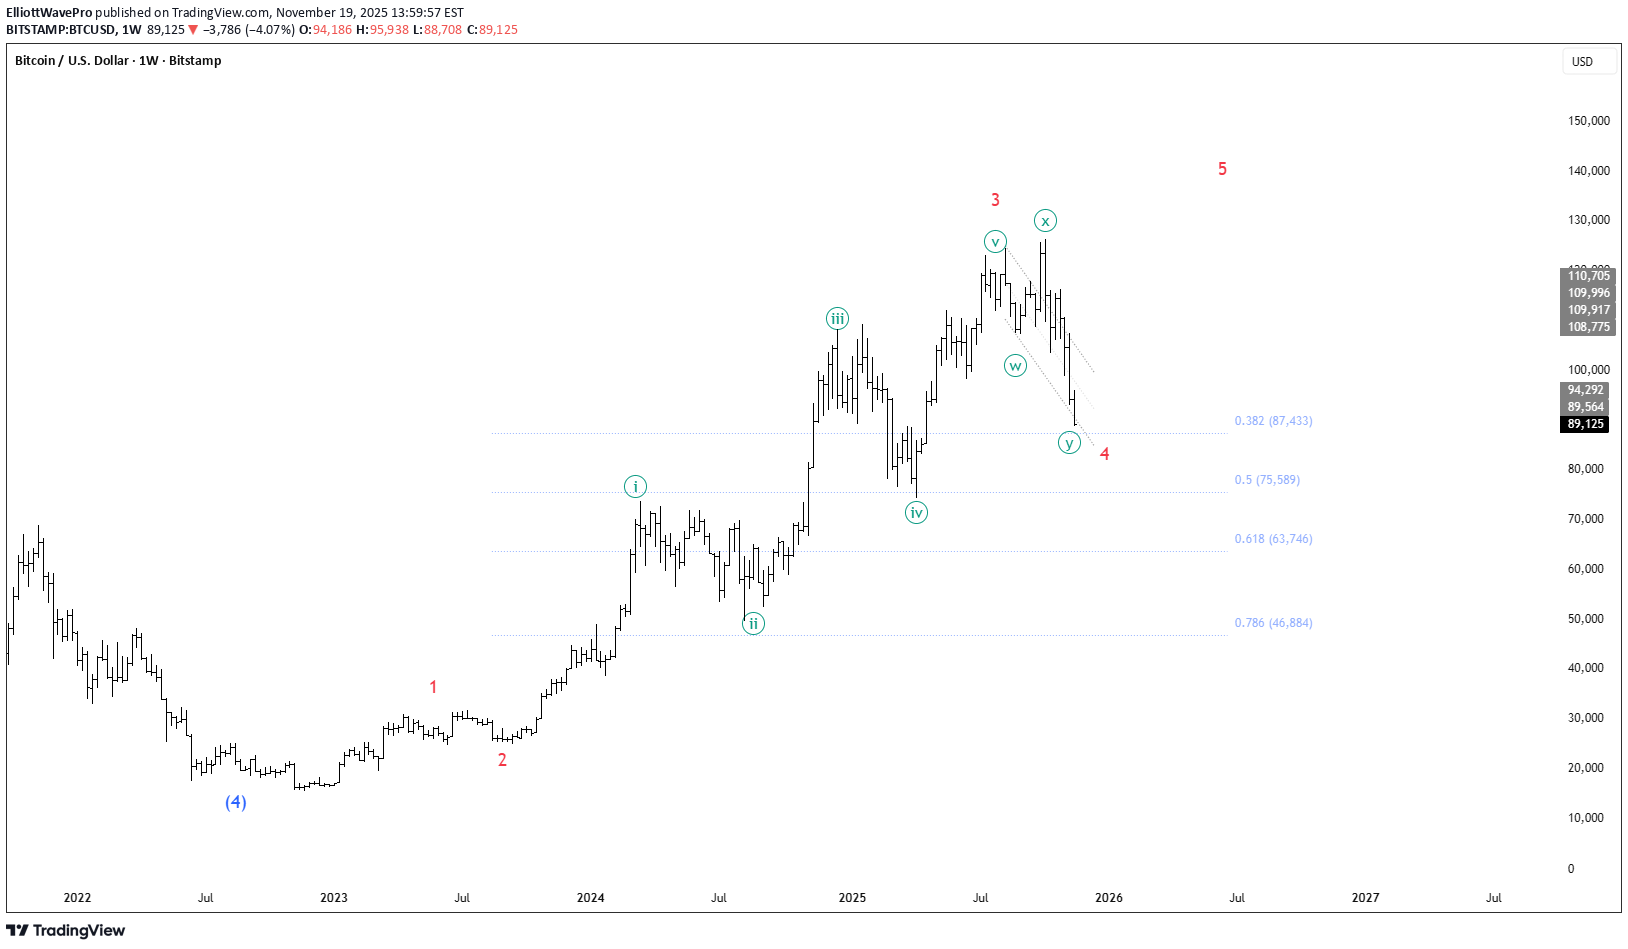
🚀 Wave 4 Almost DONE! This wave count is one of the cleanest macro structures we’ve seen in this cycle. Every leg has unfolded with beautiful precision, and now Bitcoin is approaching a high-probability reversal zone. 👇 🔍 Why This Count Looks 🔥 • Textbook Impulse Structure: Wave 1, 2, and the extended Wave 3 all follow classic Elliott Wave proportions. • Clean W-X-Y Correction: Wave 4 has respected every trend channel and internal subdivision — a sign of structural strength. • Major Fibonacci Confluence: Price is now diving into the 0.382 fib level (~$87.4K) — a common Wave 4 retracement in strong bull markets. • Perfect Geometry: Trendlines, fibs, and wave symmetry all align at this region. 🎯 🚀 What’s Coming Next? From the 0.382 level, BTC is primed for a strong bounce and the start of Wave 5 — historically the second-most explosive leg of the entire cycle. This is where momentum accelerates, sentiment flips, and exceptional moves often ignite. ⚡🔥 📈 Wave 5 is loading… stay ready.Most often the bigger 4 can retrace to the minor 4. Meaning, the red wave 4 can end at the green wave 4. This is how it works. In that case, I will expect 75K and a new wave up in 5 to complete the red wave 5.
ElliottWavePro
صعود فضایی AERO: آیا کف قیمتی شکل گرفته است؟
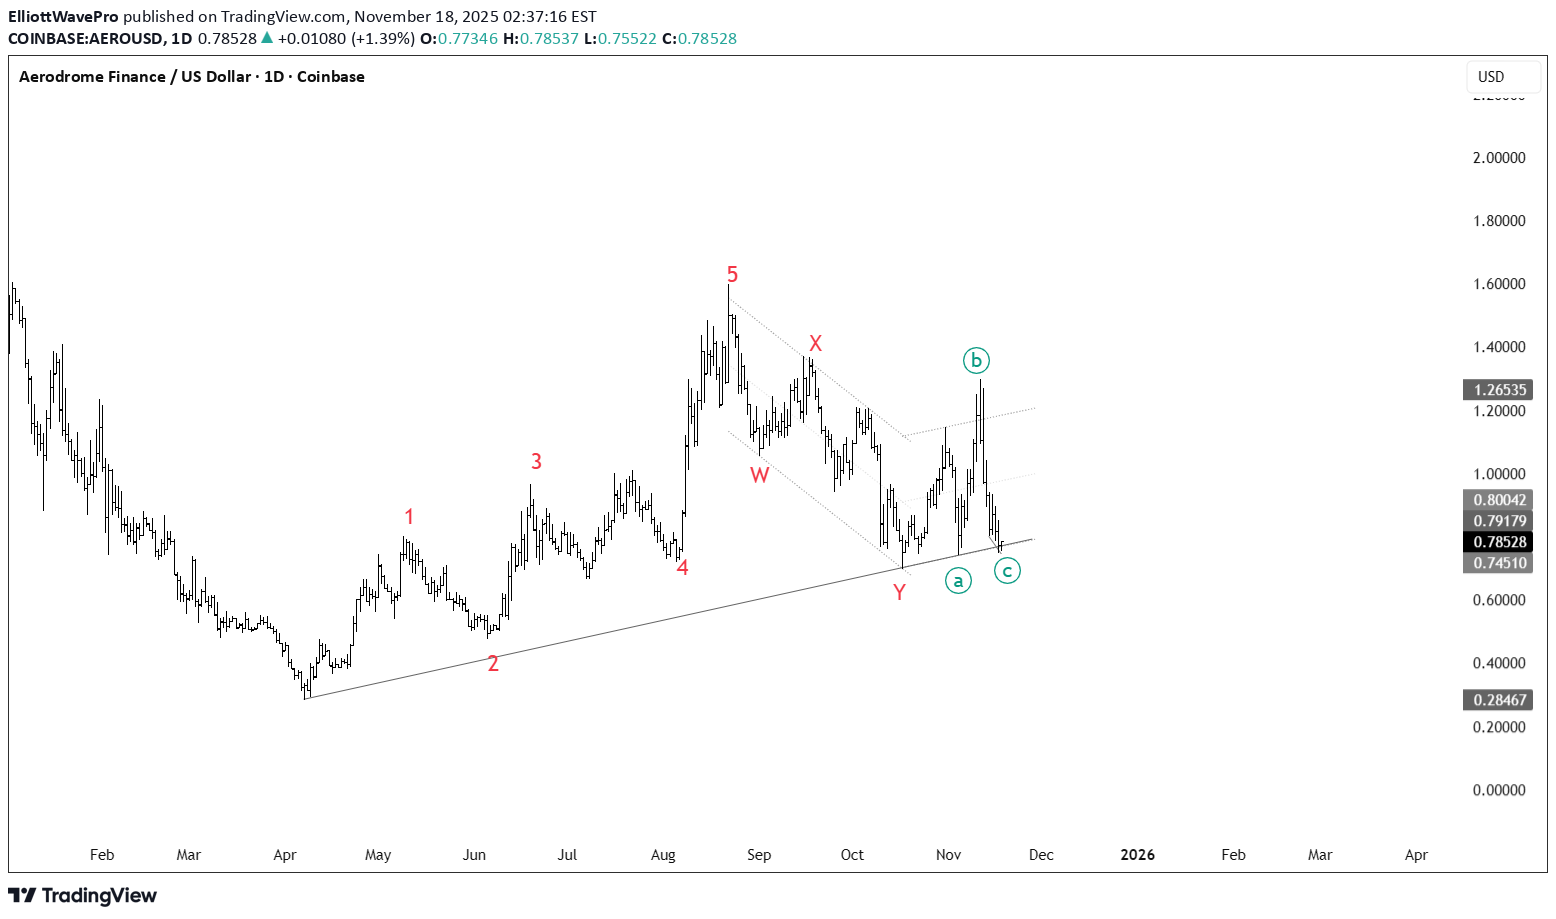
Aero is now resting on a long term trendline. The counts tell me that this is potential bottom.Price went below Y what I believed as end of correction. Will recount once I get clarity.
ElliottWavePro
اتریوم در آستانه انفجار بزرگ: آیا سقف تاریخی دوباره ثبت میشود؟
Bottoms are made in panic. We should be able to see all time high soon.
ElliottWavePro
قیمت بیت کوین به زودی منفجر میشود؟ پایان فروش و احتمال کف قیمتی برای BTC!
Looking at the structure, it seems like selling is over and we are about to turn around. This is potential bottom for BTC.
ElliottWavePro
DASH در آستانه انفجار: فرصت طلایی خرید در سطح فیبوناچی 61.8!
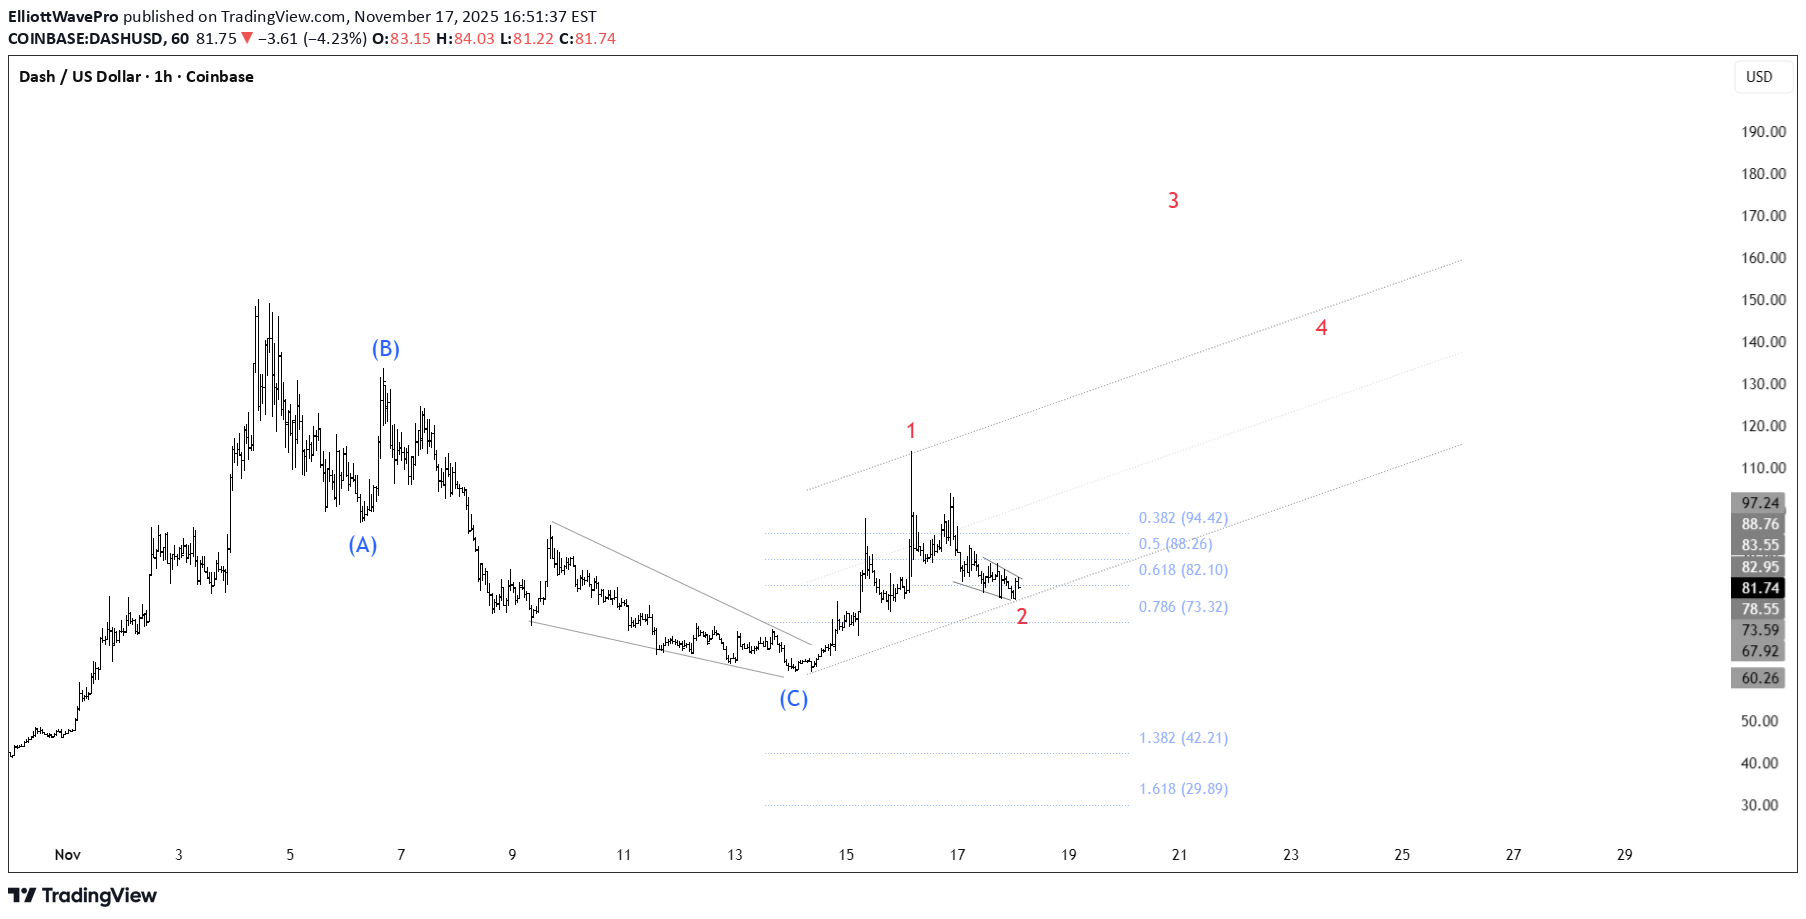
This could be an amazing opportunity. Resting well at 61.8 fib level, next is a wave 3 advance.Did not go as planned. Stopped out!
Disclaimer
Any content and materials included in Sahmeto's website and official communication channels are a compilation of personal opinions and analyses and are not binding. They do not constitute any recommendation for buying, selling, entering or exiting the stock market and cryptocurrency market. Also, all news and analyses included in the website and channels are merely republished information from official and unofficial domestic and foreign sources, and it is obvious that users of the said content are responsible for following up and ensuring the authenticity and accuracy of the materials. Therefore, while disclaiming responsibility, it is declared that the responsibility for any decision-making, action, and potential profit and loss in the capital market and cryptocurrency market lies with the trader.