
BOME
BOOK OF MEME
| تریدر | نوع سیگنال | حد سود/ضرر | زمان انتشار | مشاهده پیام |
|---|---|---|---|---|
No results found. | ||||
Price Chart of BOOK OF MEME
سود 3 Months :
سیگنالهای BOOK OF MEME
Filter
Sort messages by
Trader Type
Time Frame

import pandas as pd import numpy as np import matplotlib.pyplot
import pandas as pd import numpy as np import matplotlib.pyplot as plt import yfinance as yf from datetime import datetime # دریافت دادههای تاریخی (مثال: بیتکوین) symbol = "BTC-USD" start_date = "2023-01-01" end_date = datetime.now().strftime("%Y-%m-%d") data = yf.download(symbol, start=start_date, end=end_date) df = data [ ['Close']].copy() # ۱. محاسبه میانگین متحرک (MA) def calculate_ma(df, window=20): df [f'MA_{window}'] = df ['Close'].rolling(window=window).mean() return df df = calculate_ma(df, window=20) df = calculate_ma(df, window=50) # ۲. محاسبه RSI def calculate_rsi(df, window=14): delta = df ['Close'].diff() gain = (delta.where(delta > 0, 0)).rolling(window=window).mean() loss = (-delta.where(delta < 0, 0)).rolling(window=window).mean() rs = gain / loss df ['RSI'] = 100 - (100 / (1 + rs)) return df df = calculate_rsi(df, window=14) # ۳. محاسبه MACD def calculate_macd(df, fast=12, slow=26, signal=9): df ['EMA_fast'] = df ['Close'].ewm(span=fast, adjust=False).mean() df ['EMA_slow'] = df ['Close'].ewm(span=slow, adjust=False).mean() df ['MACD'] = df ['EMA_fast'] - df ['EMA_slow'] df ['Signal_Line'] = df ['MACD'].ewm(span=signal, adjust=False).mean() df ['MACD_Histogram'] = df ['MACD'] - df ['Signal_Line'] return df df = calculate_macd(df) # ۴. رسم نمودارها fig, axes = plt.subplots(4, 1, figsize=(14, 10), gridspec_kw={'height_ratios': [3, 1, 1, 1]}) # نمودار قیمت و MA axes [0].plot(df.index, df ['Close'], label='Close Price', color='black', linewidth=1) axes [0].plot(df.index, df ['MA_20'], label='MA 20', color='blue', linewidth=1) axes [0].plot(df.index, df ['MA_50'], label='MA 50', color='red', linewidth=1) axes [0].set_title(f'{symbol} - Price & Moving Averages') axes [0].legend() axes [0].grid(True) # نمودار RSI axes [1].plot(df.index, df ['RSI'], label='RSI (14)', color='purple', linewidth=1) axes [1].axhline(y=70, color='red', linestyle='--', linewidth=0.7) axes [1].axhline(y=30, color='green', linestyle='--', linewidth=0.7) axes [1].fill_between(df.index, 30, 70, alpha=0.1, color='gray') axes [1].set_title('RSI Indicator') axes [1].legend() axes [1].grid(True) # نمودار MACD و Signal Line axes [2].plot(df.index, df ['MACD'], label='MACD', color='blue', linewidth=1) axes [2].plot(df.index, df ['Signal_Line'], label='Signal Line', color='red', linewidth=1) axes [2].set_title('MACD Indicator') axes [2].legend() axes [2].grid(True) # نمودار هیستوگرام MACD axes [3].bar(df.index, df ['MACD_Histogram'], label='MACD Histogram', color='gray') axes [3].axhline(y=0, color='black', linewidth=0.5) axes [3].set_title('MACD Histogram') axes [3].legend() axes [3].grid(True) plt.tight_layout() plt.show() # ۵. نمایش جدول دادههای اخیر print(df [ ['Close', 'MA_20', 'MA_50', 'RSI', 'MACD', 'Signal_Line']].tail(10))

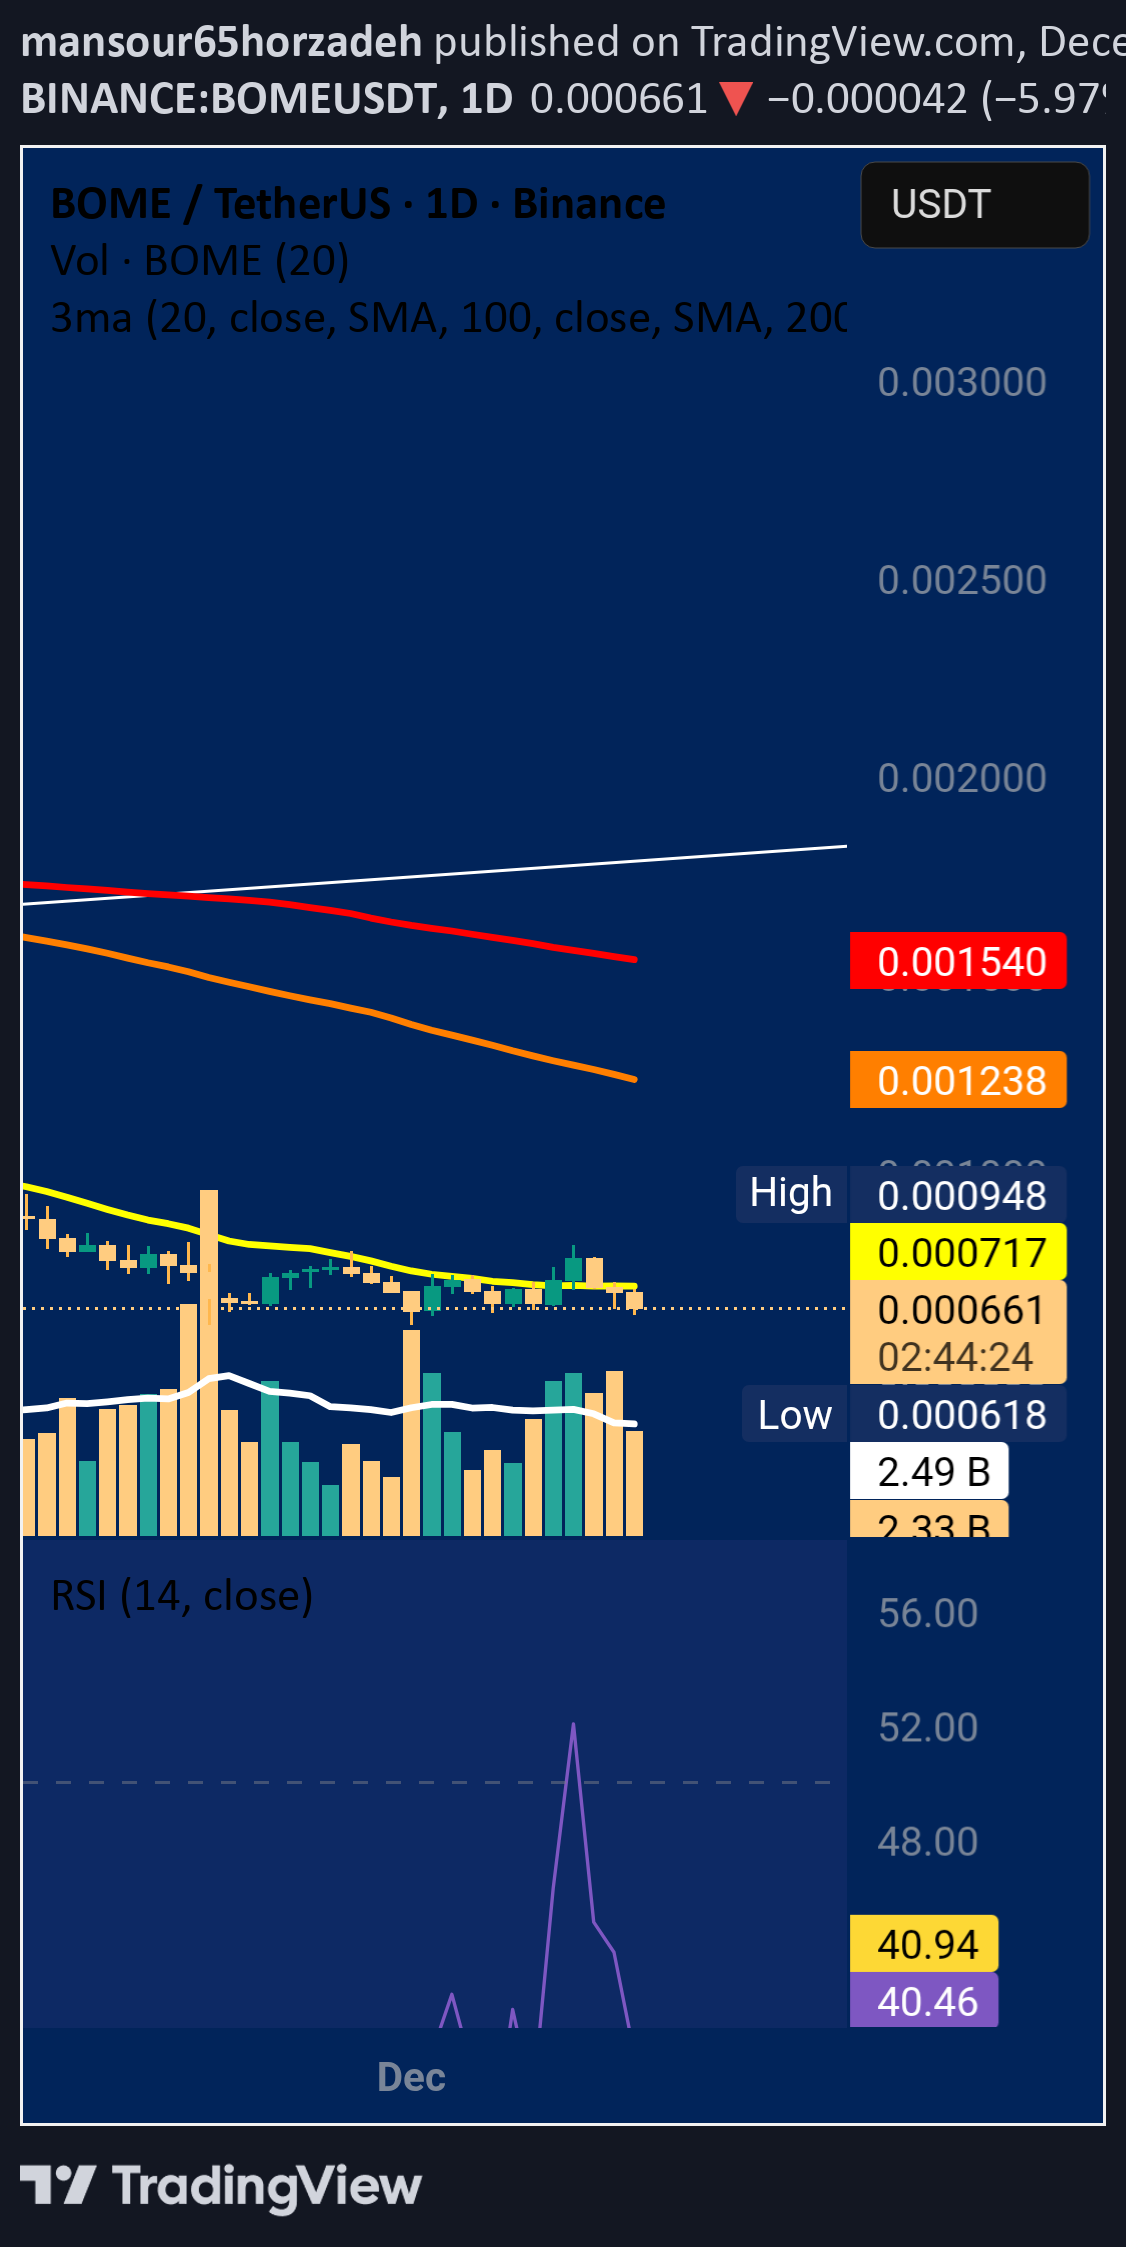
Kapitalist01
یادداشت شخصی: نکات مهمی که نباید فراموش کنید (سلب مسئولیت سرمایهگذاری)
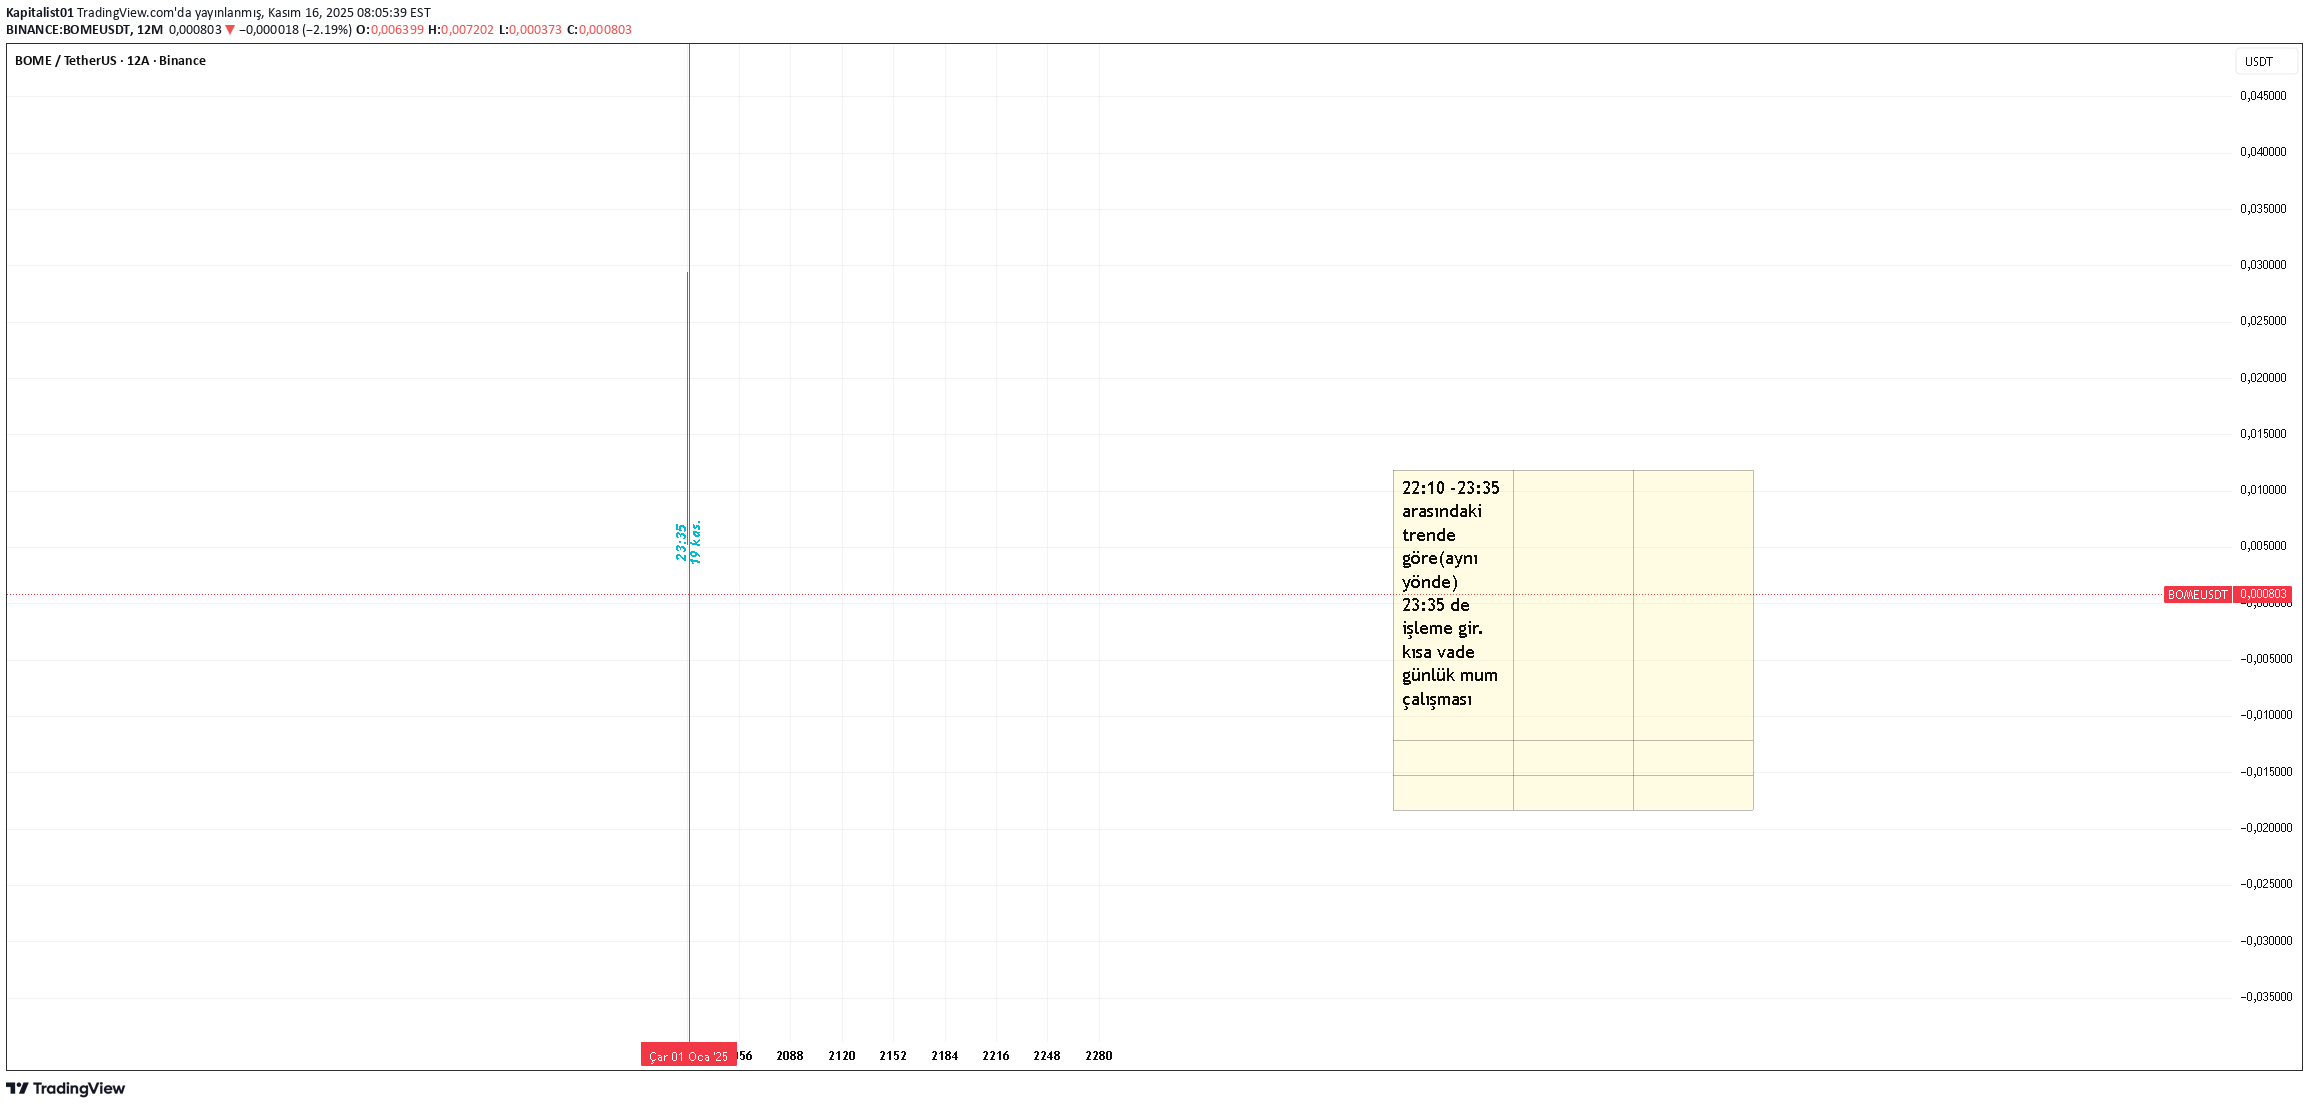
It is not investment advice. for monitoring purposes. ........................................................

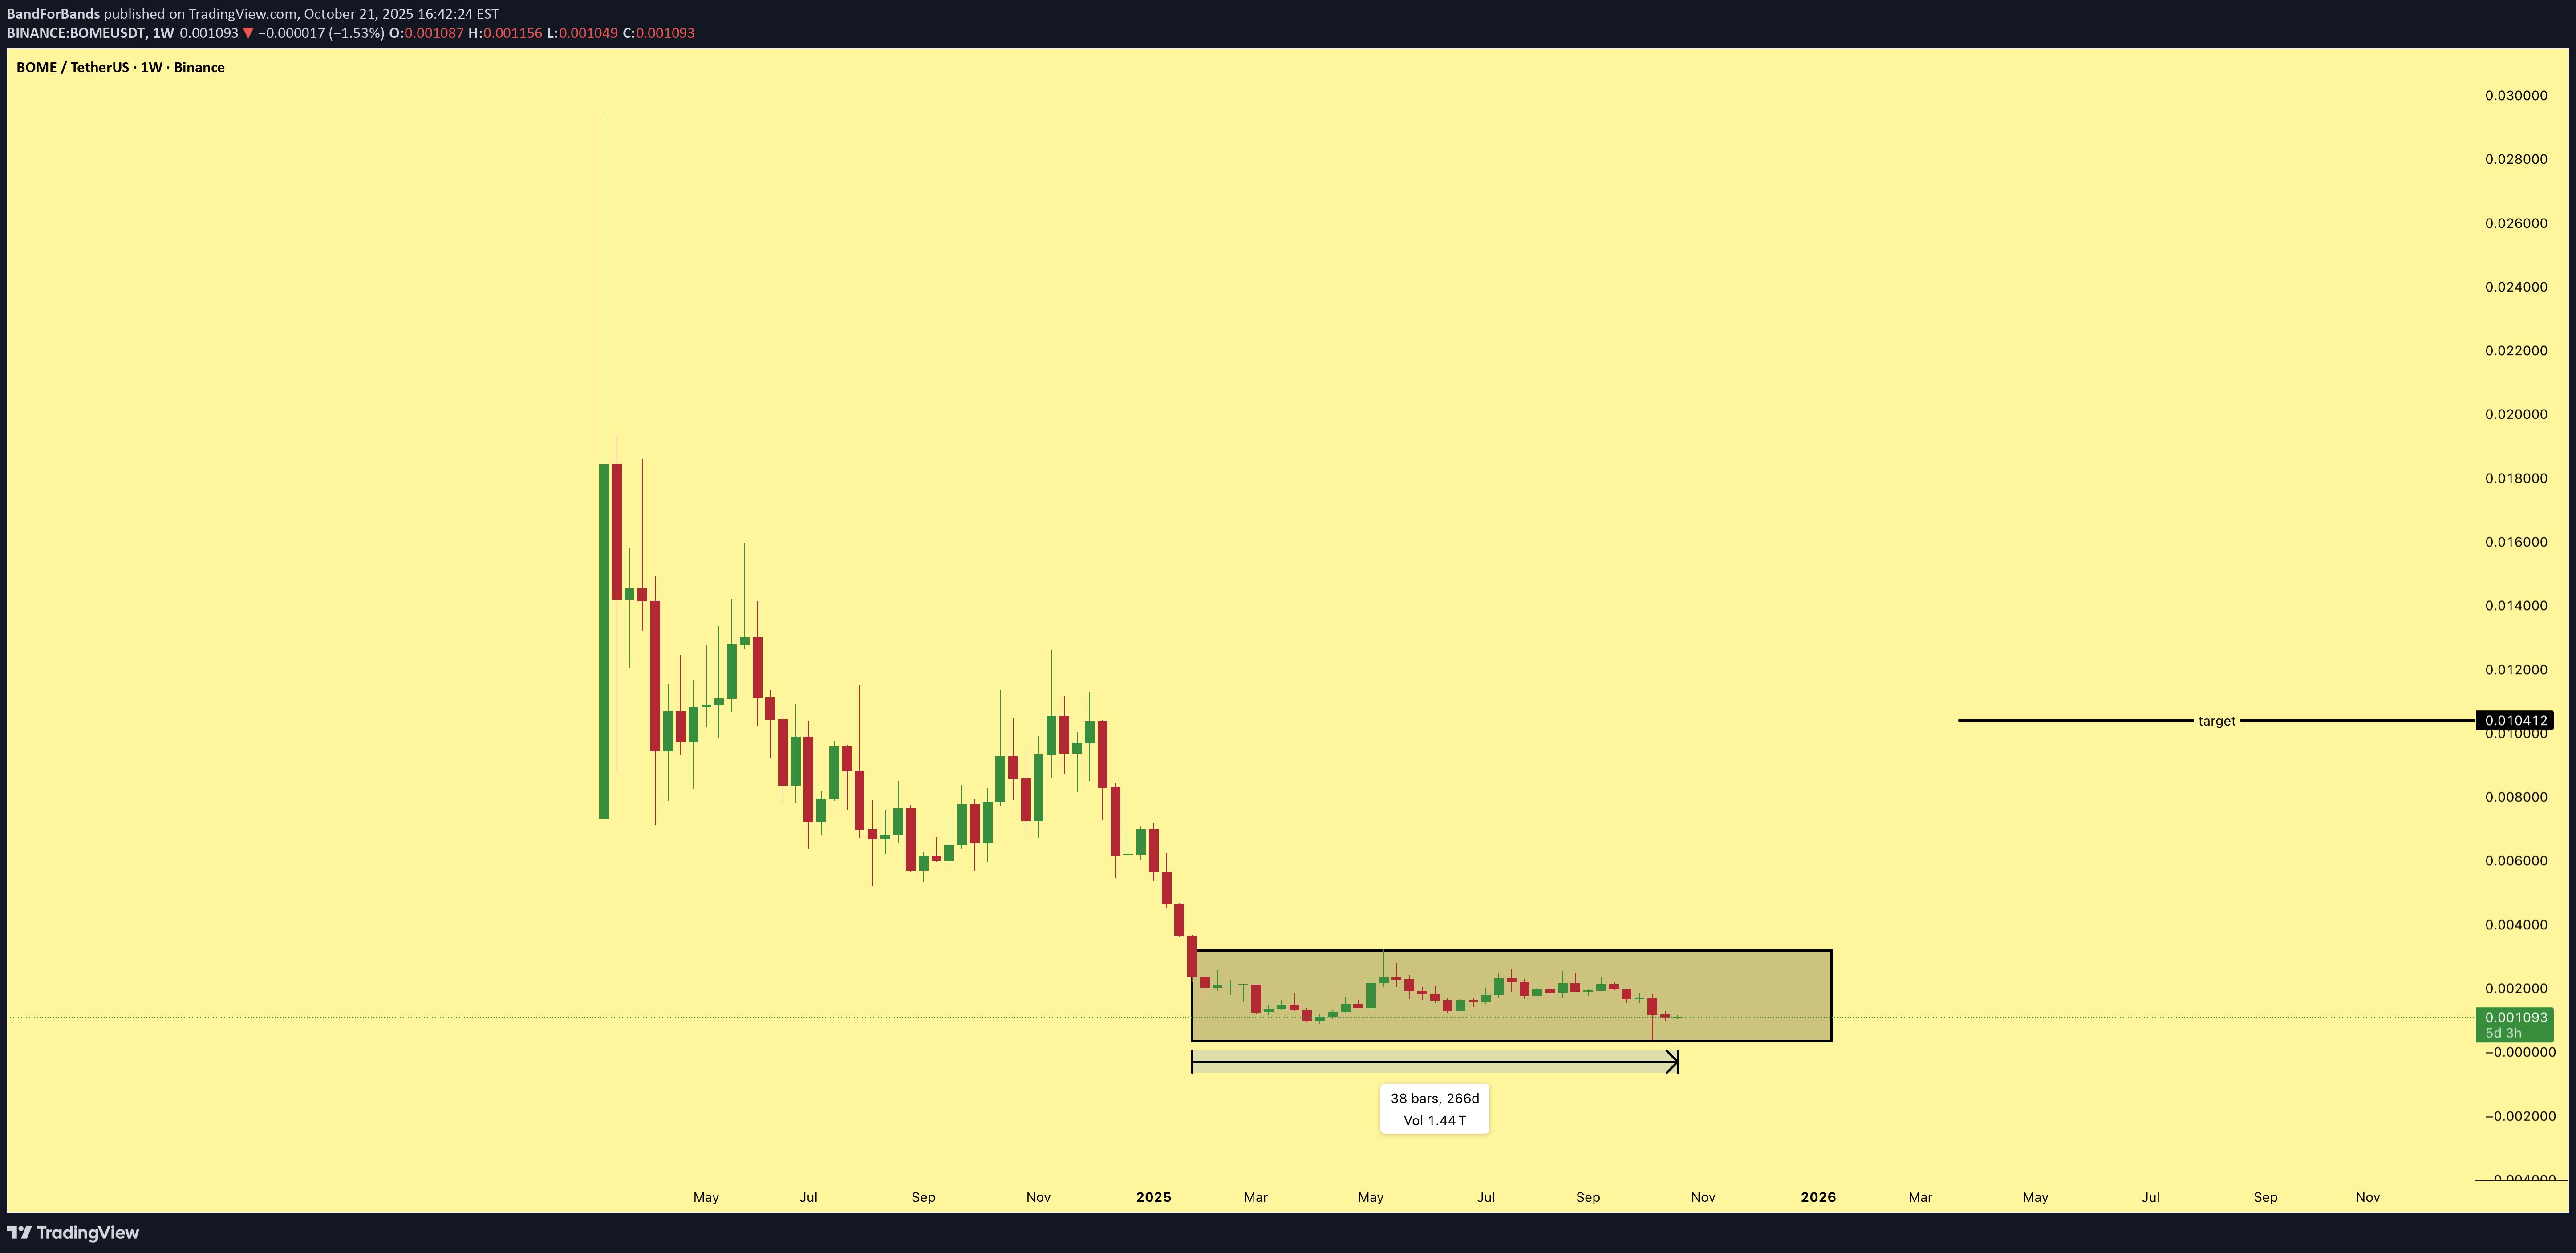
BandForBands
رالی انفجاری BOME در راه است؟ احتمال سود ۹۰۰ درصدی با این استراتژی ورود!

MMBTtrader
BOME fakeout to the downside and stop loss end time to fly
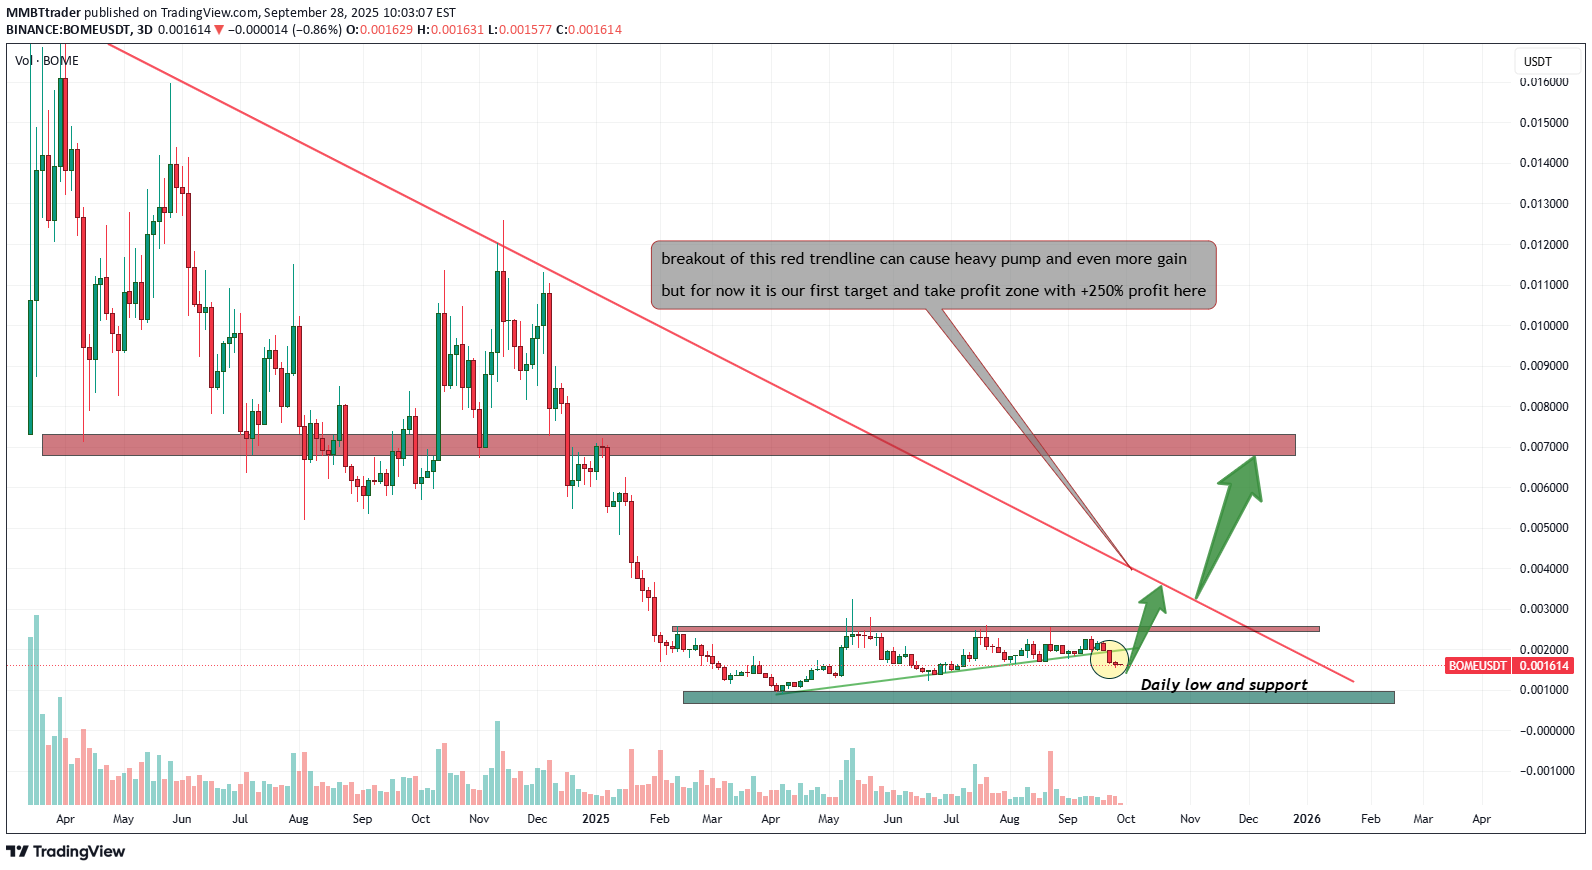
As we can see we had a huge amount of dump here and i like these charts because explode and huge profits sometimes are in these charts and i think
BOMEUSDT
is now ready for one of those explosion to the upside.
breakout of this 0.0041$ can cause heavy pump and even more gain but for now it is our first target and take profit zone with +250% profit.
DISCLAIMER: ((trade based on your own decision))
<

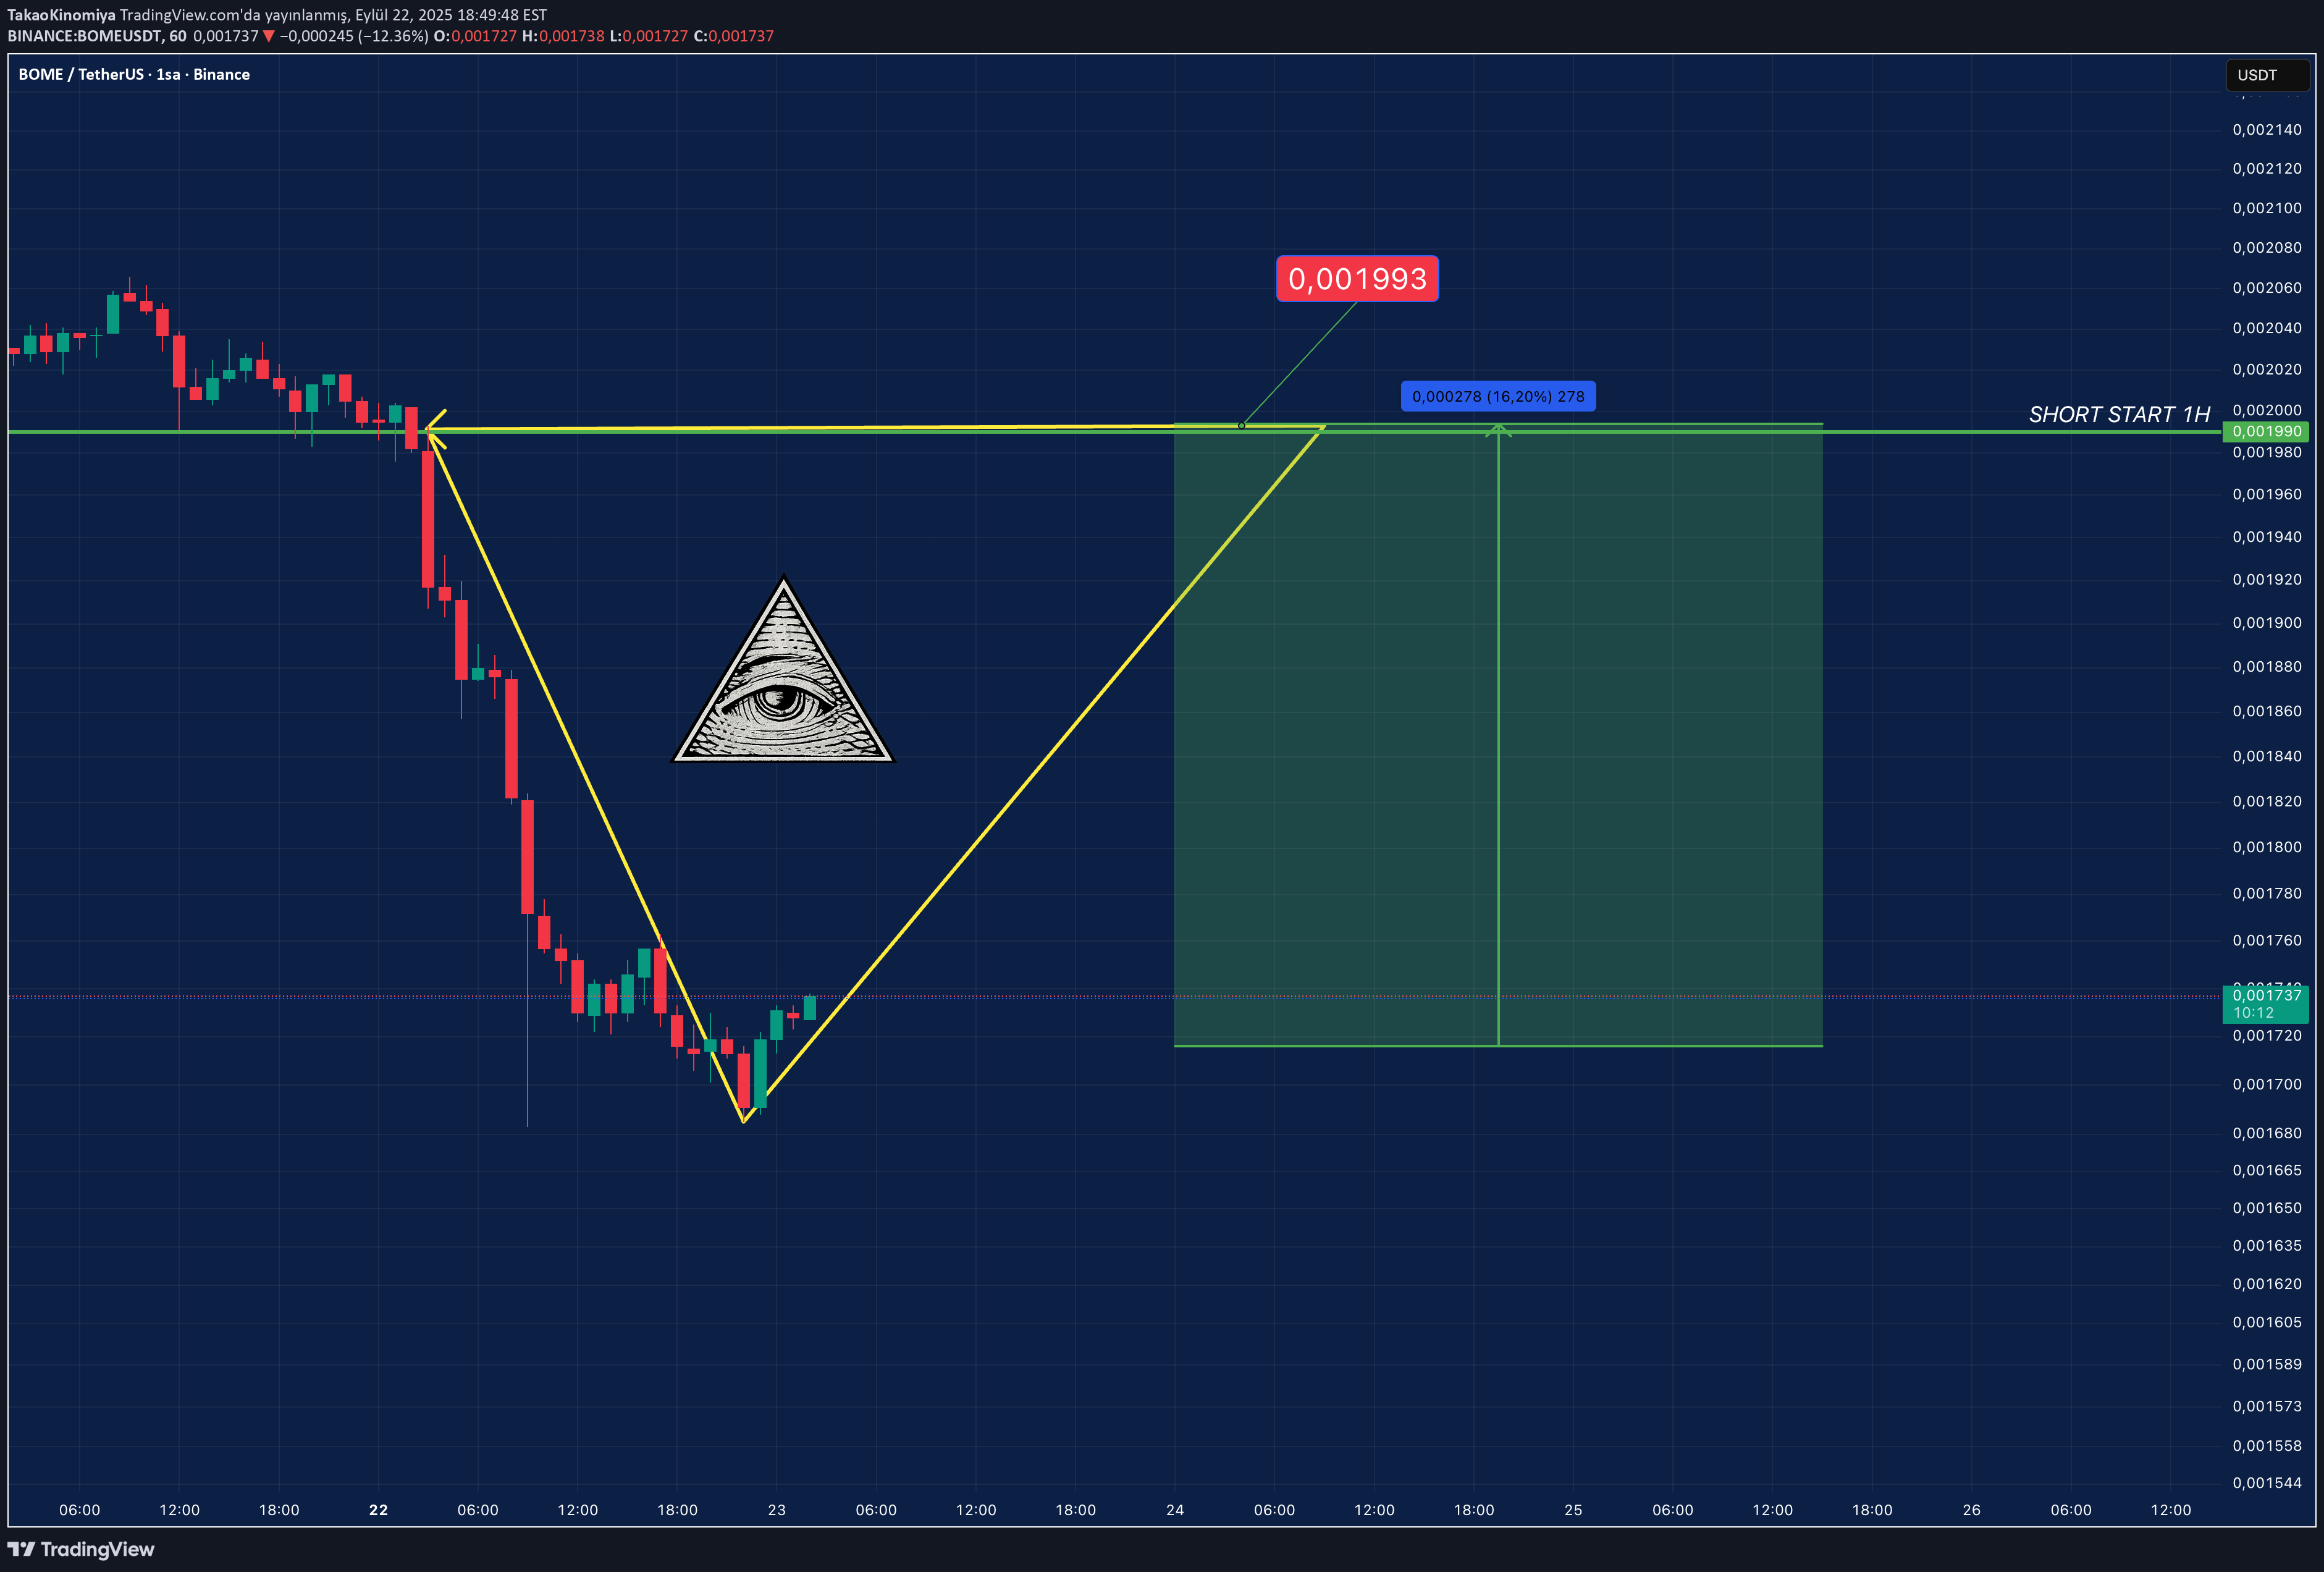
TakaoKinomiya
BOME UZUN ARADAN SONRA LONG DENEMESİ.

catalyts
BOMEUSDT--LONG
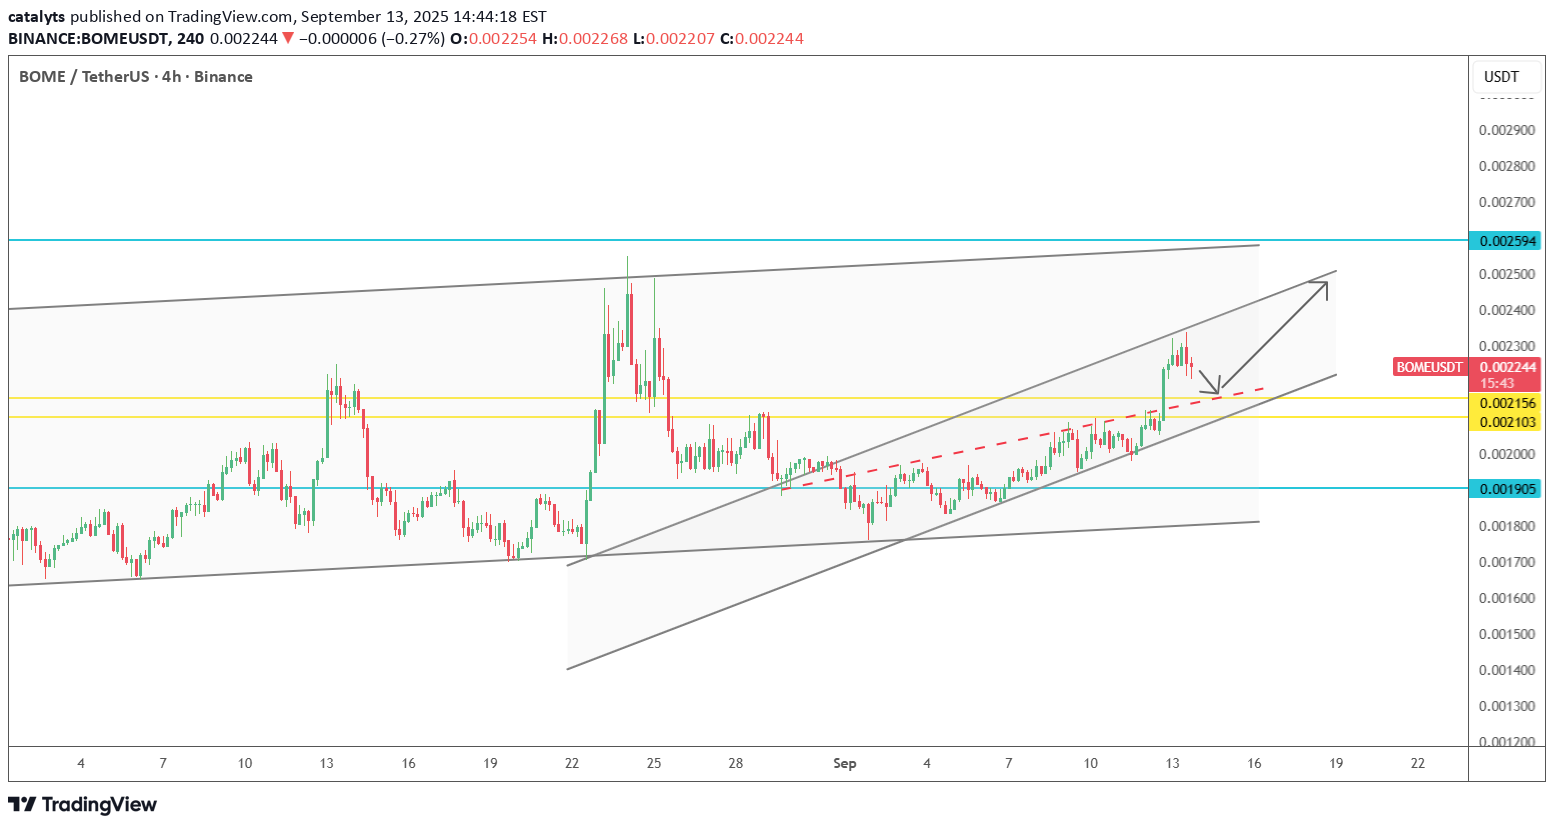
--Bullish bias --tp and entry levels are as shown on chart

CryptoWithJames
BOMEUSDT UPDATE
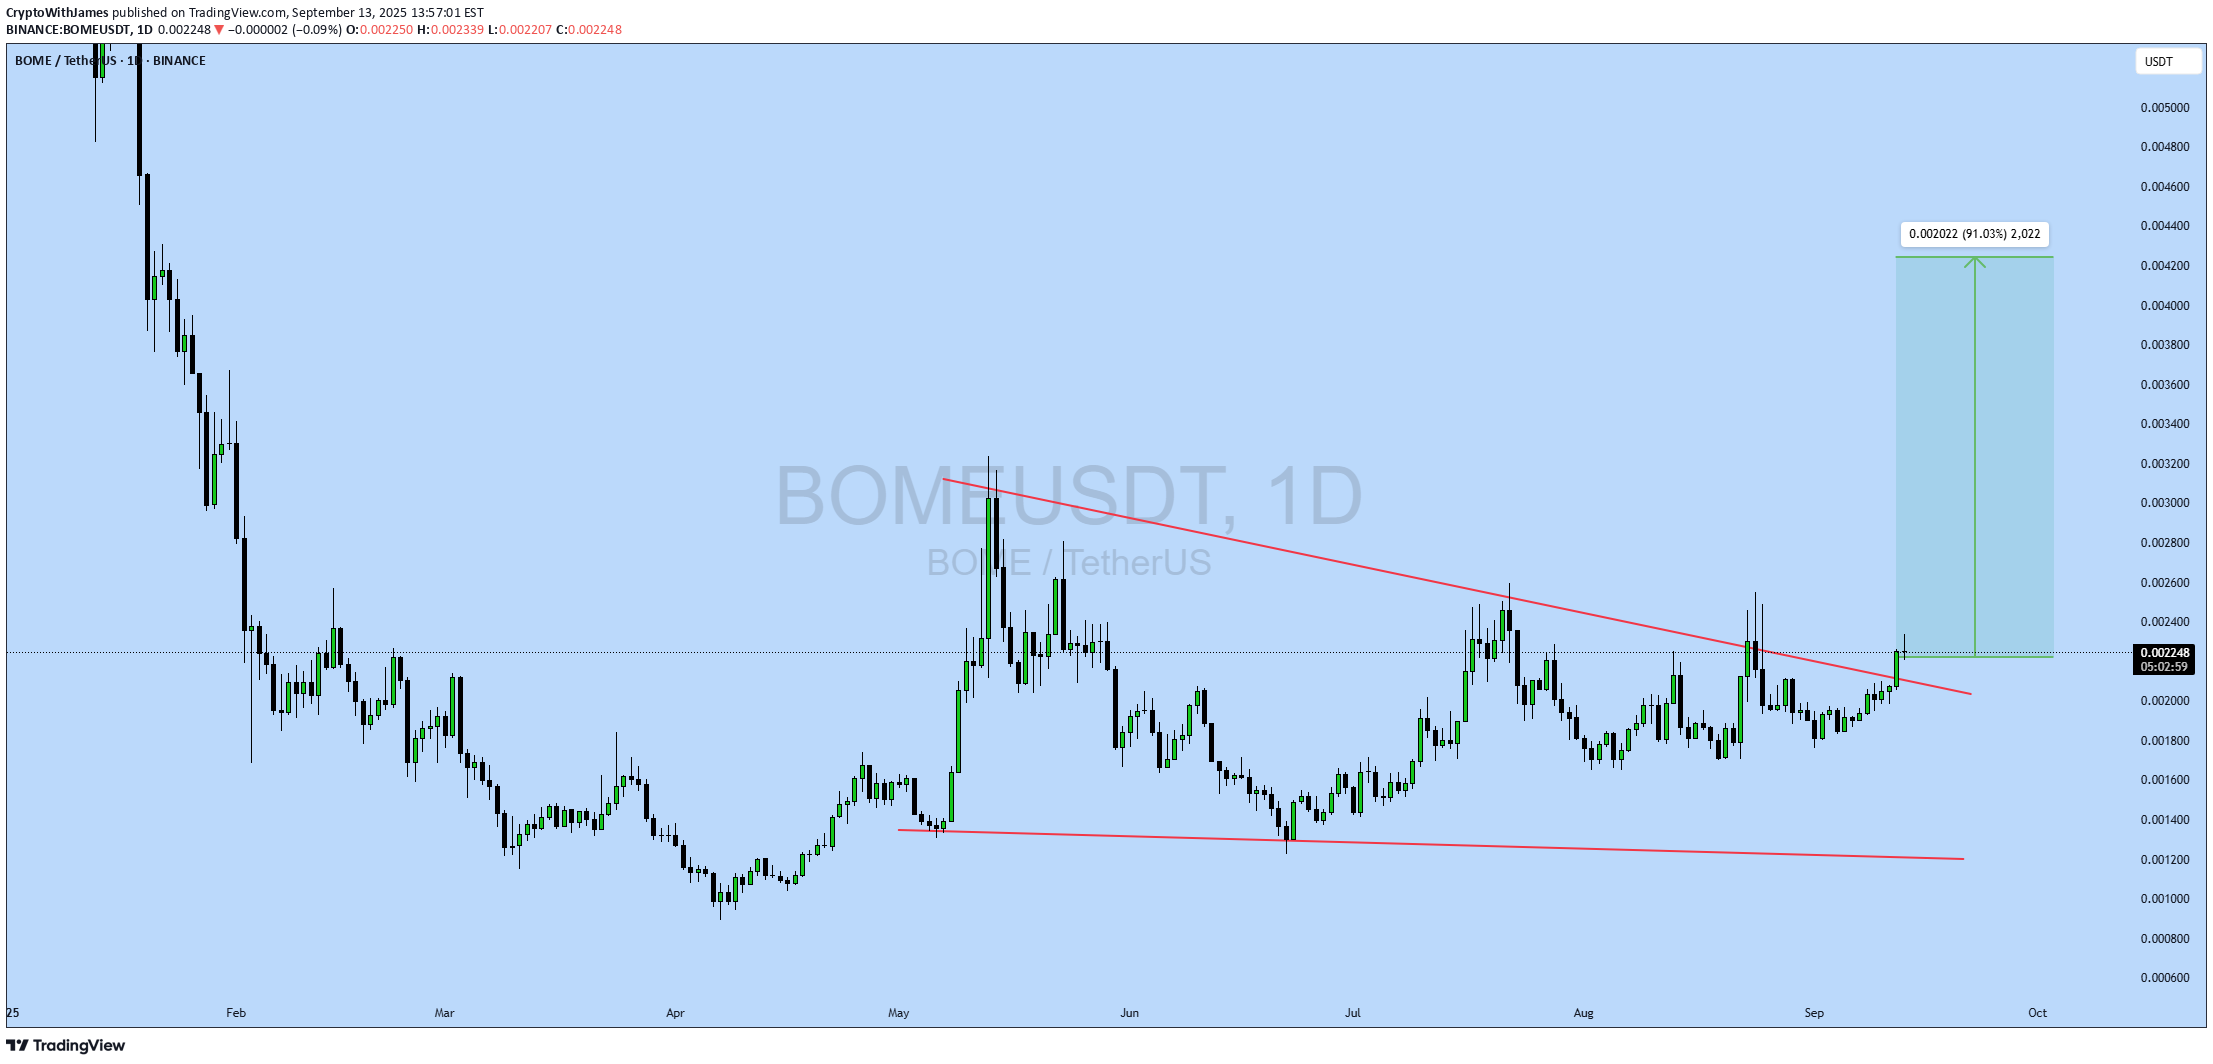
#BOME UPDATE BOME Technical Setup Pattern : Bullish Falling Wedge Breakout Current Price: $0.002246 Target Price: $0.00420 Target % Gain: 91.03% Technical Analysis: BOME has confirmed a breakout from a bullish falling wedge on the daily chart. Price closed above trendline resistance, supported by steady accumulation and breakout momentum, pointing toward a strong upside potential. Time Frame: 1D Risk Management Tip: Always use proper risk management.

Bithereum_io
BOMEUSDT 1D
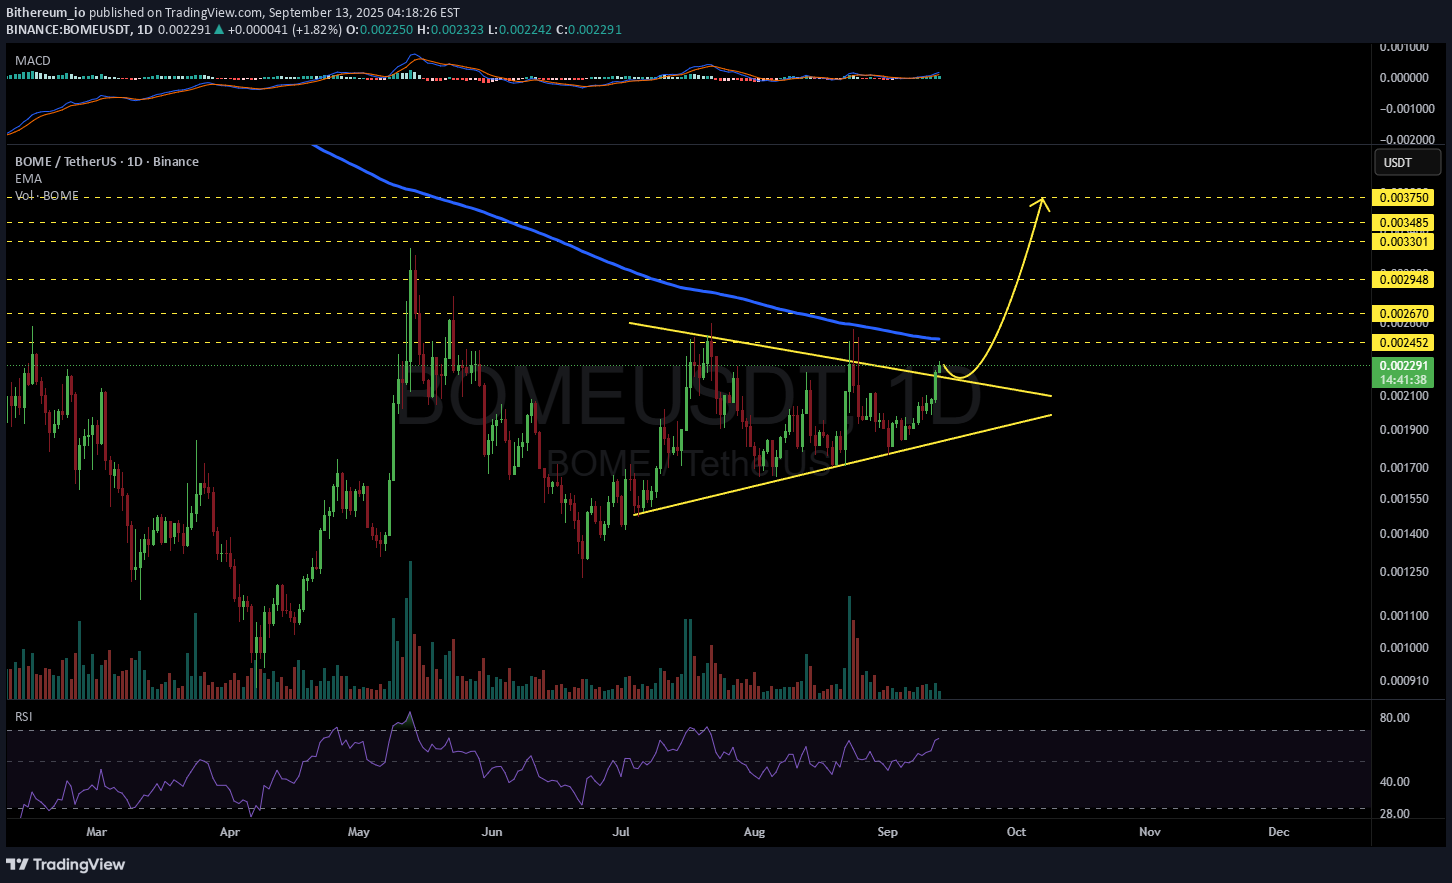
#BOME has broken above the symmetrical triangle on the daily chart. In case of a successful retest, the targets are: 🎯 $0.002452 🎯 $0.002670 🎯 $0.002948 🎯 $0.003301 🎯 $0.003485 🎯 $0.003750 ⚠️ Always remember to use a tight stop-loss and follow proper risk management.

Alpha-GoldFX
BOMEUSDT Forming Bullish Pennant
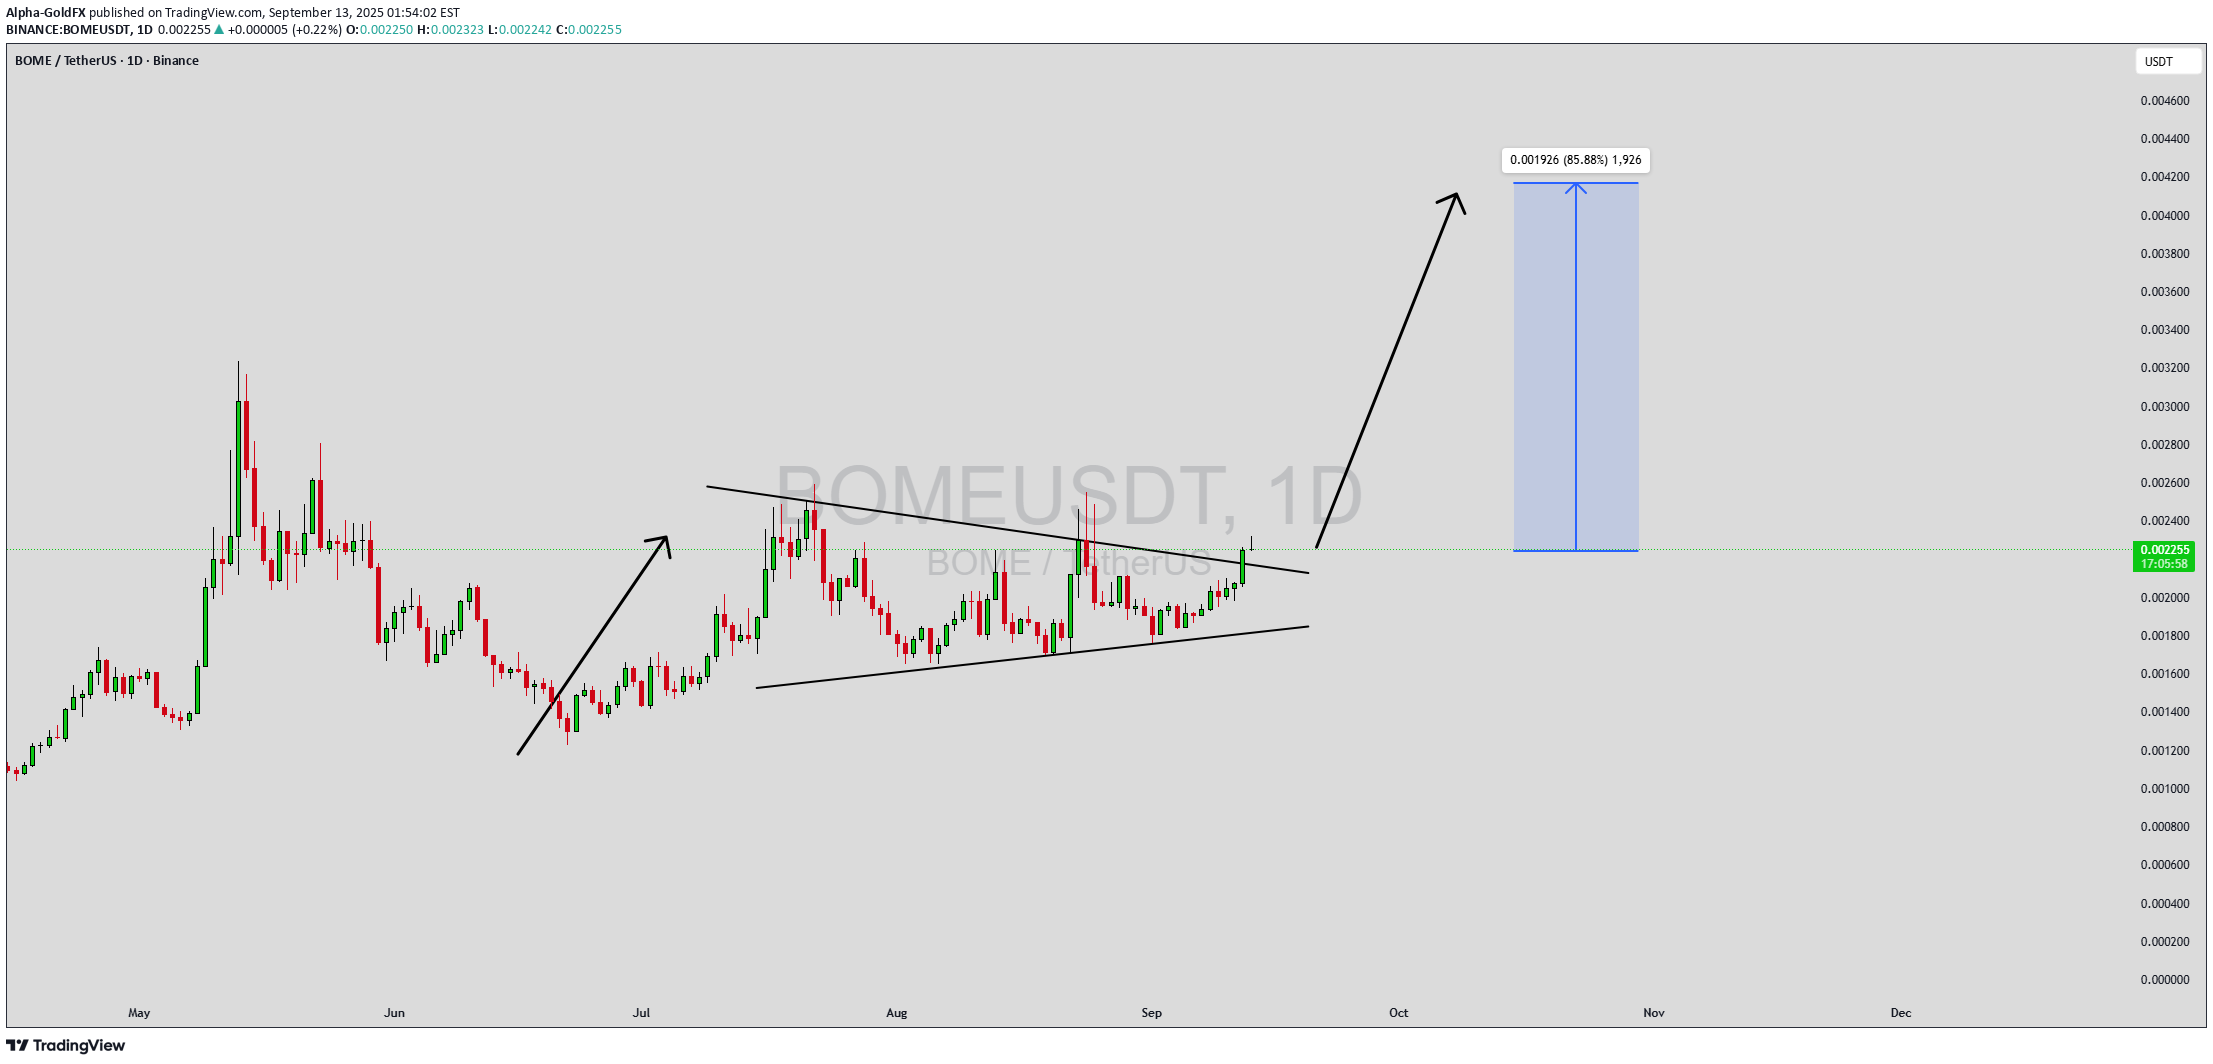
BOMEUSDT is currently forming a bullish pennant pattern, which often signals continuation of upward momentum after a strong rally. This consolidation phase, combined with steady trading volume, reflects investor confidence and positions the pair for a potential breakout to the upside. Market participants are increasingly taking interest, making this setup attractive for both traders and investors. The bullish pennant structure suggests that BOMEUSDT could gain strength once resistance is cleared, opening the path for a sharp upward move. Technical indicators are aligned with this view, as price action is holding above key support levels while showing signs of accumulation. A breakout confirmation would likely accelerate momentum, attracting more buyers into the market. With an expected gain projection of 70% to 80%+, this setup offers a favorable risk-to-reward ratio. Traders watching BOMEUSDT will be focused on upcoming candles to confirm bullish continuation. If momentum sustains, the pair could see strong upside performance in the short to medium term. ✅ Show your support by hitting the like button and ✅ Leaving a comment below! (What is You opinion about this Coin) Your feedback and engagement keep me inspired to share more insightful market analysis with you!

MasterAnanda
BOOK OF MEME · Leverage vs Spot · Should I Plan or Not?
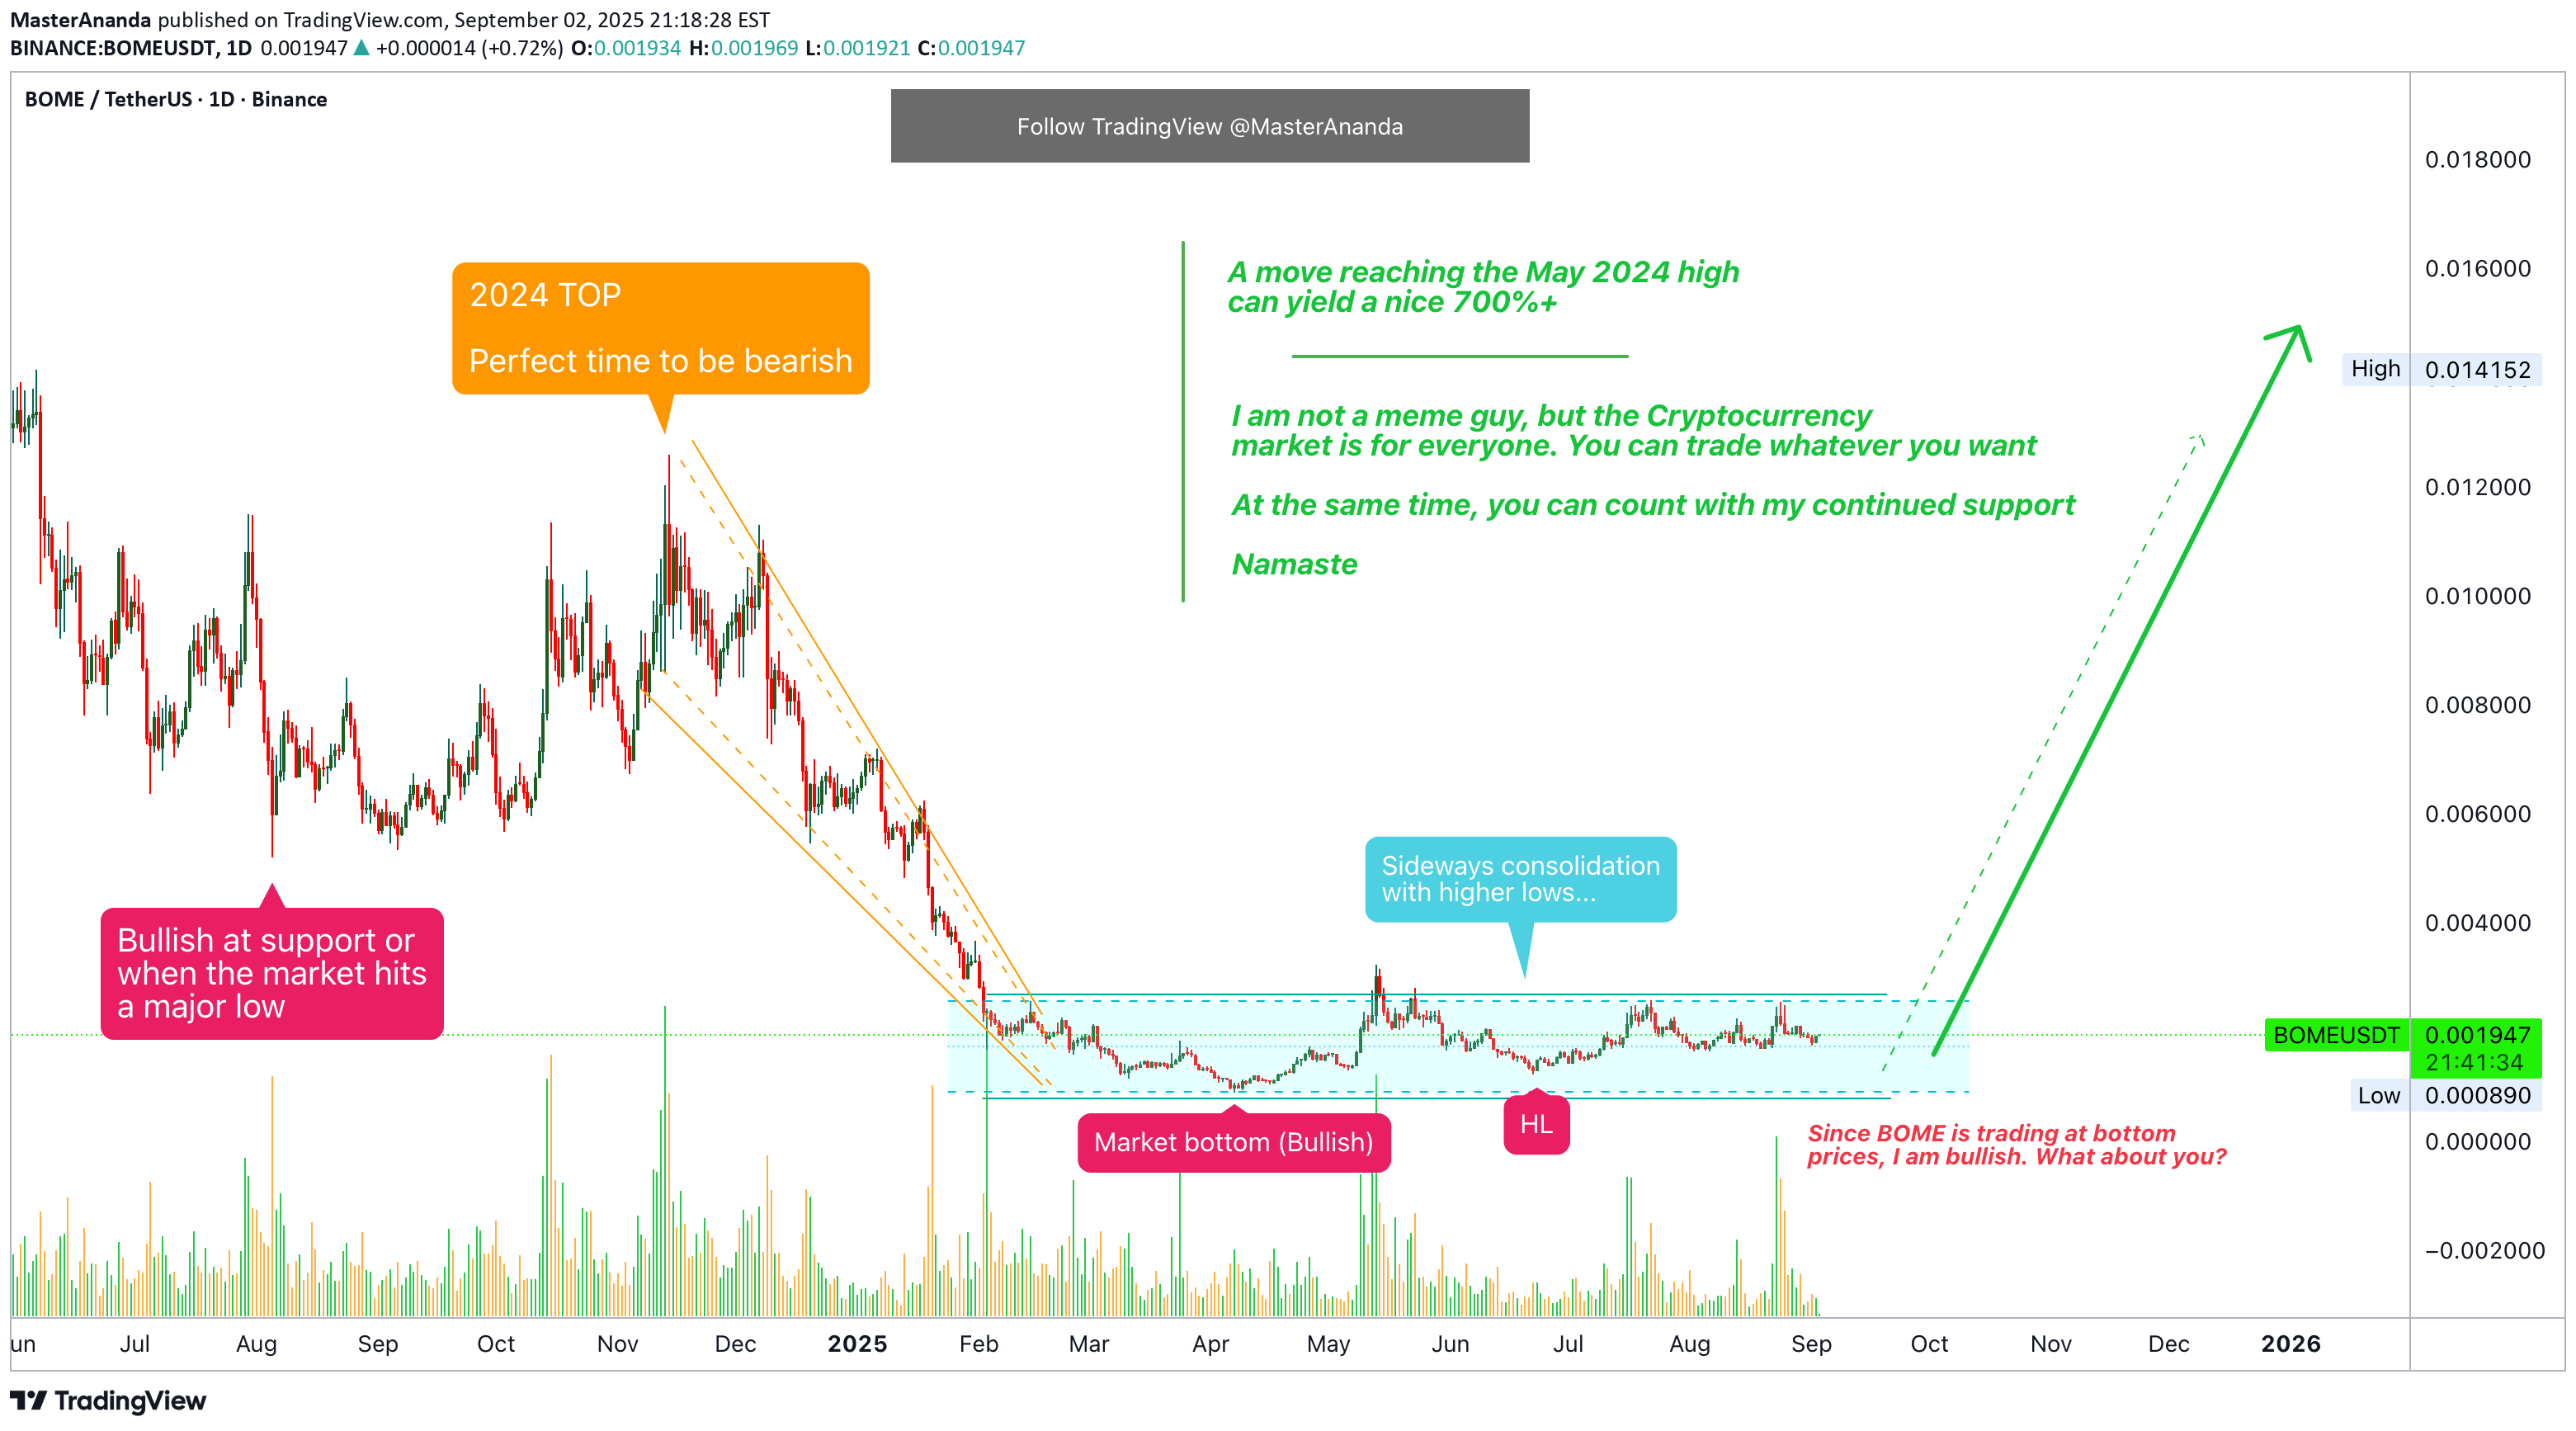
With the log chart we can focus on growth potential, the all-time high, highs and lows, the bigger picture, the chart structure and long-term cycles. With the linear chart, we can know the truth of a pair. Are we looking at a cycle top or bottom prices? BOMEUSDT (BOOK OF MEME) is bullish based on current price action and trading volume. Looking at this linear chart, it is easy to see BOME consolidating sideways after hitting bottom. It is easy to see a major cycle (left), a major crash and then the market going sideways. If I were to show a log chart, the action after February would be really pronounced and you would see lots of bullish and bearish moves. These are indeed happening but are minimum—small—compared to how the market actually moves. Market noise. If I were to focus on the short-term, I would have to become Nostradamus in order to be able to predict the next move. If I focus on the long-term as I usually do, I can easily predict what is going to happen next. As a group, we cannot beat the market because we are the market; but, there is no need to "beat" the market, we only need to make money and there are many ways to make money; choose what works for you. We choose low risk vs a high potential for reward. We choose simplicity and a strategy that works. Literally, just buy and hold. I understand leverage (margin) and I use it of course, but I cannot cry if I incur a major loss. I cannot cry, blame and complain if things go wrong; why? Because before making the first purchase, the first move; before making a decision or any trade, the first thing to consider, adapt and accept, is the fact that all money can be gone in a flash, that's the thing about leverage trades. If things go right, you get to win big but, if things go wrong, you get to lose everything... Not really, if you control your position size your risk is limited. Ok. Asymmetric risk/reward. Maximum 5% out of the risky trading capital goes on a single trade. It can be 3% or even 2% or 1%. If you can't make money slow, you won't be able to make it fast. Making money is an art and trading is the same. It is a craft, a profession, a job, a career; call it what you want, but it takes effort, and, since there are so many smart people doing the same, we have to be smart when we decide to participate. How can I be smart when trading? Build a plan before taking action. I love you. I am literally feeling true love right now as I write this, I hope it reaches you. Thanks a lot for your continued support, it is appreciated. Namaste.
Disclaimer
Any content and materials included in Sahmeto's website and official communication channels are a compilation of personal opinions and analyses and are not binding. They do not constitute any recommendation for buying, selling, entering or exiting the stock market and cryptocurrency market. Also, all news and analyses included in the website and channels are merely republished information from official and unofficial domestic and foreign sources, and it is obvious that users of the said content are responsible for following up and ensuring the authenticity and accuracy of the materials. Therefore, while disclaiming responsibility, it is declared that the responsibility for any decision-making, action, and potential profit and loss in the capital market and cryptocurrency market lies with the trader.