
BAKE
BakeryToken
| تریدر | نوع سیگنال | حد سود/ضرر | زمان انتشار | مشاهده پیام |
|---|---|---|---|---|
No results found. | ||||
Price Chart of BakeryToken
سود 3 Months :
سیگنالهای BakeryToken
Filter
Sort messages by
Trader Type
Time Frame

MMBTtrader
BAKEUSDT another 2x at least is cooking
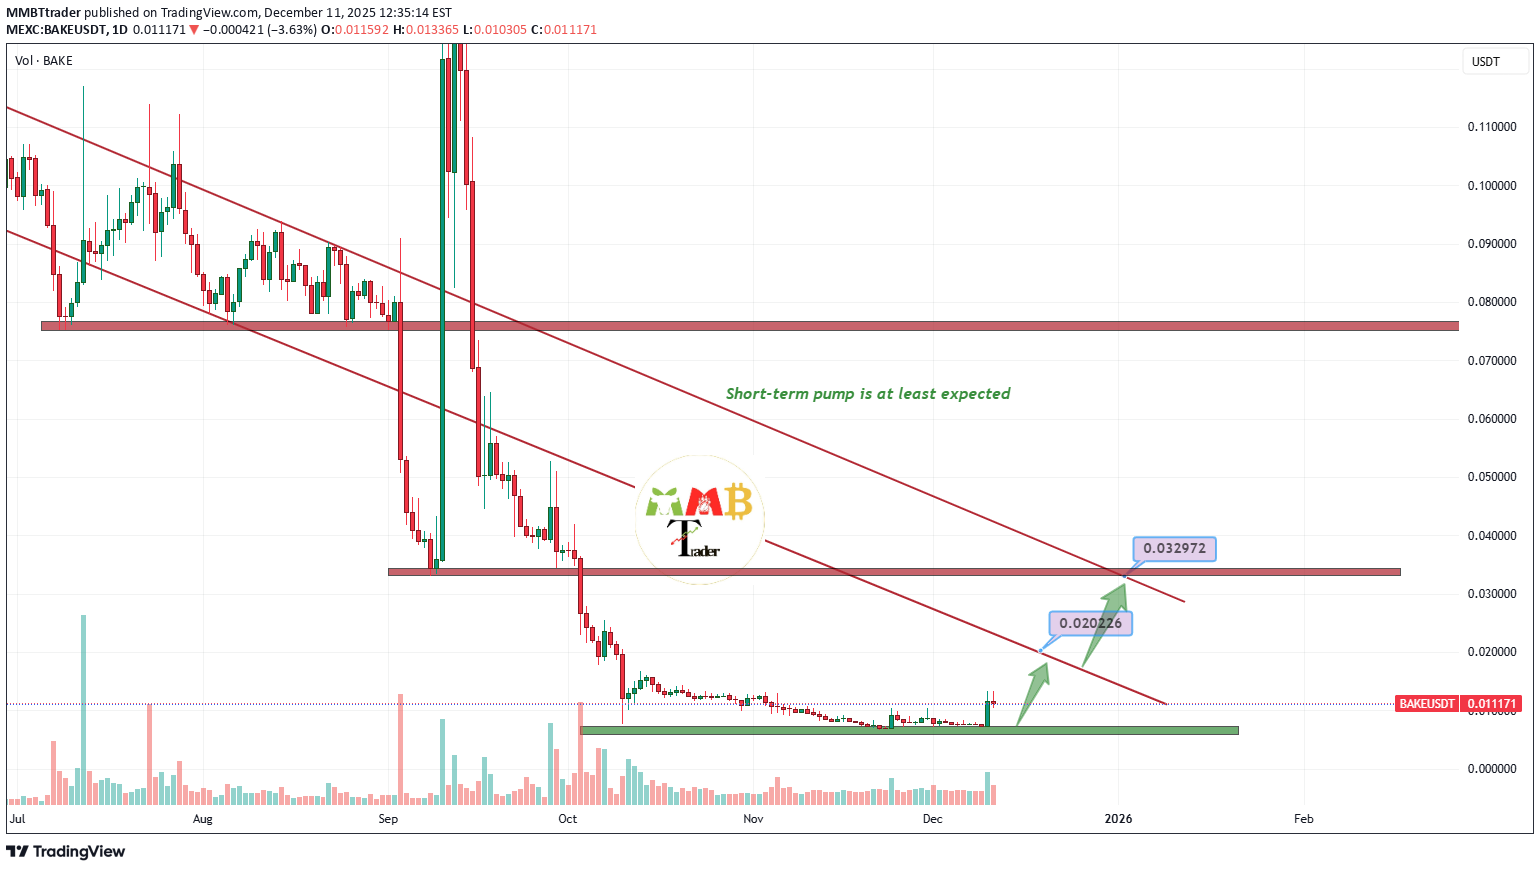
As observed on the chart, the price is currently testing a major daily support level, which has already catalyzed a strong rebound. The initial move, resulting in approximately 100% appreciation and supported by notably high trading volume, indicates substantial buying interest and validates the strength of this support zone.
Given this confirmed momentum and volume-backed conviction, the technical structure now suggests the potential for further appreciation. A sustained move from this level could project an additional 100% to 200% gain, provided the asset maintains its current momentum and the support zone continues to hold.
DISCLAIMER: ((trade based on your own decision))
<

sajjadfaheem365
سود آسان 1.3 برابری در چند روز: راز افزایش 5.5 برابری قیمت BAKE USDT!


Rating Agencies and the Risk Premium in Cross-Border Trade

1. Understanding Rating Agencies 1.1 Origins and Evolution Credit rating agencies emerged in the early 20th century with the rise of bond markets. Firms like Moody’s (1909), Standard & Poor’s (1916), and later Fitch (1924) pioneered systematic evaluations of borrowers’ ability to meet financial obligations. Initially, their focus was corporate and municipal bonds in the U.S., but as globalization expanded, they became central players in sovereign debt and international trade finance. 1.2 Functions of Rating Agencies Credit Evaluation: Assess the ability and willingness of borrowers (countries, companies, banks) to repay debt. Risk Communication: Provide standardized symbols (AAA, BB, etc.) that simplify complex financial risk. Market Signal: Ratings influence investor sentiment, government borrowing costs, and capital flows. Trade Facilitation: Enable exporters, importers, and financial intermediaries to price risk accurately. 2. The Concept of Risk Premium in Trade 2.1 Definition The risk premium is the excess return demanded by investors or lenders above the risk-free rate (often benchmarked against U.S. Treasuries) to compensate for uncertainties in lending or trading across borders. 2.2 Determinants of Risk Premium Sovereign Risk: Default probability of a government. Currency Risk: Volatility of exchange rates. Political Risk: Policy instability, regulatory unpredictability, corruption. Macroeconomic Risk: Inflation, growth volatility, balance of payments deficits. Legal and Institutional Risk: Strength of judicial systems, enforceability of contracts. 2.3 Link Between Ratings and Risk Premium Higher credit ratings → lower perceived risk → lower premiums. Downgrades → capital flight, higher borrowing costs, reduced competitiveness in trade. Upgrades → cheaper financing, enhanced investor confidence, greater access to cross-border trade credit. 3. How Rating Agencies Influence Cross-Border Trade 3.1 Sovereign Ratings and Trade Finance Exporters and importers rely heavily on sovereign ratings. For example, a downgrade of a country from investment grade (BBB-) to junk (BB+) leads to higher trade financing costs, discouraging importers from accessing credit lines. 3.2 Corporate Ratings and International Borrowing Multinational corporations operating in emerging markets often borrow in international bond markets. Their corporate ratings are closely tied to their home country’s sovereign ceiling. This directly impacts their ability to secure financing for large-scale trade projects. 3.3 Impact on Foreign Direct Investment (FDI) FDI flows often follow rating signals. Countries with higher ratings attract more stable FDI inflows, which in turn improve their export capacity and competitiveness. 3.4 Role in Insurance and Hedging Insurance providers (like export credit agencies or private insurers) use ratings to price political risk insurance, export guarantees, and hedging contracts. A downgrade inflates premiums, raising the cost of trade deals. 4. Case Studies 4.1 The Asian Financial Crisis (1997–1998) During the Asian crisis, rating agencies rapidly downgraded countries such as Thailand, Indonesia, and South Korea. This triggered massive capital outflows, widened spreads on sovereign bonds, and raised the cost of trade financing. Critics argue agencies acted procyclically—exacerbating the crisis instead of signaling risks earlier. 4.2 The Eurozone Debt Crisis (2010–2012) Countries like Greece, Portugal, and Spain saw their ratings slashed. Borrowing costs skyrocketed, with spreads over German bunds widening dramatically. Trade flows contracted as financing became prohibitively expensive. The crisis underscored how rating downgrades could destabilize entire regions. 4.3 Emerging Markets Today For countries like India, Brazil, or South Africa, ratings directly affect the credit default swap (CDS) spreads and cost of issuing international trade bonds. Upgrades reduce premiums, attracting more exporters and foreign partners. 5. Methodologies of Rating Agencies 5.1 Quantitative Metrics GDP growth rate and stability Fiscal deficit and debt-to-GDP ratio Inflation and currency stability External balances and foreign reserves 5.2 Qualitative Metrics Political stability and governance quality Institutional independence (central bank, judiciary) Corruption perception Policy predictability 5.3 Limitations Heavy reliance on past data (lagging indicator) Possible biases toward developed economies Susceptibility to political pressure and conflicts of interest 6. Criticisms of Rating Agencies 6.1 Procyclicality Agencies tend to downgrade after crises erupt, worsening investor panic. This magnifies risk premiums and creates a feedback loop of rising costs and falling confidence. 6.2 Conflicts of Interest The “issuer-pays” model means rating agencies are compensated by the very firms or governments they rate. This raises concerns of inflated ratings before crises (e.g., mortgage-backed securities before the 2008 financial meltdown). 6.3 Western-Centric Bias Many emerging economies argue agencies apply stricter standards to them than to developed nations. For instance, Japan maintains high debt-to-GDP ratios but often retains relatively strong ratings compared to emerging economies with lower debt burdens. 6.4 Market Oligopoly Three agencies (S&P, Moody’s, Fitch) control more than 90% of the global ratings market, creating limited competition and potential systemic bias. 7. Implications for Cross-Border Trade 7.1 Higher Transaction Costs Downgrades lead to higher costs of letters of credit, trade insurance, and export guarantees. 7.2 Reduced Competitiveness of Emerging Economies Countries downgraded to “junk” often lose access to affordable international trade finance, limiting their export-driven growth strategies. 7.3 Shifts in Trade Partnerships Countries facing higher premiums may pivot toward alternative trade partners or rely more on bilateral agreements and currency swaps to bypass rating-driven constraints. 8. Alternative Models and Future Directions 8.1 Regional Rating Agencies Asia, Africa, and Latin America are increasingly exploring regional credit rating agencies to counterbalance Western dominance and better reflect local conditions. 8.2 Role of Technology Big Data & AI: Machine learning models could provide real-time credit risk assessment based on wider datasets (trade flows, political events, satellite data). Blockchain & Transparency: Smart contracts and decentralized finance may reduce dependence on centralized agencies. 8.3 ESG Ratings Environmental, Social, and Governance (ESG) criteria are becoming central to global trade finance. Agencies are developing frameworks to integrate sustainability risks into credit ratings, affecting long-term premiums. 8.4 Rise of Sovereign Wealth Funds & Development Banks Institutions like the BRICS Bank or Asian Infrastructure Investment Bank are offering alternative sources of finance, reducing reliance on ratings-driven capital markets. 9. Policy Implications 9.1 For Governments Maintain macroeconomic stability to secure strong ratings. Diversify financing sources (e.g., regional development banks, local currency bonds). Engage in transparent communication with agencies and investors. 9.2 For Corporates Focus on governance and disclosure to improve ratings. Use risk management tools (hedging, insurance) to mitigate rating-driven premiums. Build cross-border partnerships to share risks. 9.3 For Global Regulators Encourage competition among rating agencies. Reduce reliance on ratings in regulatory frameworks (Basel III reforms). Develop global standards for ESG integration. 10. Conclusion Rating agencies play a pivotal role in shaping the risk premium in cross-border trade. Their ratings influence borrowing costs, trade financing, insurance pricing, and investment flows. A higher rating translates into lower premiums, opening doors for greater participation in global trade, while downgrades can choke access to capital and raise transaction costs. Yet, the dominance of a few Western-based agencies, their procyclical behavior, and perceived biases remain pressing concerns. As the global economy becomes more multipolar, alternative rating frameworks, technological innovations, and regional cooperation will redefine the landscape of risk assessment. In the future, the balance between market trust, institutional credibility, and technological transparency will determine how rating agencies evolve and how risk premiums are priced in the global trading system.

volkanakman82
BAKE MUHTEŞEM GRAFİK
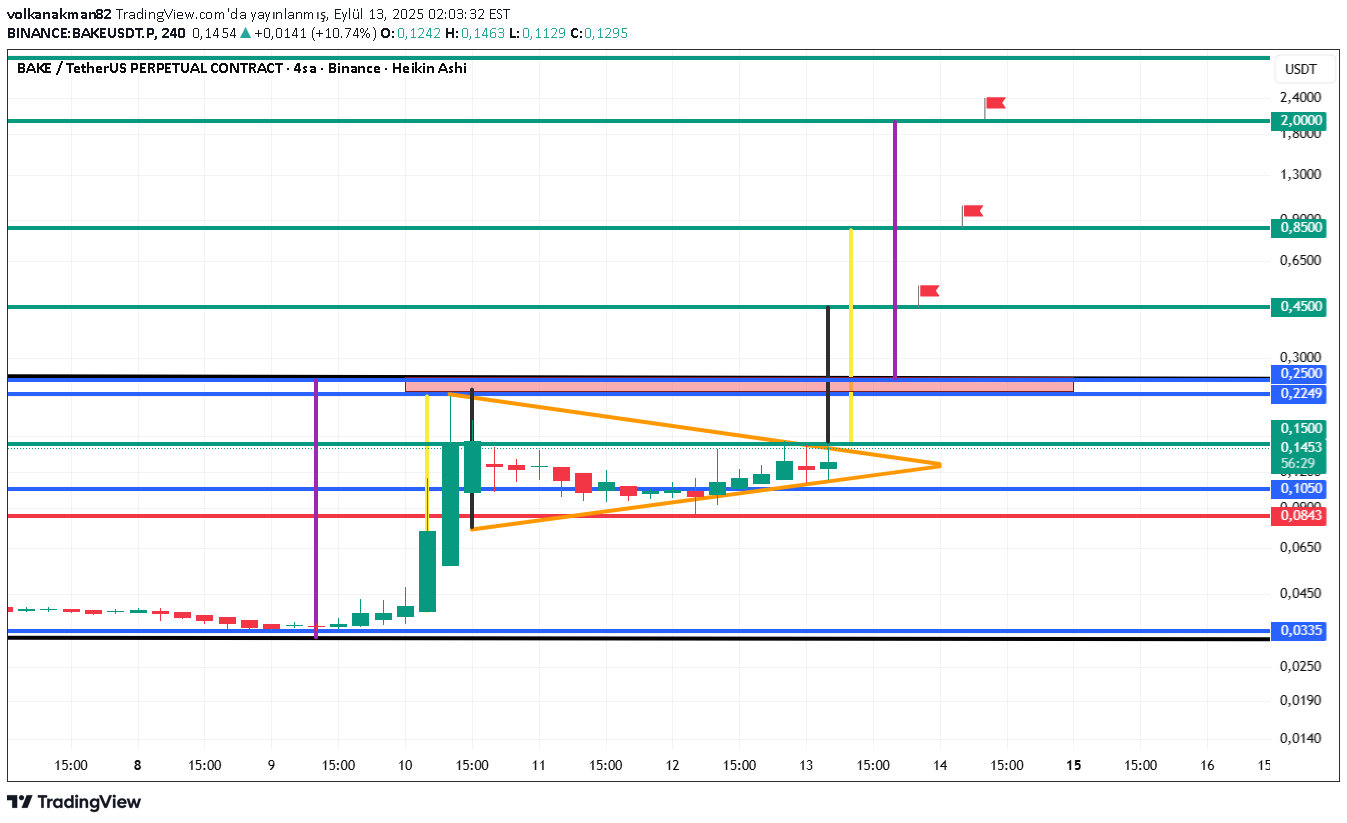
I wanted to share the magnificent graph of bake If it will be negative below 0.1050 BAKE If you successfully pass the 0.22-0.25 zone and make daily closing on it; * Target 1: 0.45 Symmetry Triangle Length Target (Provided With the Condition of Fracture & Staying over 0.15) * Target 2: 0.85 Taurus pennant target (Provided with the condition of breakage & stay over 0.45) * Target 3: 2 Dip-Zirve Channel Target (Provided With the Condition of Breaking & Staying over 0.85) Good luck
volkanakman82
BAKE TAHMİN
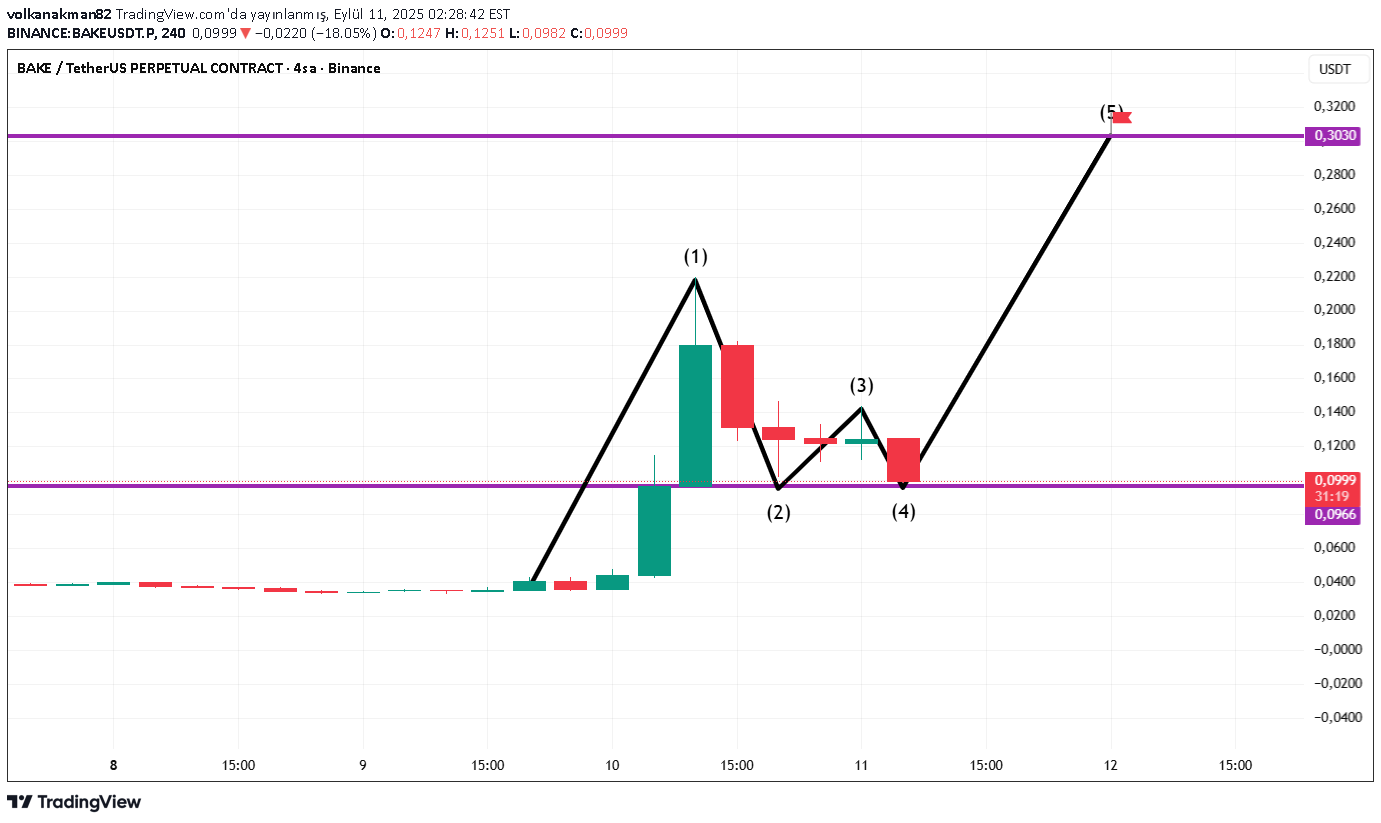
It is a prediction graph except for news flows. good luck

CriptoSolutions
500% in one day
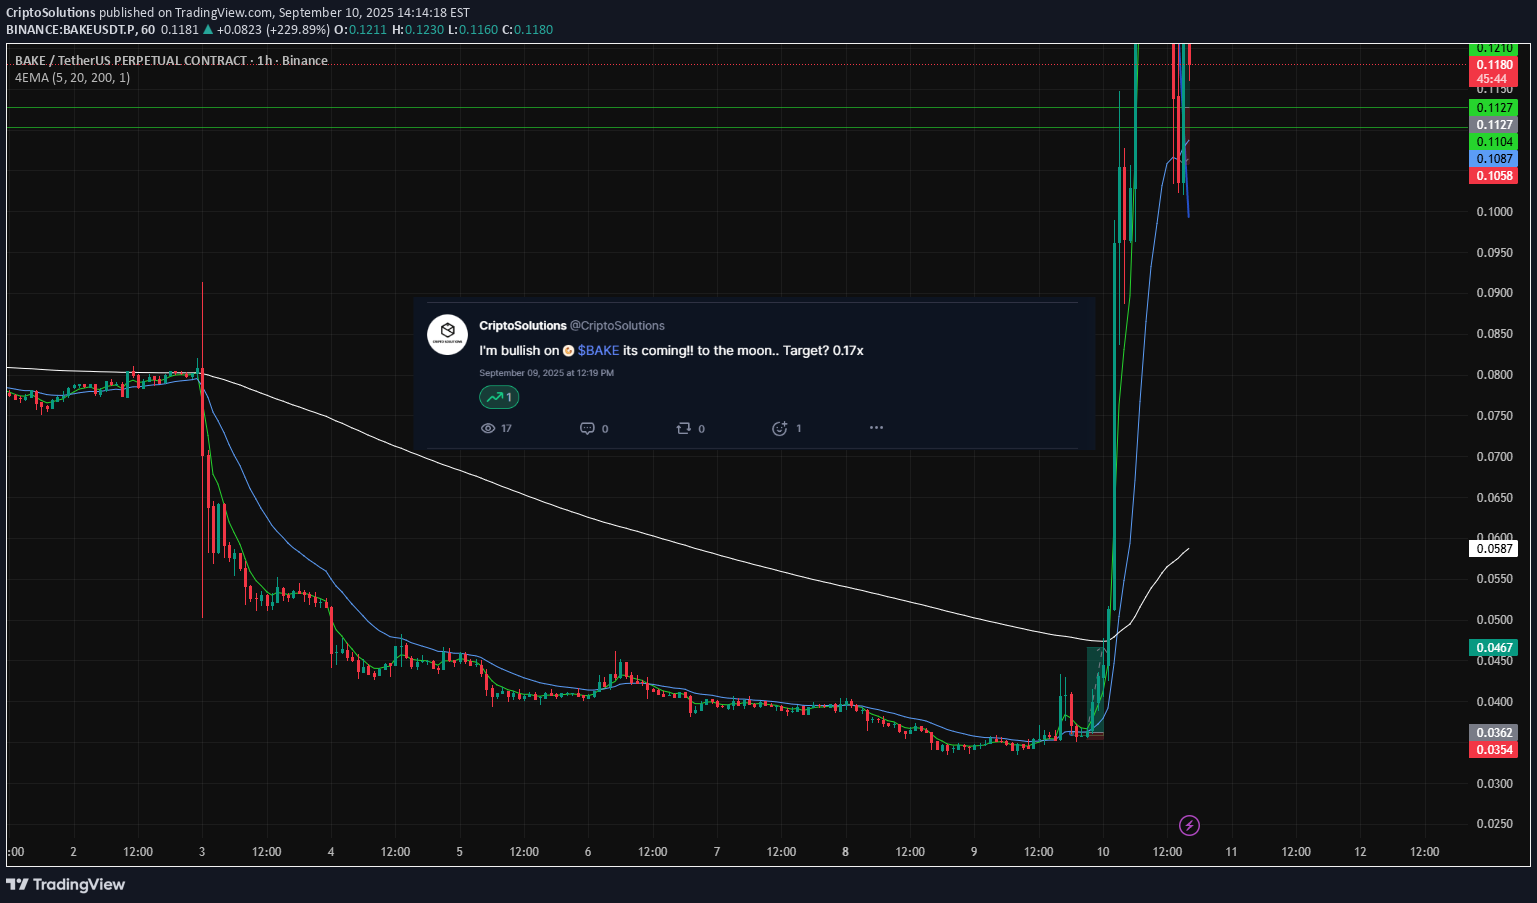
Yesterday at 12 noon I published an announcement in CMC about Bake, after the already known fundamentals, everyone sent $bake to 0, but... something told me that the opposite would happen, I started playing with the volume and the M.CAP looking for the best entry zone. In my TG group I passed the order for them to get in, and the rest was history, not only that, but I anticipated what would be the area I would go to look for that was outside of any forecast, Binance whenever it announces things we have to take into account WHAT project is behind it, what power it has, what option it had and what probability there is that it will generate a sudden movement like the one that occurred yesterday, my prediction was EXACT, from the entry point to the exit point https://t.me/cstradingacadmy https://coinmarketcap.com/community/post/367990372/

SuperTradeish
BakeryToken Bake Coin Price Prediction and Technical Analysis
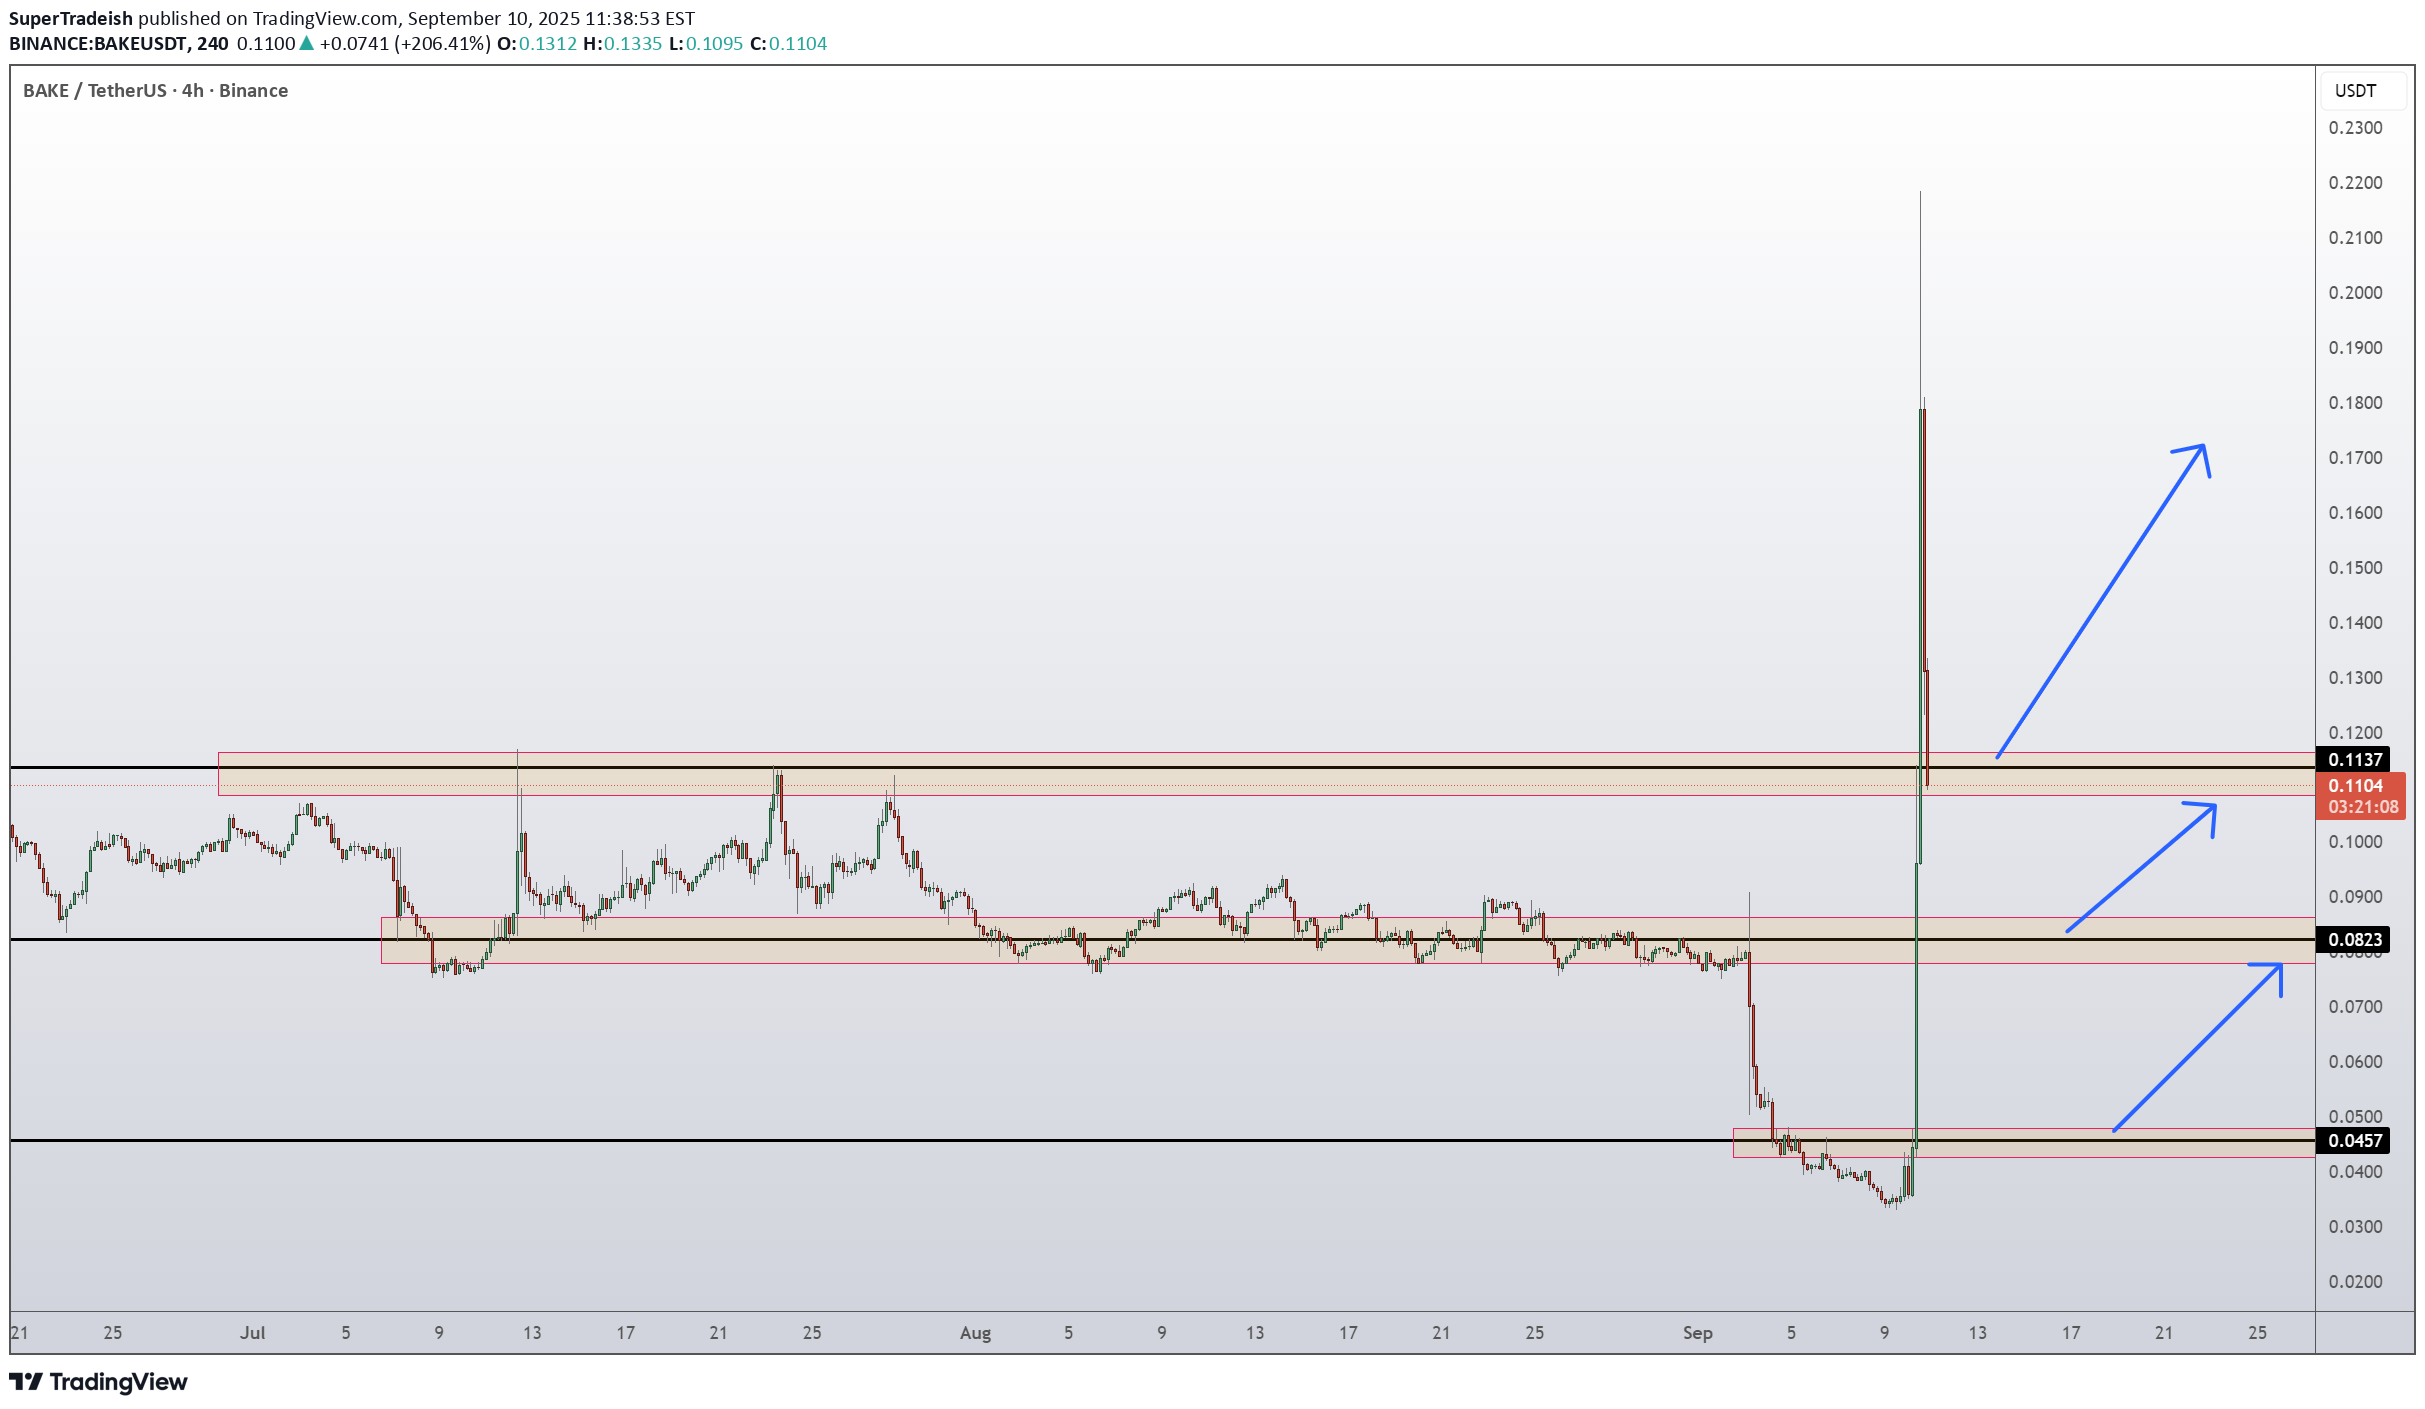
BAKE/USDT just made a massive spike from the 0.0457 demand base, reclaiming lost ground after weeks of decline. Price has now surged into the 0.1137–0.1150 resistance zone, where sellers are showing signs of pressure. If bulls manage to hold above this reclaimed level, continuation toward 0.1820 looks possible. However, if price fails here, a healthy pullback toward 0.0823 support could unfold before another attempt higher. 📈 Key Levels: Buy trigger: Retest/hold above 0.1137 support-turned-demand Buy zone: 0.0823 – 0.1137 region Target 1: 0.1820 resistance Target 2: Extension toward 0.20+ if momentum continues Invalidation: Daily close below 0.0457 (would negate the bullish recovery) 👉 Follow me for More Real Time Opportunities. Share your Thoughts if you have any?

Crypto-by-PRIME


Alpha-GoldFX
BAKEUSDT Forming Falling Wedge

BAKEUSDT is presenting an interesting breakout scenario after forming a clean falling wedge pattern on the daily chart. Falling wedges are typically bullish reversal patterns, especially when confirmed by a breakout with volume. In this case, the wedge appears to be breaking to the upside, supported by a noticeable uptick in buying volume. Technical projections are pointing toward a potential price increase of 90% to 100%+, making this setup a valuable opportunity for swing traders and momentum investors. BAKE (BakeryToken) remains an integral part of the DeFi and NFT landscape, particularly within the Binance Smart Chain ecosystem. Its utility, paired with renewed market attention and increased community engagement, could act as a fundamental driver behind this projected upward move. With the crypto market gradually rotating back into altcoins, BAKE could benefit from speculative capital flowing into undervalued DeFi assets. Traders should keep a close watch on key resistance breakouts and continuation volume patterns. A confirmed daily candle close above the wedge resistance would further validate the bullish breakout thesis. Additionally, historical price action shows that BAKE has the potential to move sharply once momentum kicks in, offering a favorable risk-to-reward setup. Overall, the technicals align well with rising investor sentiment. If the broader crypto environment stays supportive, BAKEUSDT could see a strong recovery rally in the short to mid term. ✅ Show your support by hitting the like button and ✅ Leaving a comment below! (What is You opinion about this Coin) Your feedback and engagement keep me inspired to share more insightful market analysis with you!
CryptoPRIME_1855
BAKE / USDT : Breakout Potential

BAKE/USDT - Breakout Potential BAKE/USDT has recently broken above a key resistance zone and is attempting a trend reversal. With the trendline resistance already broken, we are expecting a bullish move towards the $0.124 target, which represents a potential gain of 116.5% from the current price. Bullish Scenario: Breakout above the resistance zone confirms the trend reversal, targeting $0.124 with a +116.5% upside. Pro Tip: Look for strong volume confirmation during the breakout. Set stop losses just below the breakout level for risk management.
Disclaimer
Any content and materials included in Sahmeto's website and official communication channels are a compilation of personal opinions and analyses and are not binding. They do not constitute any recommendation for buying, selling, entering or exiting the stock market and cryptocurrency market. Also, all news and analyses included in the website and channels are merely republished information from official and unofficial domestic and foreign sources, and it is obvious that users of the said content are responsible for following up and ensuring the authenticity and accuracy of the materials. Therefore, while disclaiming responsibility, it is declared that the responsibility for any decision-making, action, and potential profit and loss in the capital market and cryptocurrency market lies with the trader.