
AVA
Travala.com
| تریدر | نوع سیگنال | حد سود/ضرر | زمان انتشار | مشاهده پیام |
|---|---|---|---|---|
 alfraRank: 34620 | خرید | حد سود: ۰٫۵ حد ضرر: ۰٫۳۴ | 10/22/2025 |
Price Chart of Travala.com
سود 3 Months :
سیگنالهای Travala.com
Filter
Sort messages by
Trader Type
Time Frame
alfra
فرصت خرید طلایی تراوالا (AVA): آیا این کف قیمتی برای سود دو برابری کافی است؟

AVA is trading near a long-term support zone around $0.37, a level that has repeatedly acted as a historical floor. The token has been consolidating for months within a descending channel, and current price action suggests potential accumulation. The broader trend remains neutral-to-bearish, but momentum indicators such as RSI are nearing oversold territory, hinting at possible reversal conditions. A breakout above the descending trendline and the 50-EMA could open the door to a short-term rally toward $0.47–$0.50. The key medium-term resistance is at $0.78 — roughly a 2× move from current levels. If price manages to close above that mark on strong volume, it would confirm a structural breakout and could trigger a broader bullish shift across the chart, with potential to revisit the $1+ region over time. Fundamentally, Travala has maintained a notable relationship with Binance and CZ (Changpeng Zhao). Binance previously backed TravelbyBit, which later merged with Travala, and the project migrated to Binance Chain early on. CZ has publicly acknowledged Binance’s early investment, and historically his mentions of AVA have driven strong upside volatility — showing that sentiment around Binance can directly influence AVA’s momentum. Trade idea: Entry zone: $0.37 – $0.42 (support region) Take-profit 1: $0.50 Take-profit 2 / Key resistance: $0.78 Stop-loss: below $0.34 (confirming support breakdown) Overall, AVA offers an asymmetric setup: limited downside near historical lows, with potential for a significant upside if the $0.78 barrier breaks. Watch for volume confirmation and Binance-related sentiment as catalysts.

Juliia
آوا (AVA) آماده انفجار ۲۰۰ درصدی؟ تحلیل کامل و اهداف قیمتی جدید
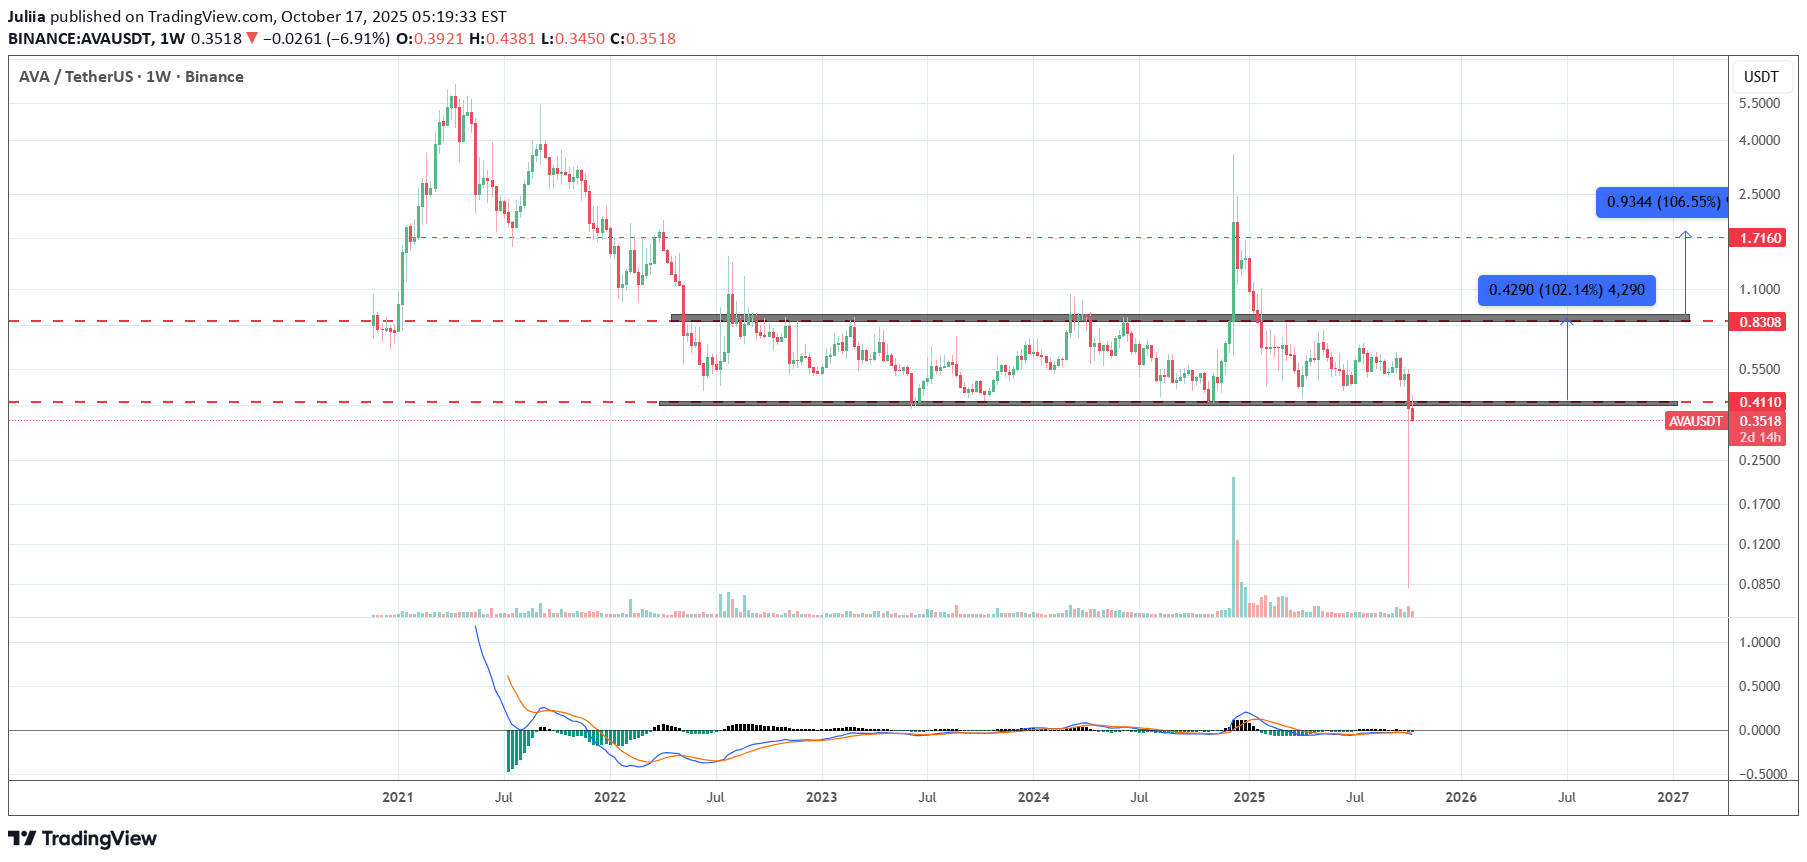
AVA looks very interesting for the long term if it reclaims the $0.40 level. There’s potential for a 200% profit. If the level is reclaimed, it would be a fake breakdown of the range. In that case, the prolonged accumulation would be a consolidation phase, which usually leads to a strong breakout. The longer the accumulation, the stronger the trend. Targets: $0.80 and $2.00. Added to my watchlist.

JBDigital_Network


TraderWolfx

If the apparent structure of AVAX is an accumulation scheme, it can be tracked upon completion or during the manipulation phases of the flowing price. However, if this is a distribution, when you become aware of it, you become the liquidity. So what should be done; power demonstrations and pivots should be monitored patiently

CryptoNuclear
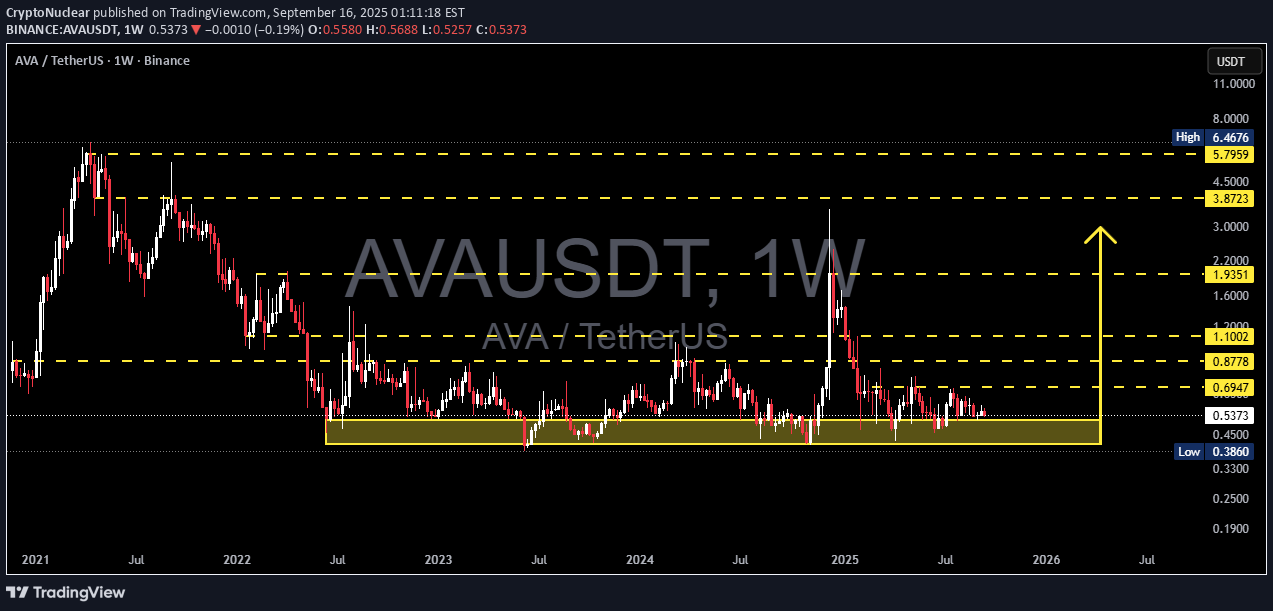
📌 Overview The AVA/USDT weekly chart shows a dramatic journey: From the 2021 peak ($6–7), price has been in a prolonged downtrend followed by sideways consolidation since 2022. For nearly 3 years, the yellow zone ($0.38 – $0.45) has acted as a battlefield between buyers and sellers. Each test of this area has resulted in strong rebounds, marking it as a major demand zone. Now, AVA is once again hovering near this critical support. The big question: Is this the ultimate long-term accumulation zone or the start of a deeper breakdown? --- 🔍 Pattern & Structure Analysis Macro trend: Bearish since 2021 → long consolidation from 2022–2025. Dominant pattern: Wide sideways range with a solid base at 0.38–0.45 and tiered resistances at 0.69, 0.87, 1.10, 1.93. Price character: Multiple lower wicks into demand zone → sign of liquidity grabs and potential accumulation by bigger players. Prolonged sideways near lows suggests a possible bottoming formation. However, compression against support can also lead to a breakdown if bulls lose control. --- 🟢 Bullish Scenario If buyers defend 0.38–0.45 and push higher: 1. First confirmation: Weekly close above 0.6947. 2. Upside targets: 0.8778 → first mid-term resistance. 1.1002 → psychological & structural breakout zone. 1.9351 → major resistance, early trend reversal confirmation. 3. With strong momentum, a revisit of 3.87 – 5.79 (the 2021 supply zone) remains possible in the next bull cycle. (Potential gains: +63% to 0.87 / +105% to 1.10 from current price ~0.53). --- 🔴 Bearish Scenario If a strong weekly close below 0.386 occurs: 1. The 3-year demand zone will fail → showing buyers have lost control. 2. Downside target: 0.25 – 0.19 as the next realistic demand area. 3. Extreme measured-move projection even points to 0.07 (though unlikely, it must be considered). (Downside risk: −53% to 0.25 from current price). --- 📊 Key Takeaways $0.38–0.45 = pivotal demand zone for AVA’s next cycle. Breakout above 0.69 = early bullish signal. Breakdown below 0.38 = opens risk of new all-time lows. This zone will decide whether AVA enters a new accumulation phase or faces final capitulation. --- Critical demand zone = 0.38–0.45. Watch 0.6947 breakout for bullish bias. Watch 0.386 breakdown for bearish continuation. Momentum will reveal if this is smart money accumulation or a last leg down. --- #AVA #AVAUSDT #CryptoAnalysis #WeeklyChart #Altcoins #TechnicalAnalysis #SupportResistance #CryptoTrading #ChartPatterns

stanleycrypto_1

AVA is testing a key descending trendline on the 6H chart. A breakout above this level could trigger strong upside momentum. Immediate targets are $0.5605, $0.6237, and $0.6776 with the potential to reach $0.7690. I'm watching for breakout confirmation. DYOR, NFA.
CryptoNuclear
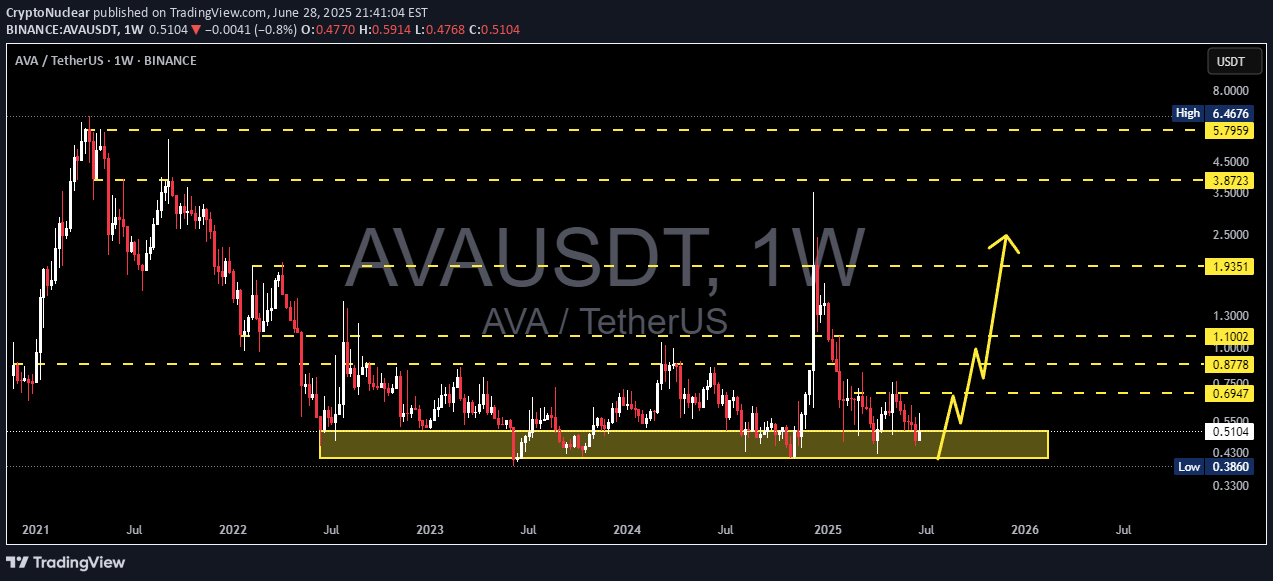
📊 Technical Breakdown:Major Accumulation Zone (Strong Support):Price is currently trading within a long-term accumulation zone between $0.3860 - $0.5095 (highlighted in yellow). This zone has been tested multiple times since 2022 and has proven to be strong support.Reversal Potential:A projected upward movement from this support zone suggests a potential bullish reversal. Historically, AVA has shown strong rebounds from this area. A breakout with bullish weekly candles will likely confirm the uptrend.🎯 Key Resistance Targets (Upon Successful Breakout):1. $0.6947 – First major resistance, crucial for trend confirmation.2. $0.7504 - $0.8778 – Short-term profit-taking zones.3. $1.1002 - $1.9351 – Medium-term targets with historical consolidation.4. $3.8723 - $5.7959 – Long-term targets if a full bull cycle resumes.📉 Risk Management:A breakdown below the accumulation zone (below $0.3860) will invalidate the bullish setup.Beware of fakeouts — wait for weekly candle confirmation before entering.📌 Conclusion:AVA is at a critical juncture, sitting on a historically strong accumulation base. A breakout could ignite a significant bullish rally toward key resistance levels. Ideal entry lies near the current support with a tight stop-loss strategy.#AVA #AVAUSDT #CryptoAnalysis #AltcoinSetup #TechnicalBreakout #BullishReversal #SupportZone #SwingTrade #Binance #CryptoSignals

alirezaprbd

here is at the deep. you must buy here 3x easilyGoodluck

FrankFx14

Price just rejected hard from the major Supply Zone (0.704 – 0.739) — look at that strong bearish reaction after tapping into high-volume resistance. This zone also aligns with a visible peak in the Volume Profile, signaling strong seller interest.What’s happening now?Price is currently trading at 0.673, just below the key resistance.Immediate support sits at 0.606, and a break below that opens the gate to 0.498 (previous demand + high volume node).Momentum looks exhausted after the spike, and the market structure hints at a possible reversal to the downside.Key Zones to Watch:Supply Zone: 0.704 – 0.739Immediate Support: 0.606Major Demand Zone: 0.450 – 0.498Trade Idea:If we see a lower high around 0.680 – 0.700, I’m looking for short opportunities targeting 0.606, and possibly 0.498 if the bearish pressure continues.Bearish confirmation will be stronger once we get a clean break + retest below 0.606.What do you think? Will AVAUSD crash from here or bounce again? Drop your thoughts below!#AVAUSD #CryptoAnalysis #PriceAction #SupplyDemand #VolumeProfile #FrankFx

NoorHub

Forming higher lows. Break above resistance may trigger strong upside.AVAUSDT
Disclaimer
Any content and materials included in Sahmeto's website and official communication channels are a compilation of personal opinions and analyses and are not binding. They do not constitute any recommendation for buying, selling, entering or exiting the stock market and cryptocurrency market. Also, all news and analyses included in the website and channels are merely republished information from official and unofficial domestic and foreign sources, and it is obvious that users of the said content are responsible for following up and ensuring the authenticity and accuracy of the materials. Therefore, while disclaiming responsibility, it is declared that the responsibility for any decision-making, action, and potential profit and loss in the capital market and cryptocurrency market lies with the trader.