
API3
API3
| تریدر | نوع سیگنال | حد سود/ضرر | زمان انتشار | مشاهده پیام |
|---|---|---|---|---|
No results found. | ||||
Price Chart of API3
سود 3 Months :
سیگنالهای API3
Filter
Sort messages by
Trader Type
Time Frame

yassoo-x2
شکست خط روند نزولی API3/USDT: آیا صعود به تارگتهای 0.84 تتر ممکن است؟
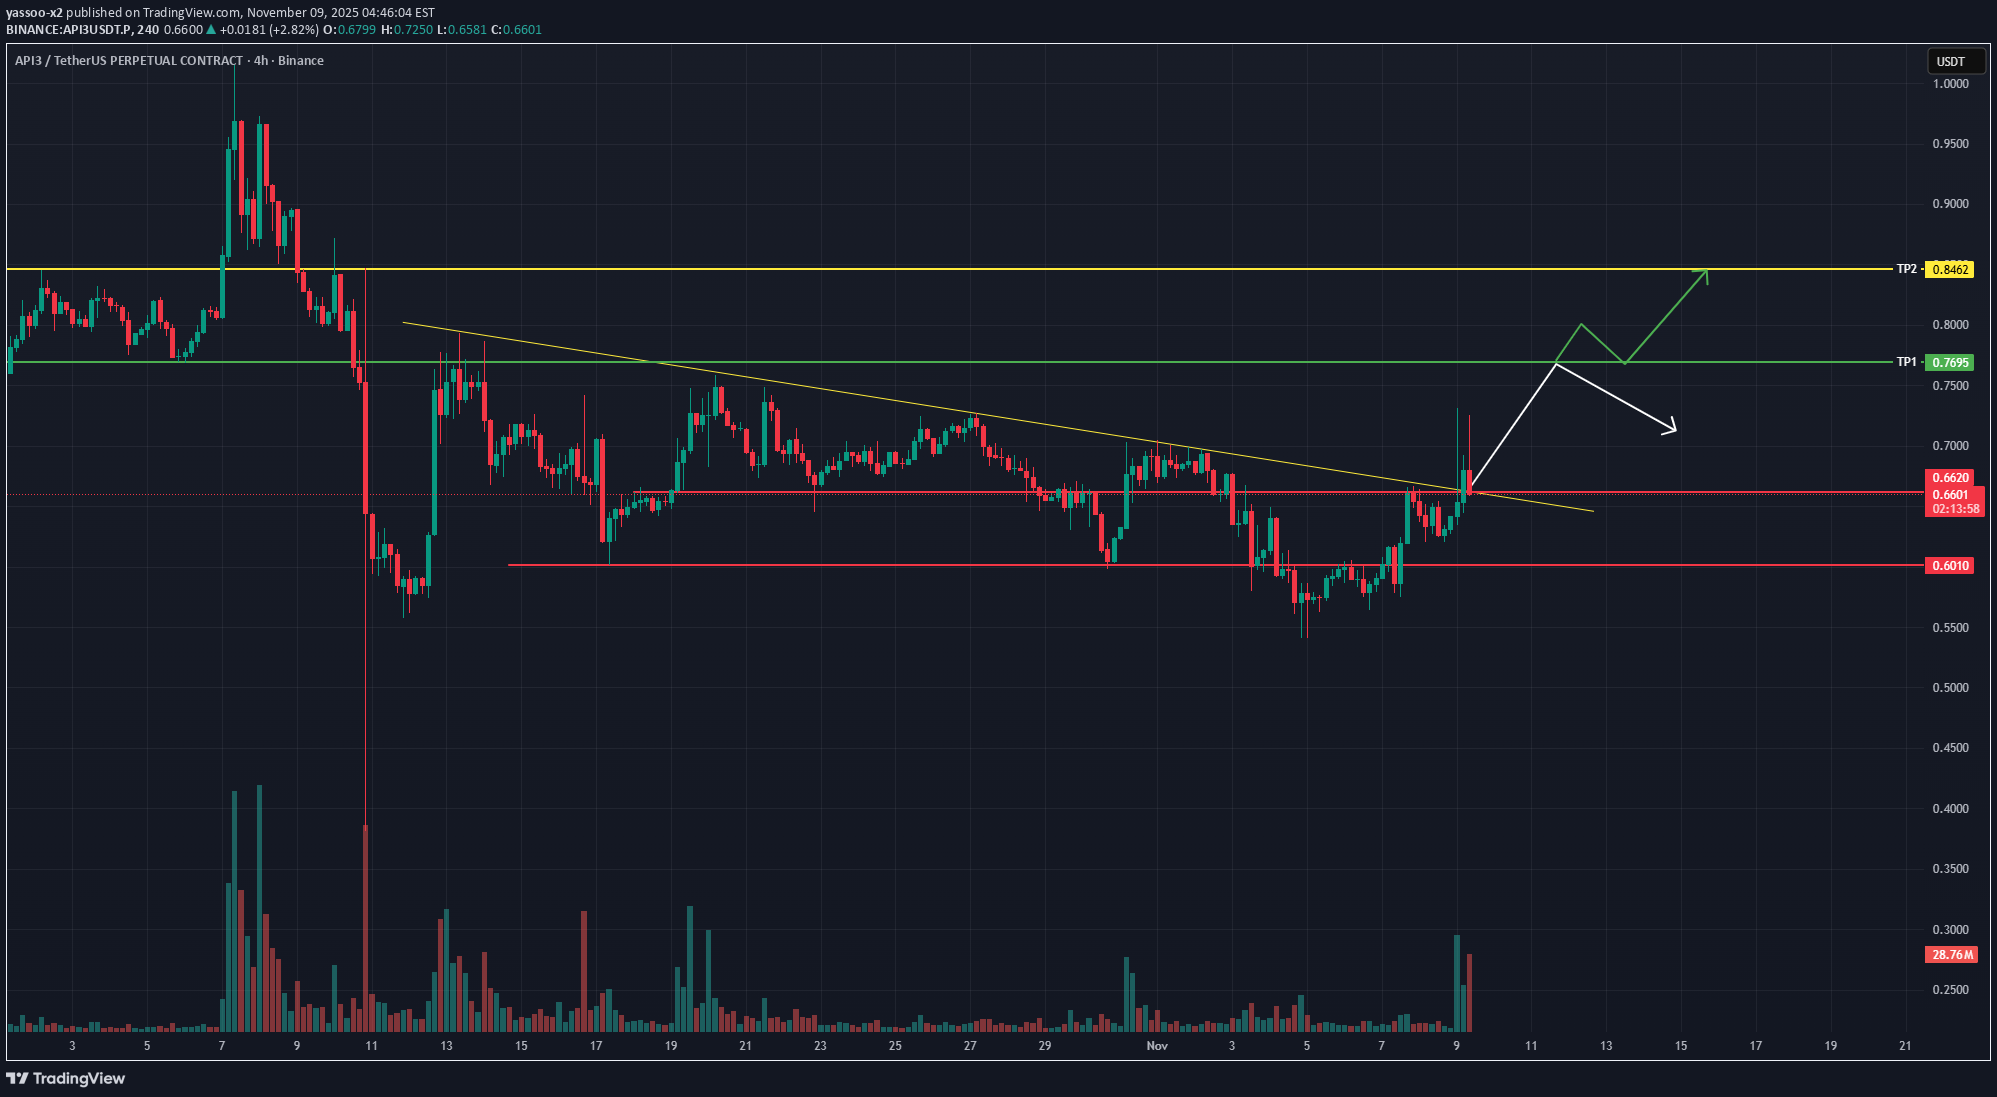
The price has successfully broken out of the descending trendline, showing early signs of bullish momentum. If this breakout holds, potential targets are: 🎯 TP1: 0.7695 🎯 TP2: 0.8462 Support levels to watch for possible retest: 🟥 0.6620 and 0.6010 A healthy retest followed by strong volume confirmation could lead to a continuation toward higher levels. 📊 Breakout confirmed – waiting for retest and confirmation candle.

X3Alpha
آینده API3/USDT: سطوح قیمتی بعدی که نباید از دست بدهید!
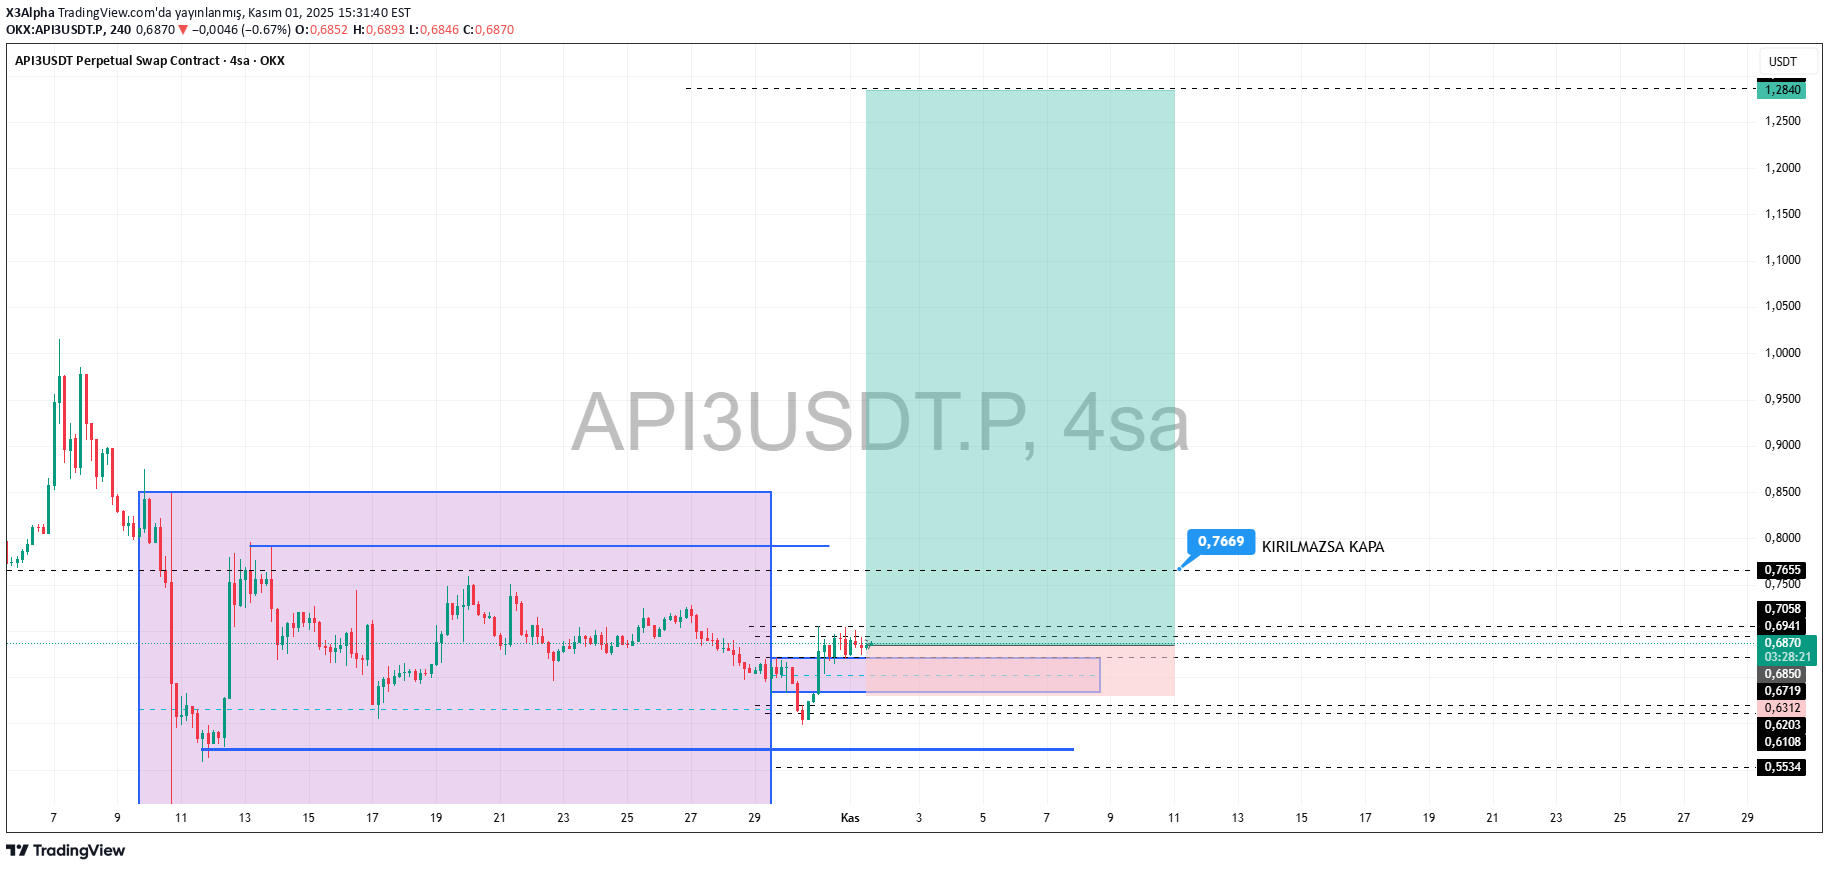
API3 We tried to find the level it could reach if it continues to gain value. We are watching the scenario on the chart carefully. Good luck...
yassoo-x2
تشکیل کف دوقلو در API3USDT: آیا این نشانه صعود انفجاری است؟
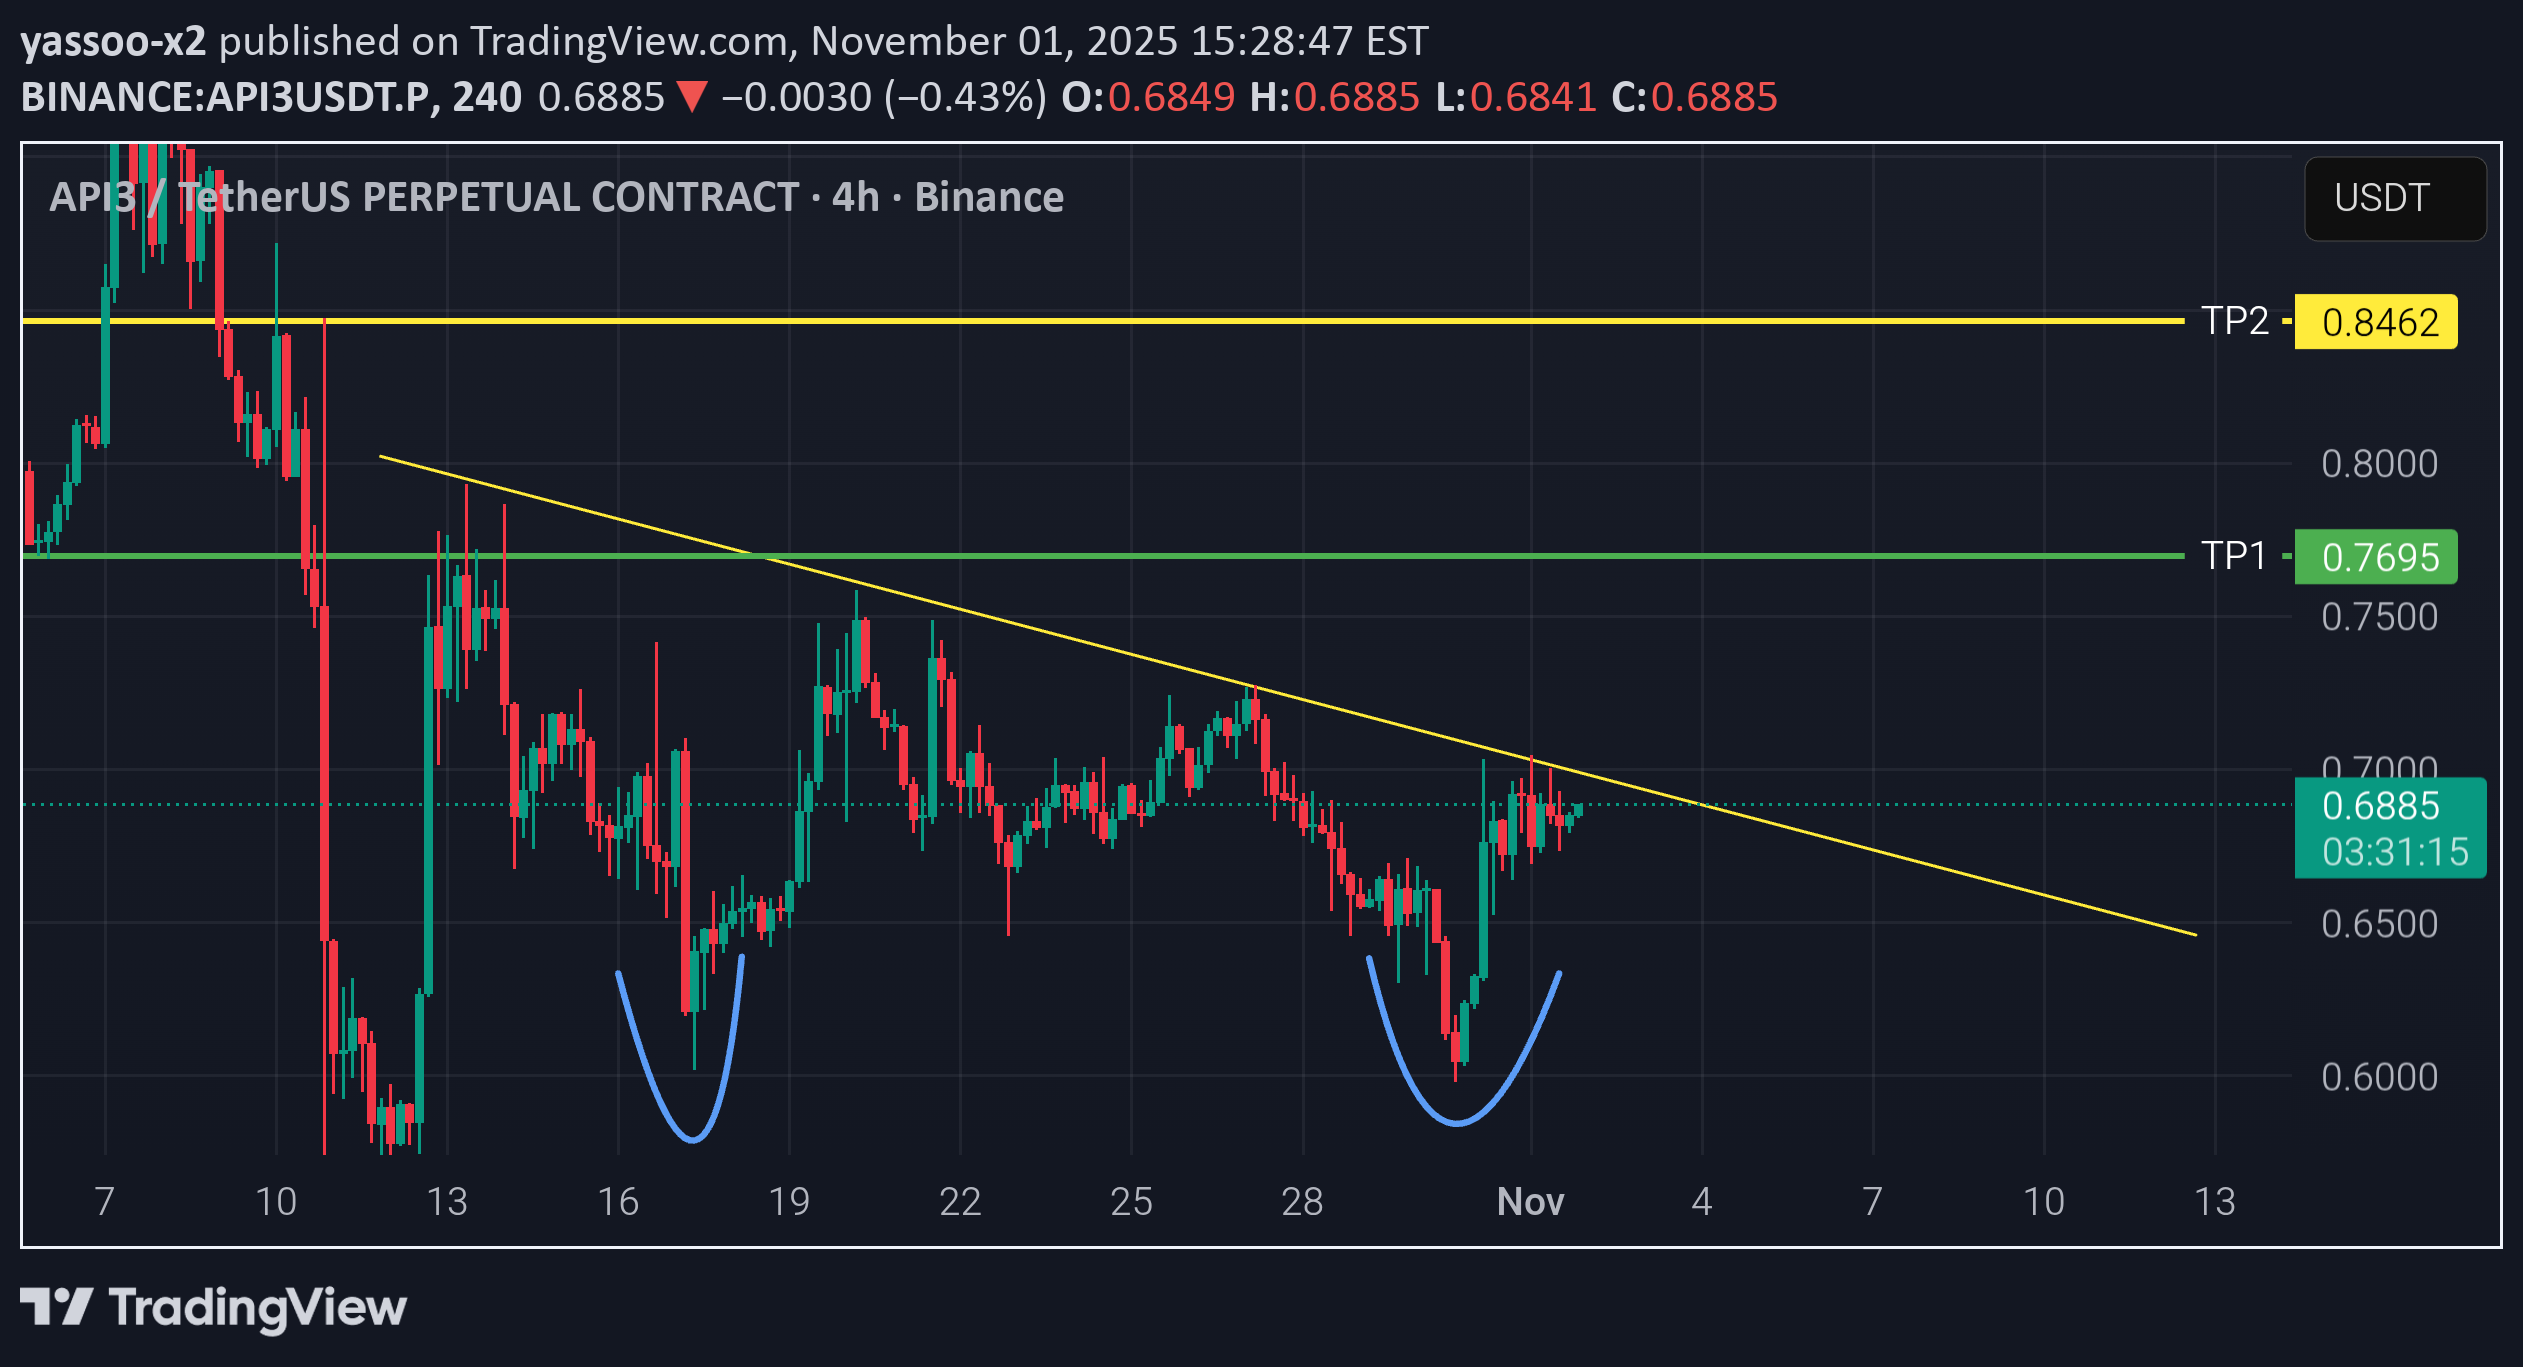
The chart shows a clear Double Bottom pattern around the 0.60 zone, indicating a potential bullish reversal. Price is now testing the descending trendline (neckline), and a confirmed 4H candle close above 0.69 with strong volume could trigger a breakout move. 🎯 Targets: TP1: 0.7412 TP2: 0.8462 🛡️ Stop Loss: Below 0.67 or the previous low. Volume is increasing, supporting the potential breakout — so entry can be considered now if volume keeps rising, or after a retest of the trendline for safer confirmation. #API3USDT #Crypto #TradingView #TechnicalAnalysis #DoubleBottom #TrendlineBreakout

Alpha-GoldFX
صعود فضایی API3USDT: سیگنال انفجاری برای سود 200 درصدی!
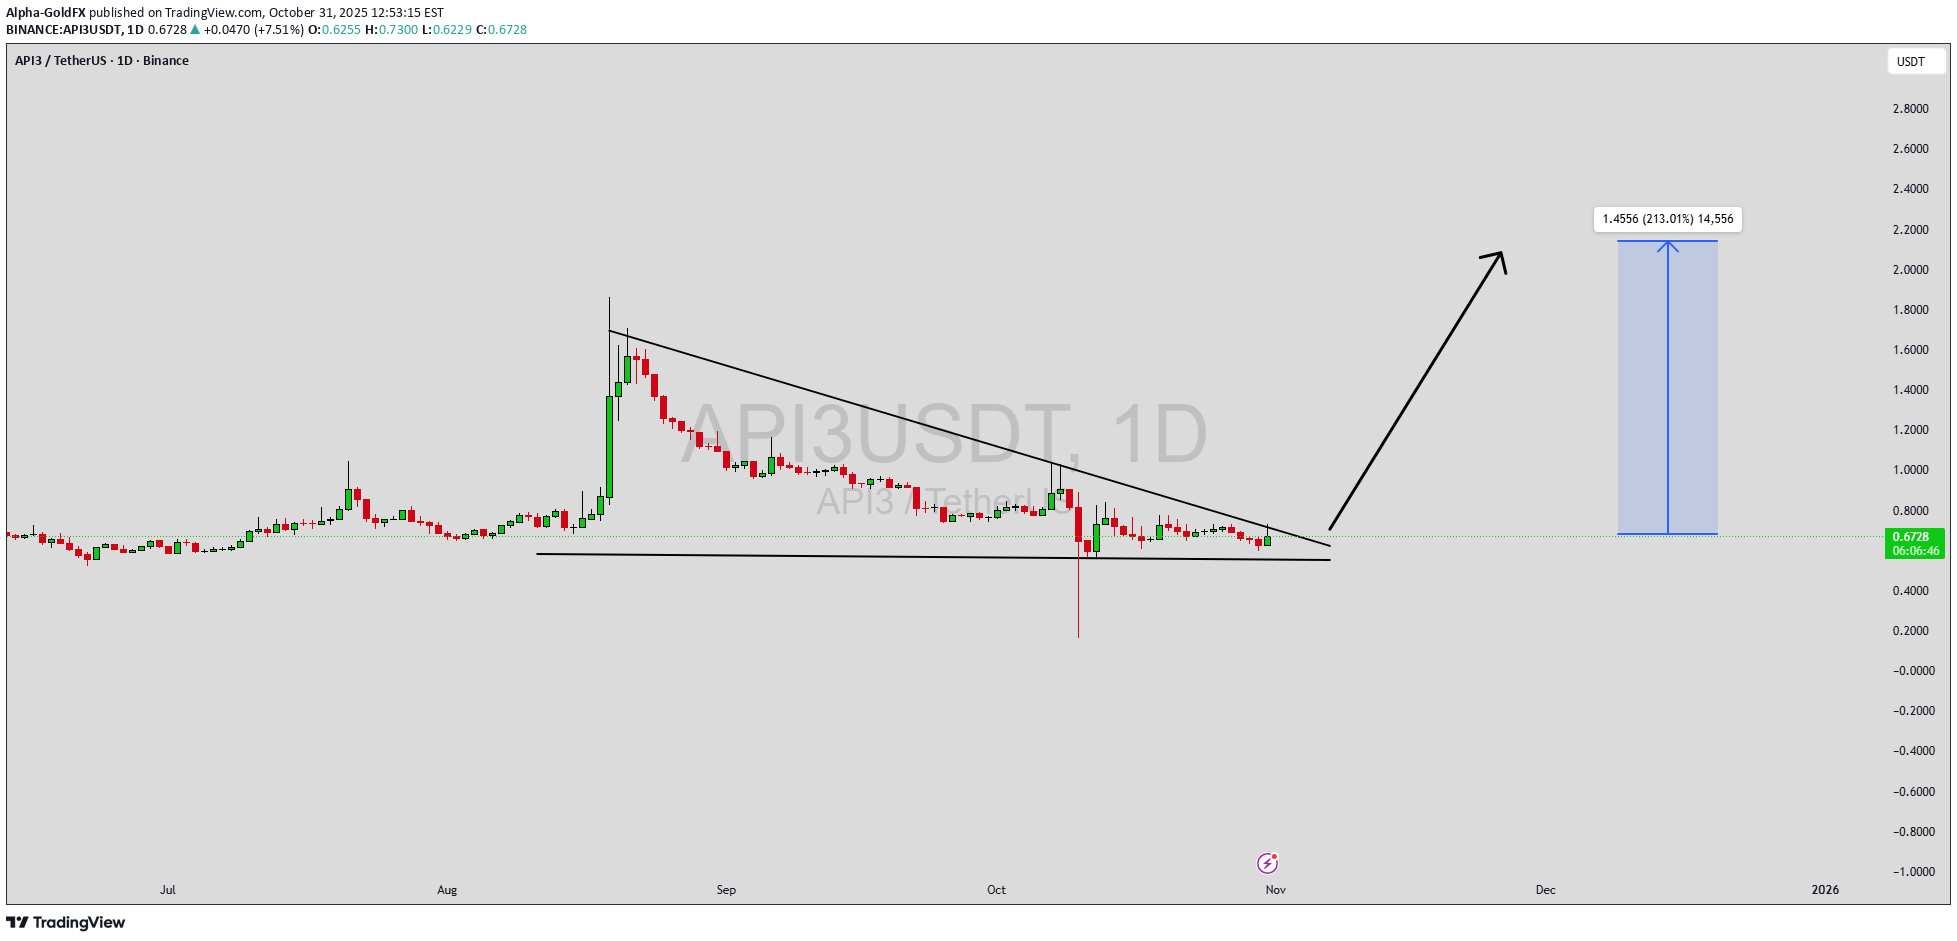
API3USDT is currently showing an impressive bullish pennant pattern, which often serves as a strong continuation signal in technical analysis. After a sharp upward move, the price has entered a brief consolidation phase, forming a tight pennant shape that indicates market indecision before the next breakout. This structure suggests that bulls are maintaining control, and once the price breaks above the resistance level, a powerful rally could follow — with potential gains of 190% to 200%+. The trading volume behind API3USDT remains strong, supporting the idea of growing accumulation and investor confidence in the project. The consistent inflow of buying pressure and stable market participation are both positive indicators that the current pattern could soon resolve in favor of the bulls. Traders are closely monitoring this setup, as a confirmed breakout with volume could trigger a large upward move and accelerate momentum toward key resistance zones. Investor sentiment is turning highly optimistic around API3, as it continues to gain attention within the decentralized data oracle sector. With solid fundamentals, increasing ecosystem adoption, and a promising technical structure, API3USDT is positioned as one of the more exciting opportunities in the market right now. If bullish momentum continues, the coin could deliver significant returns in the coming sessions. ✅ Show your support by hitting the like button and ✅ Leaving a comment below! (What is You opinion about this Coin) Your feedback and engagement keep me inspired to share more insightful market analysis with you!
yassoo-x2
پیشبینی انفجاری API3: صعود به بالای مقاومت با حمایت قوی! (تحلیل ۴ ساعته)
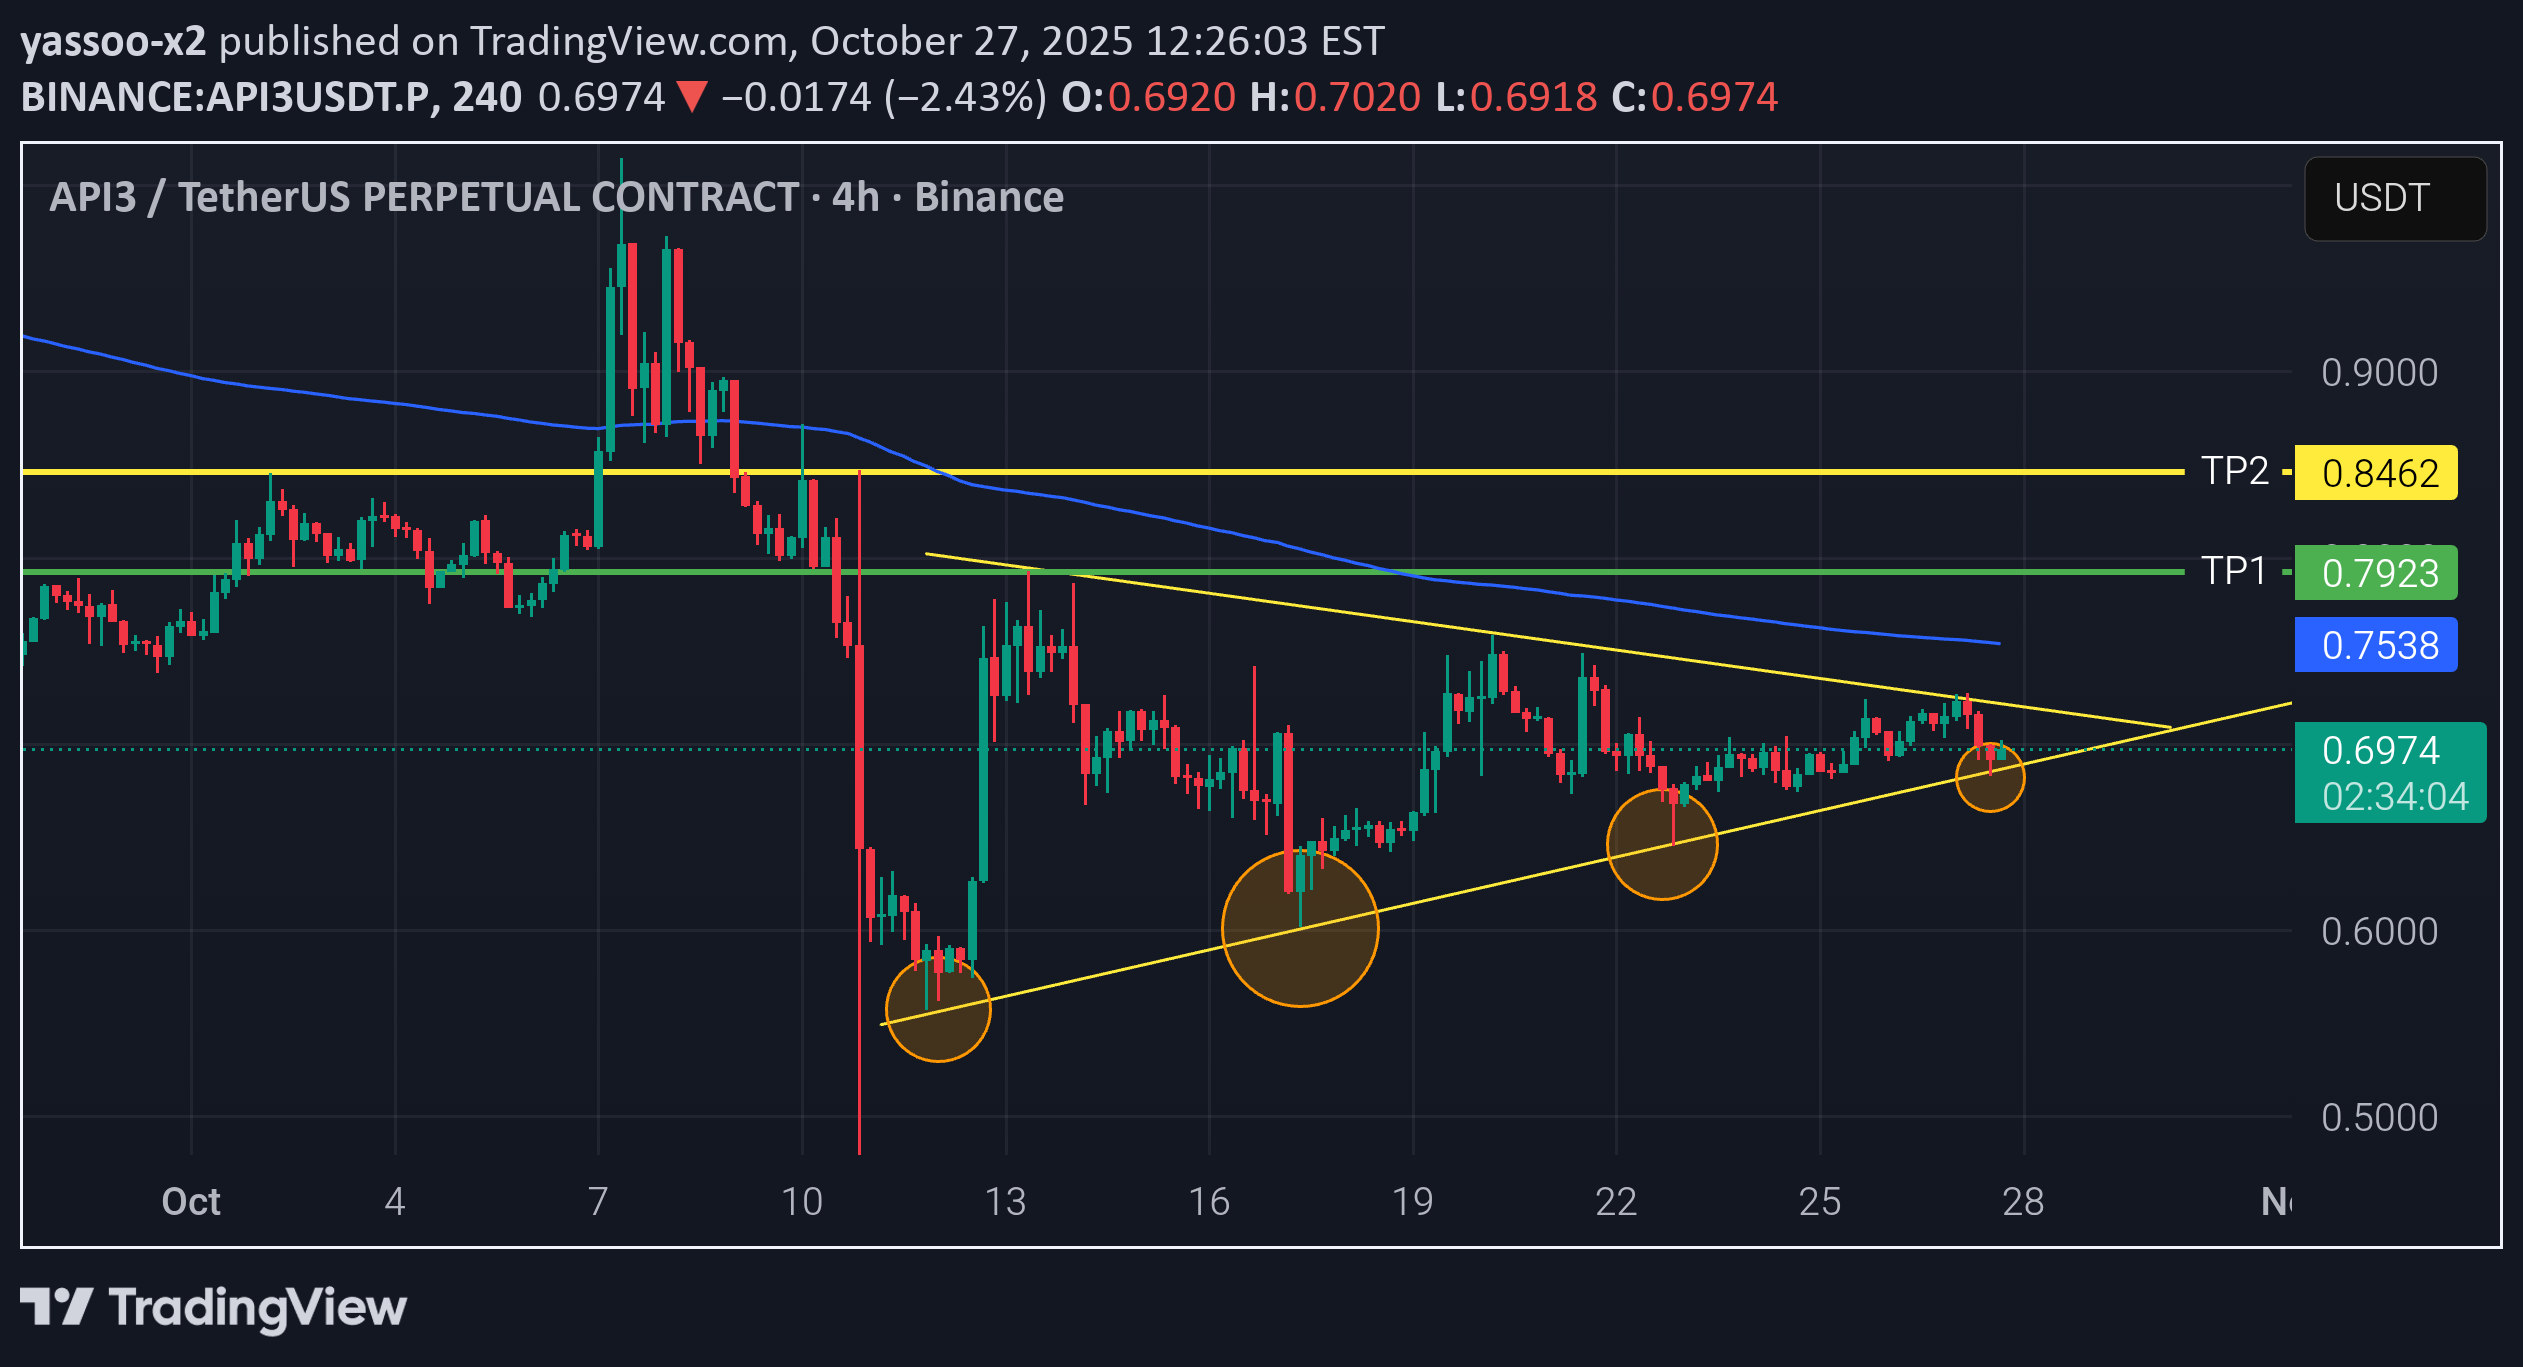
Price has just bounced perfectly from the ascending trendline, showing strong support and renewed buying pressure. If momentum continues, we could see a breakout above the triangle and 200 EMA soon. 🟢 Entry idea: Entry can be considered now after the bounce from the trendline, or on confirmation above 0.75 USDT for safer entry. 🎯 TP1: 0.7923 🎯 TP2: 0.8462 🔴 Support: 0.70 (trendline support) ⚙️ Pattern: Symmetrical Triangle ⏰ Timeframe: 4H 📈 Bias: Bullish above 0.70 Volume is gradually rising — a breakout could be near. What do you think — early entry here or wait for confirmation? 👀

SerCaan
تحلیل تکنیکال API3/USDT: سیگنال ورود پس از شکست روند نزولی!
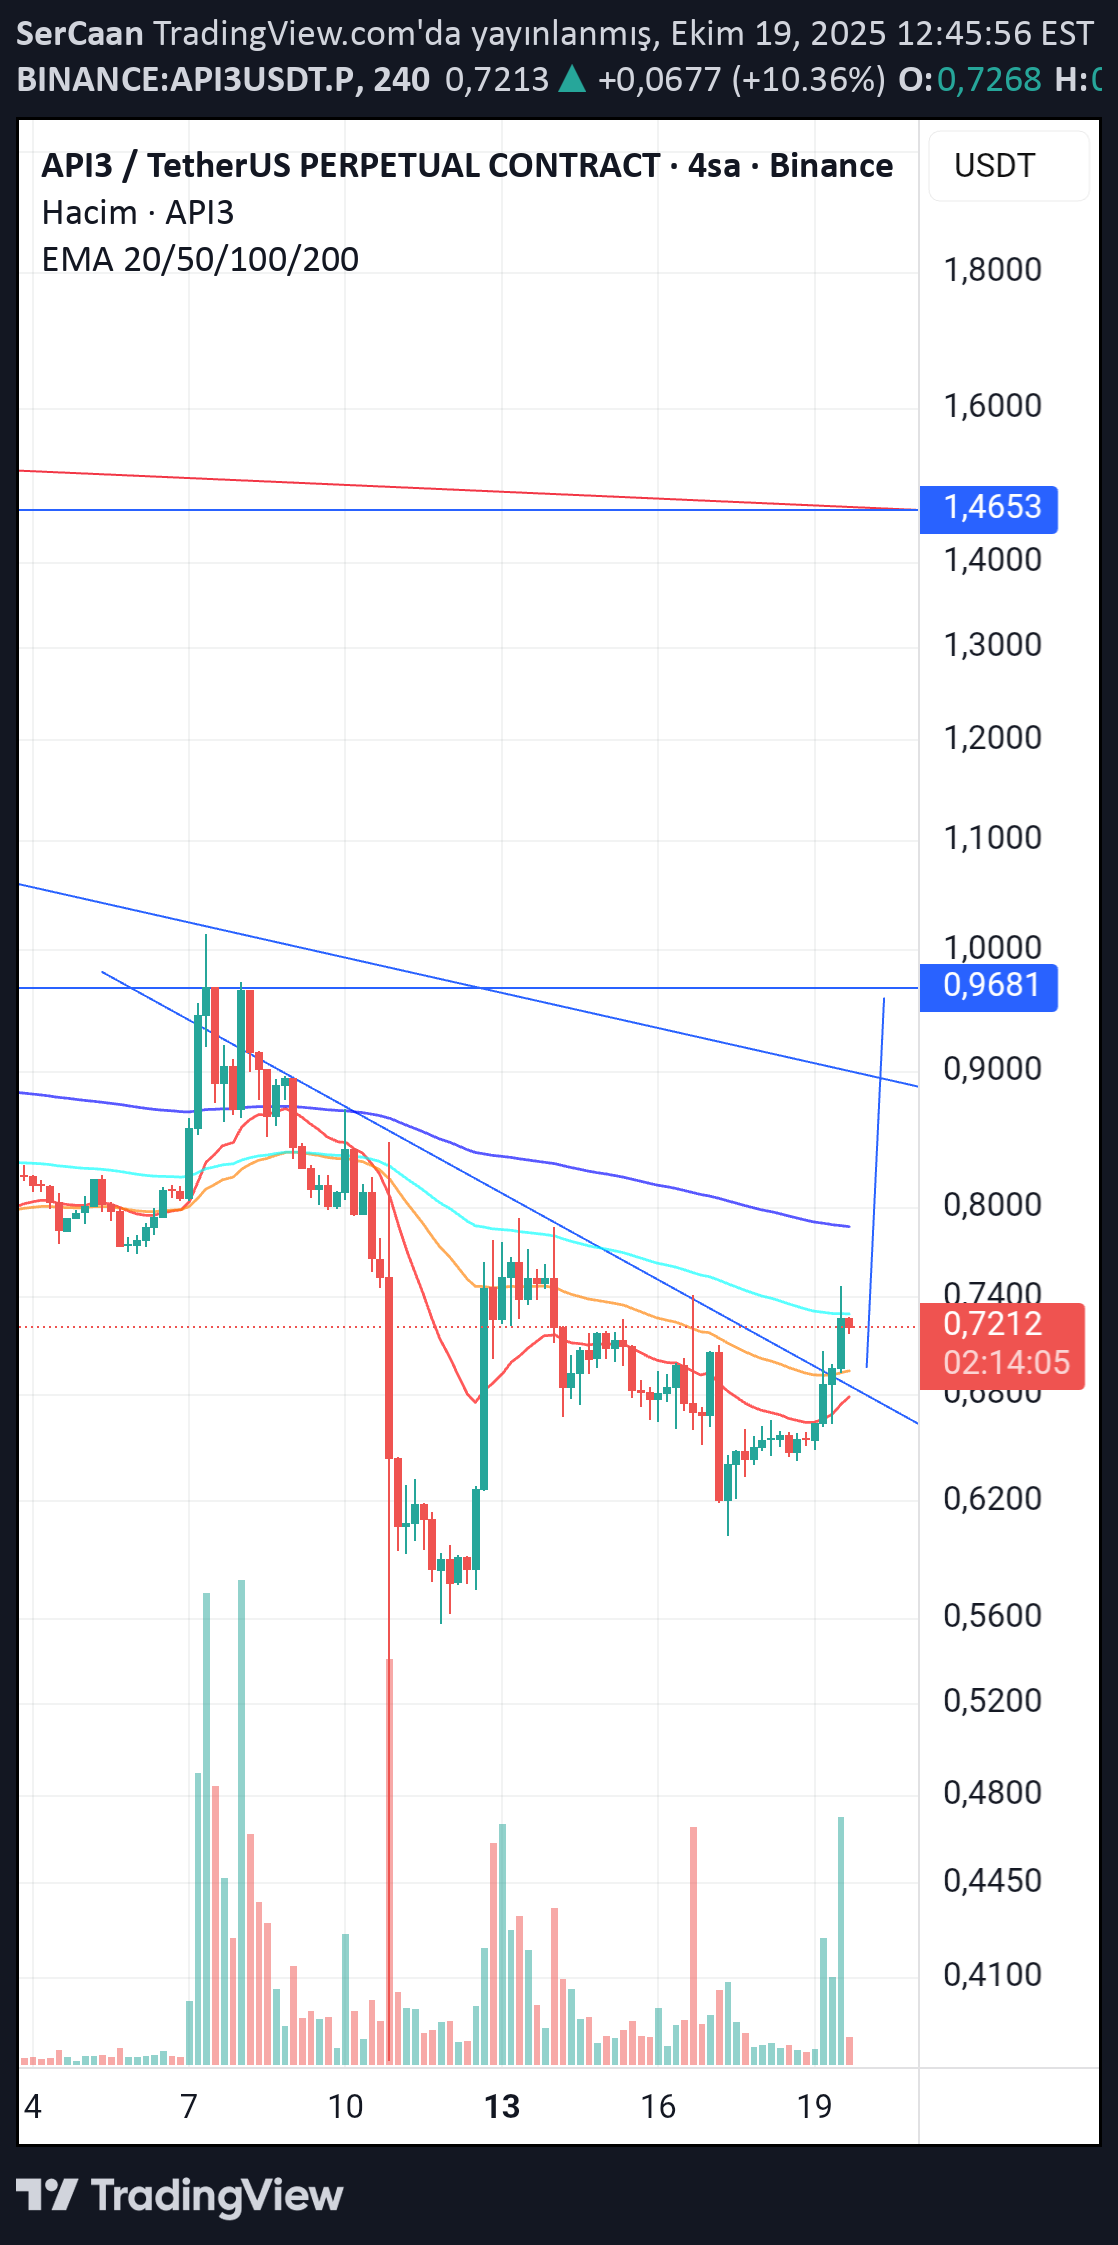
API3USDT Let the retest of the small falling trend break be completed and the movement begins. If it manages to break the big trend, you will go much higher. TP1 0.96 TP2 1.45 Not investment advice Note to self

CryptoWithJames
تحلیل تکنیکال API3: فرصت ۱۰۰٪ سود در دل مثلث نزولی صعودی!

#API3 UPDATE API3 Technical Setup Pattern: Bullish falling wedge pattern Current Price: $0.887 Target Price: $1.69 Target % Gain: 100.67% $API3 is breaking out of a falling wedge pattern on the 1D timeframe. Current price is $0.887 with a target near $1.69, showing about 100% potential upside. The breakout indicates renewed bullish strength and suggests potential continuation if momentum sustains. Always use proper risk management. Time Frame: 1D Risk Management Tip: Always use proper risk management.

faisal_qaisy5
راز رسیدن به قله: سطوح حمایتی و مقاومتی کلیدی برای سودآوری فوری!

All you need to know: 🟩 Support Levels (visible on the chart) $0.791 — The lowest green EMA ribbon line at the bottom of the indicator cluster; this is a major support floor. $0.820 – $0.871 — Multiple EMA levels (100/200) converge here, forming a strong support zone where price consolidated before the breakout. $0.914 – $0.925 — Bollinger Band midline and EMA 50–20 cluster; acts as a short-term support area. $0.943 — Labeled as VWAP Divergence (Flux Charts); current dynamic support after the breakout. 🟥 Resistance Levels (clearly marked on chart) $1.037 — Marked horizontal red line labeled “BB 20 SMA close 2”; immediate overhead resistance. $1.159 — The major resistance line shown in red near the top of the chart — likely the next key upside target (where the upward arrow points). $1.200 (approx) — Slightly above the 1.159 mark; the top psychological zone visible on the price axis. Currently a recent breakout upward move with a large green candle breaking above all moving averages and ribbons. Volume: 124.1K, confirming strong buying activity. EMA trend: Bullish crossover — all EMAs (20/50/100/200) are aligned upward. ⚙️ Visual Interpretation The arrow drawn upward from $0.986 targets the $1.15–$1.16 resistance area, indicating bullish sentiment or an anticipated move toward that level. If rejected near $1.037, price might retest supports near $0.94 or $0.92 before continuing higher. ✅ Summary from day chart Immediate Support: $0.943 → $0.914 → $0.871 Immediate Resistance: $1.037 → $1.159 Short-term bullish momentum after strong breakout Happy hunting!

JupahduhX
Api3 potential
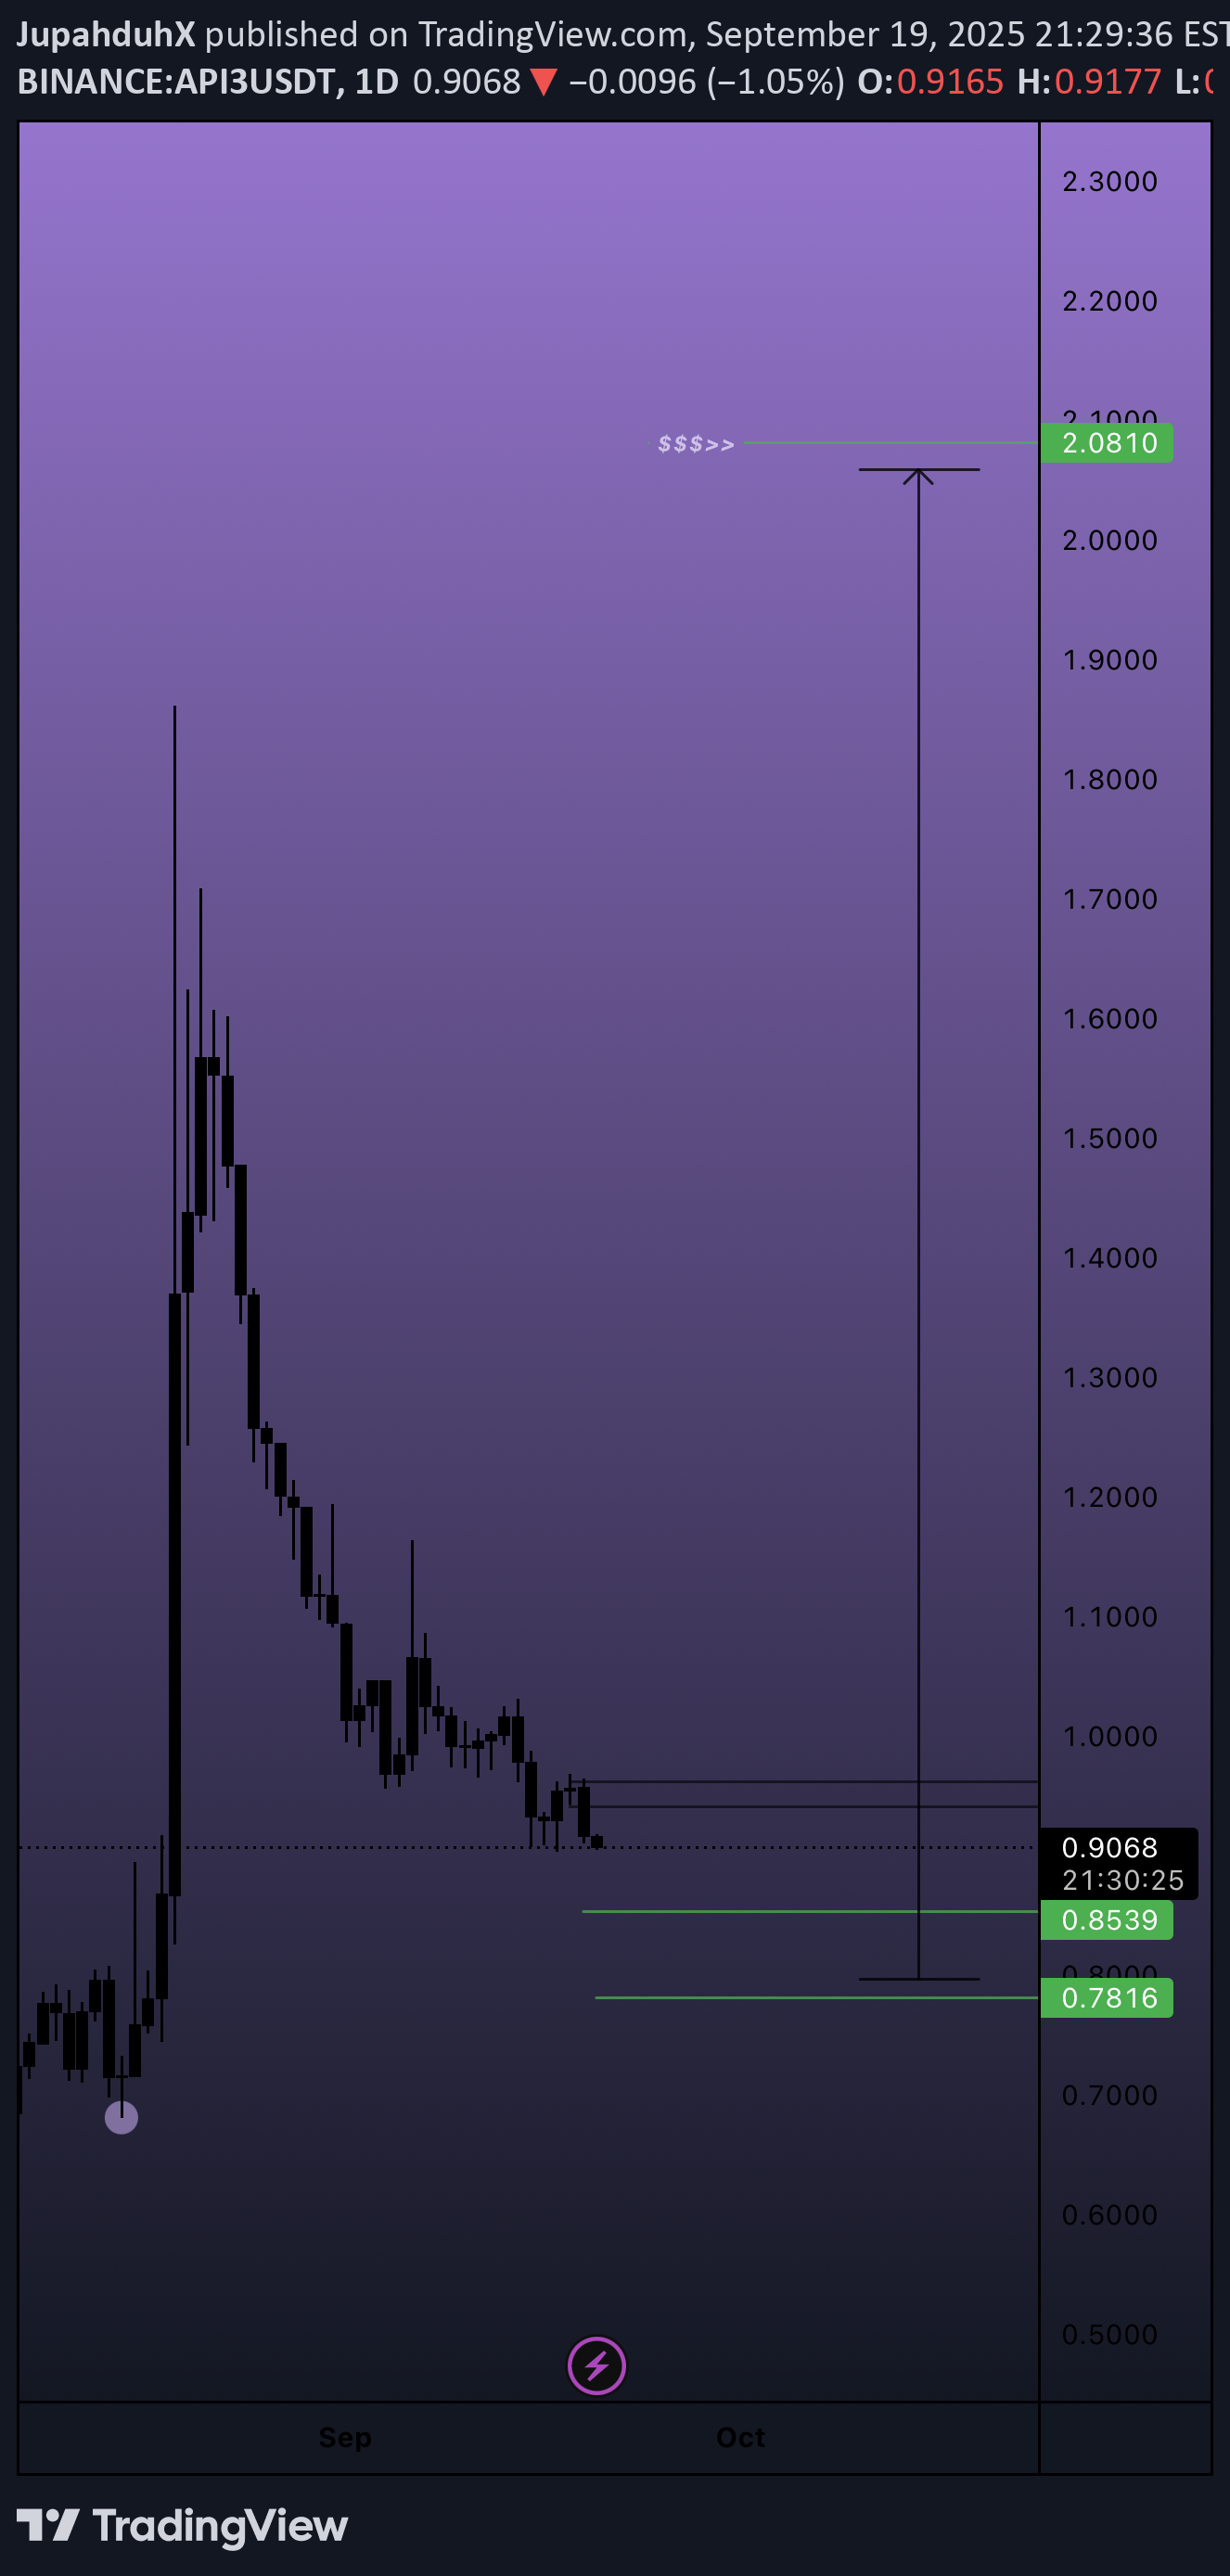
Api3 my current dark horse pick of the bunch!!!! $0.94 demands a retest imo and if settled above we should see a take of the recent high putting this on a run into $2.08! Crucial handles here lay at ($0.8539-$0.7816) and as q3 comes closer to an end we could potentially see some low end pricing around $0.65/$0.70 to start out q4. This point will play max and will need some higher timeframe closures to judge its run which I believe holds enough fire to kick this back up. In short, we kick above $1.60 from these handles the run should be smooth into $2.08 which will become it’s biggest hurdle. Overall targets from there is $3.30 and if supported with closures this should have no problem back into $5 placing this token as something to hold long term… Happy Trading People!! 😉

bgoode71
Going through hotlist posted in chat
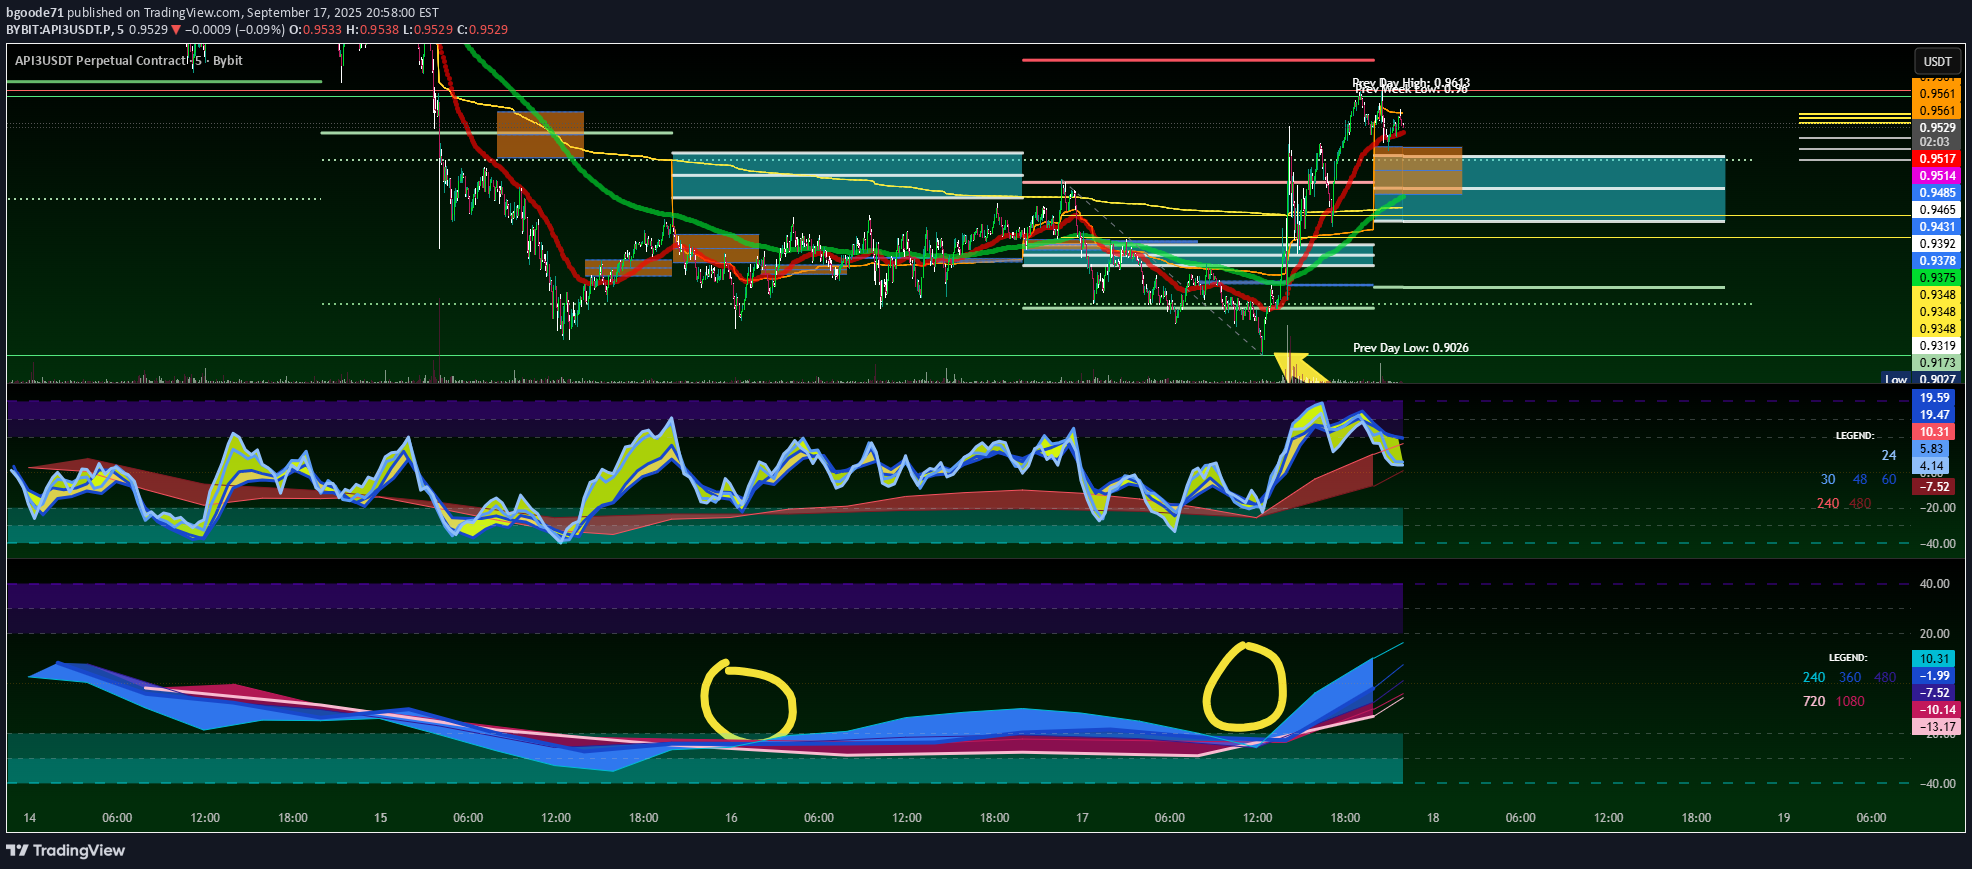
Going through hotlist posted in chat. Using LTF and MTF PAR RSI ribbons
Disclaimer
Any content and materials included in Sahmeto's website and official communication channels are a compilation of personal opinions and analyses and are not binding. They do not constitute any recommendation for buying, selling, entering or exiting the stock market and cryptocurrency market. Also, all news and analyses included in the website and channels are merely republished information from official and unofficial domestic and foreign sources, and it is obvious that users of the said content are responsible for following up and ensuring the authenticity and accuracy of the materials. Therefore, while disclaiming responsibility, it is declared that the responsibility for any decision-making, action, and potential profit and loss in the capital market and cryptocurrency market lies with the trader.