
pejman_zwin
@t_pejman_zwin

What symbols does the trader recommend buying?
Purchase History
پیام های تریدر
Filter
pejman_zwin
طلا در آستانه ریزش؟ هشدار اصلاح قیمتی پس از رسیدن به اوج مثلث!
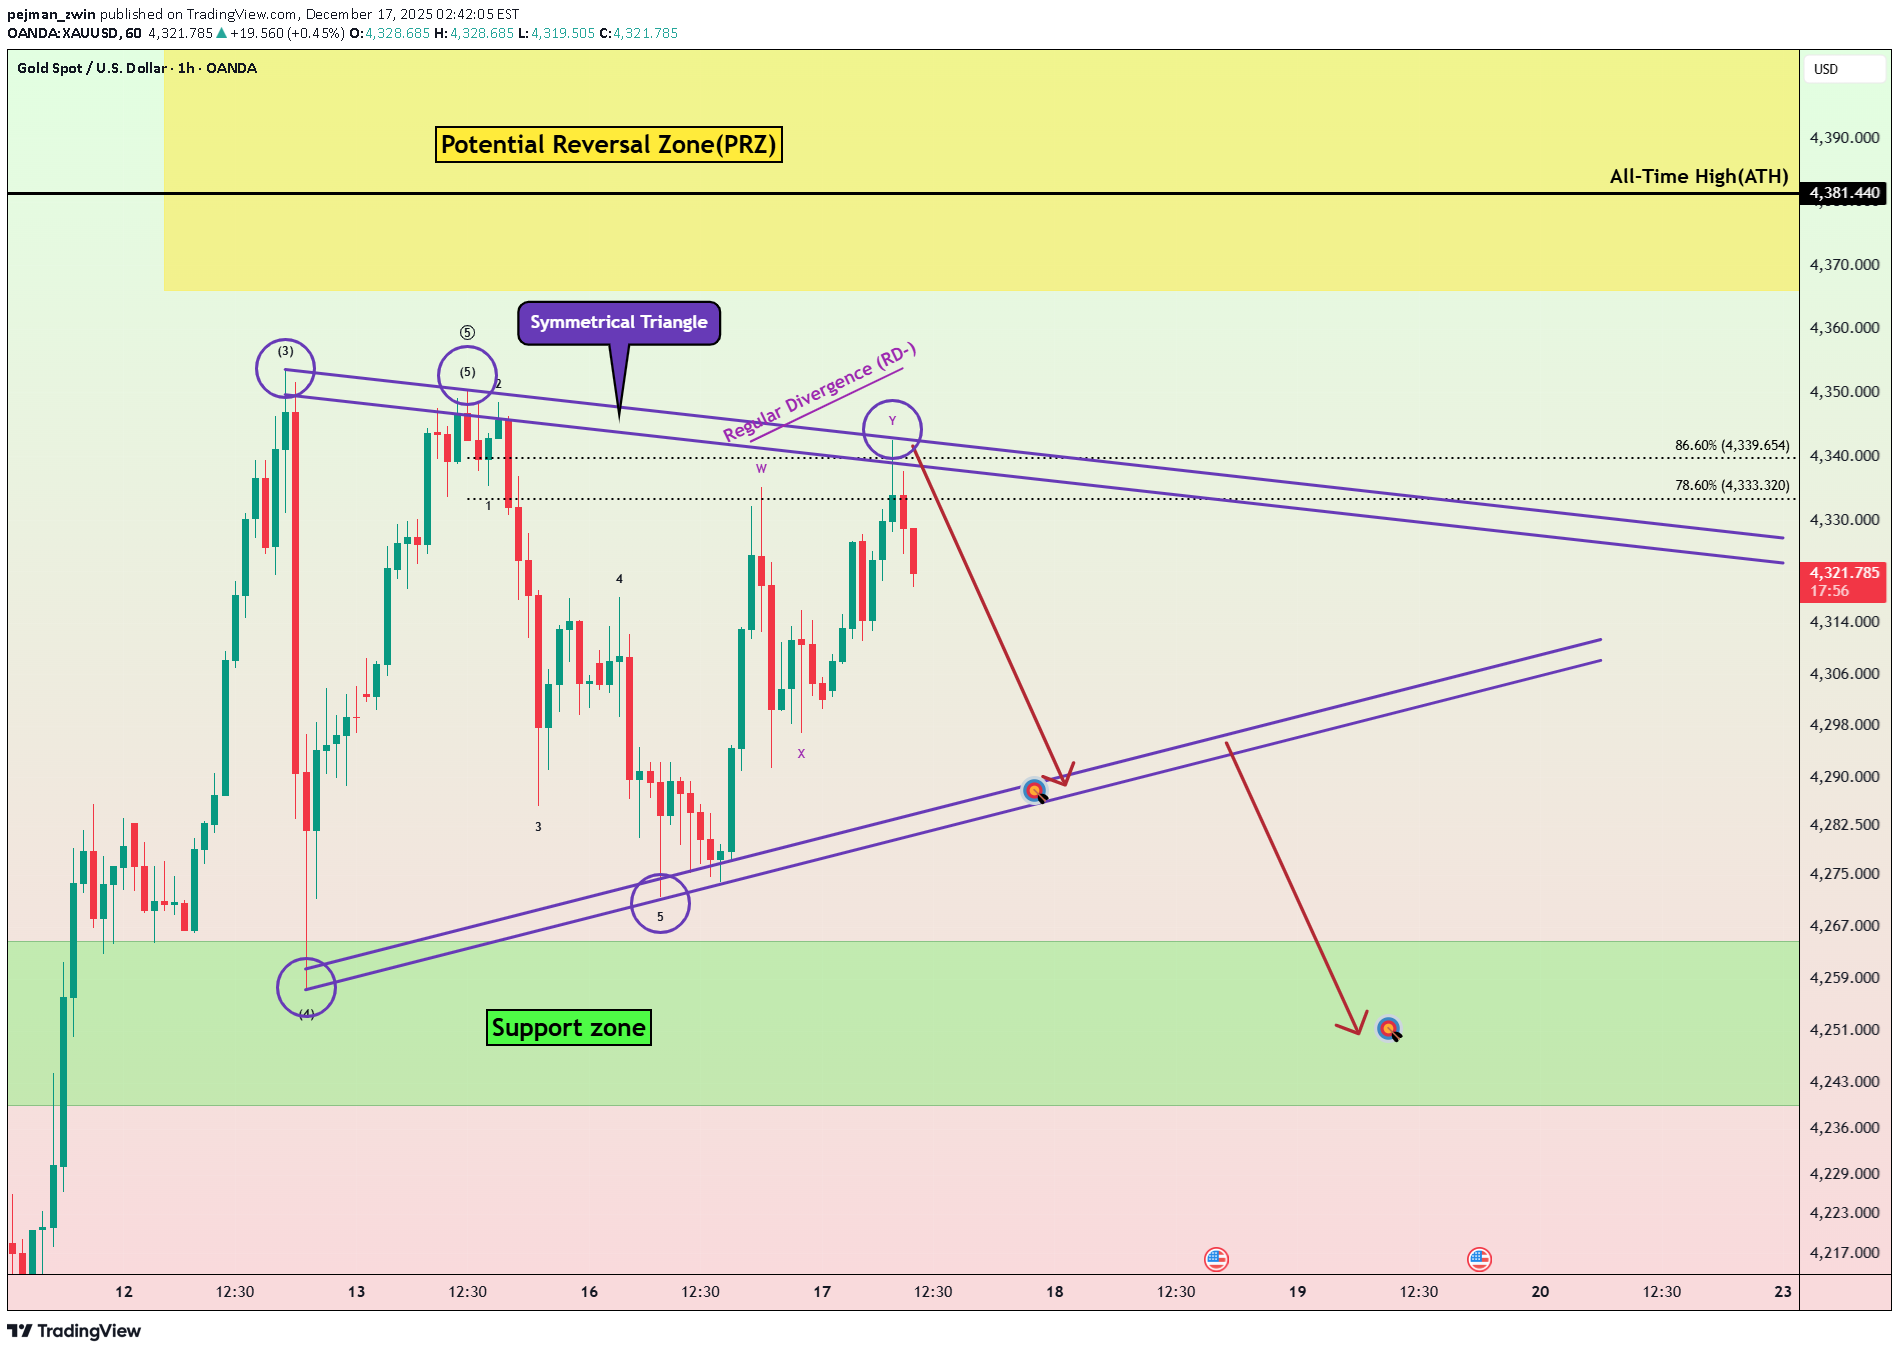
Based on yesterday’s U.S. economic data, Gold( XAUUSD ) failed to post a significant bullish move. At the moment, Gold appears to be trading within a Symmetrical Triangle pattern and is currently moving near the upper lines of this pattern. From an Elliott Wave perspective, it seems that Gold has completed a Double Three corrective structure near the upper lines of the symmetrical triangle. In addition, a Regular Bearish Divergence (RD−) can be observed between the two most recent highs, which weakens the bullish momentum. I expect that Gold will at least decline toward the lower lines of the symmetrical triangle. If these lower lines are broken, we could even anticipate a breakdown below the Support zone($4,265-$4,240). First Target: Lower lines of symmetrical triangle Second Target: Support zone($4,265-$4,240) Stop Loss(SL): $4,357 Points may shift as the market evolves 💡 Please respect each other's opinions and express agreement or disagreement politely. 📌 Gold Analyze (XAUUSD), 1-hour time frame. 🛑 Always set a Stop Loss(SL) for every position you open. ✅ This is just my idea; I’d love to see your thoughts too! 🔥 If you find it helpful, please BOOST this post and share it with your friends.Gold started to fall after a fake break above the lines of the symmetrical triangle pattern. In terms of Elliott wave theory, it seems that the main wave 5 has been completed with the Ending Diagonal. In general, on the US timeline, the market is more excited the past few weeks than before, so pay attention to capital management.
pejman_zwin
Bitcoin Pullback to Resistance — Next Drop Loading?
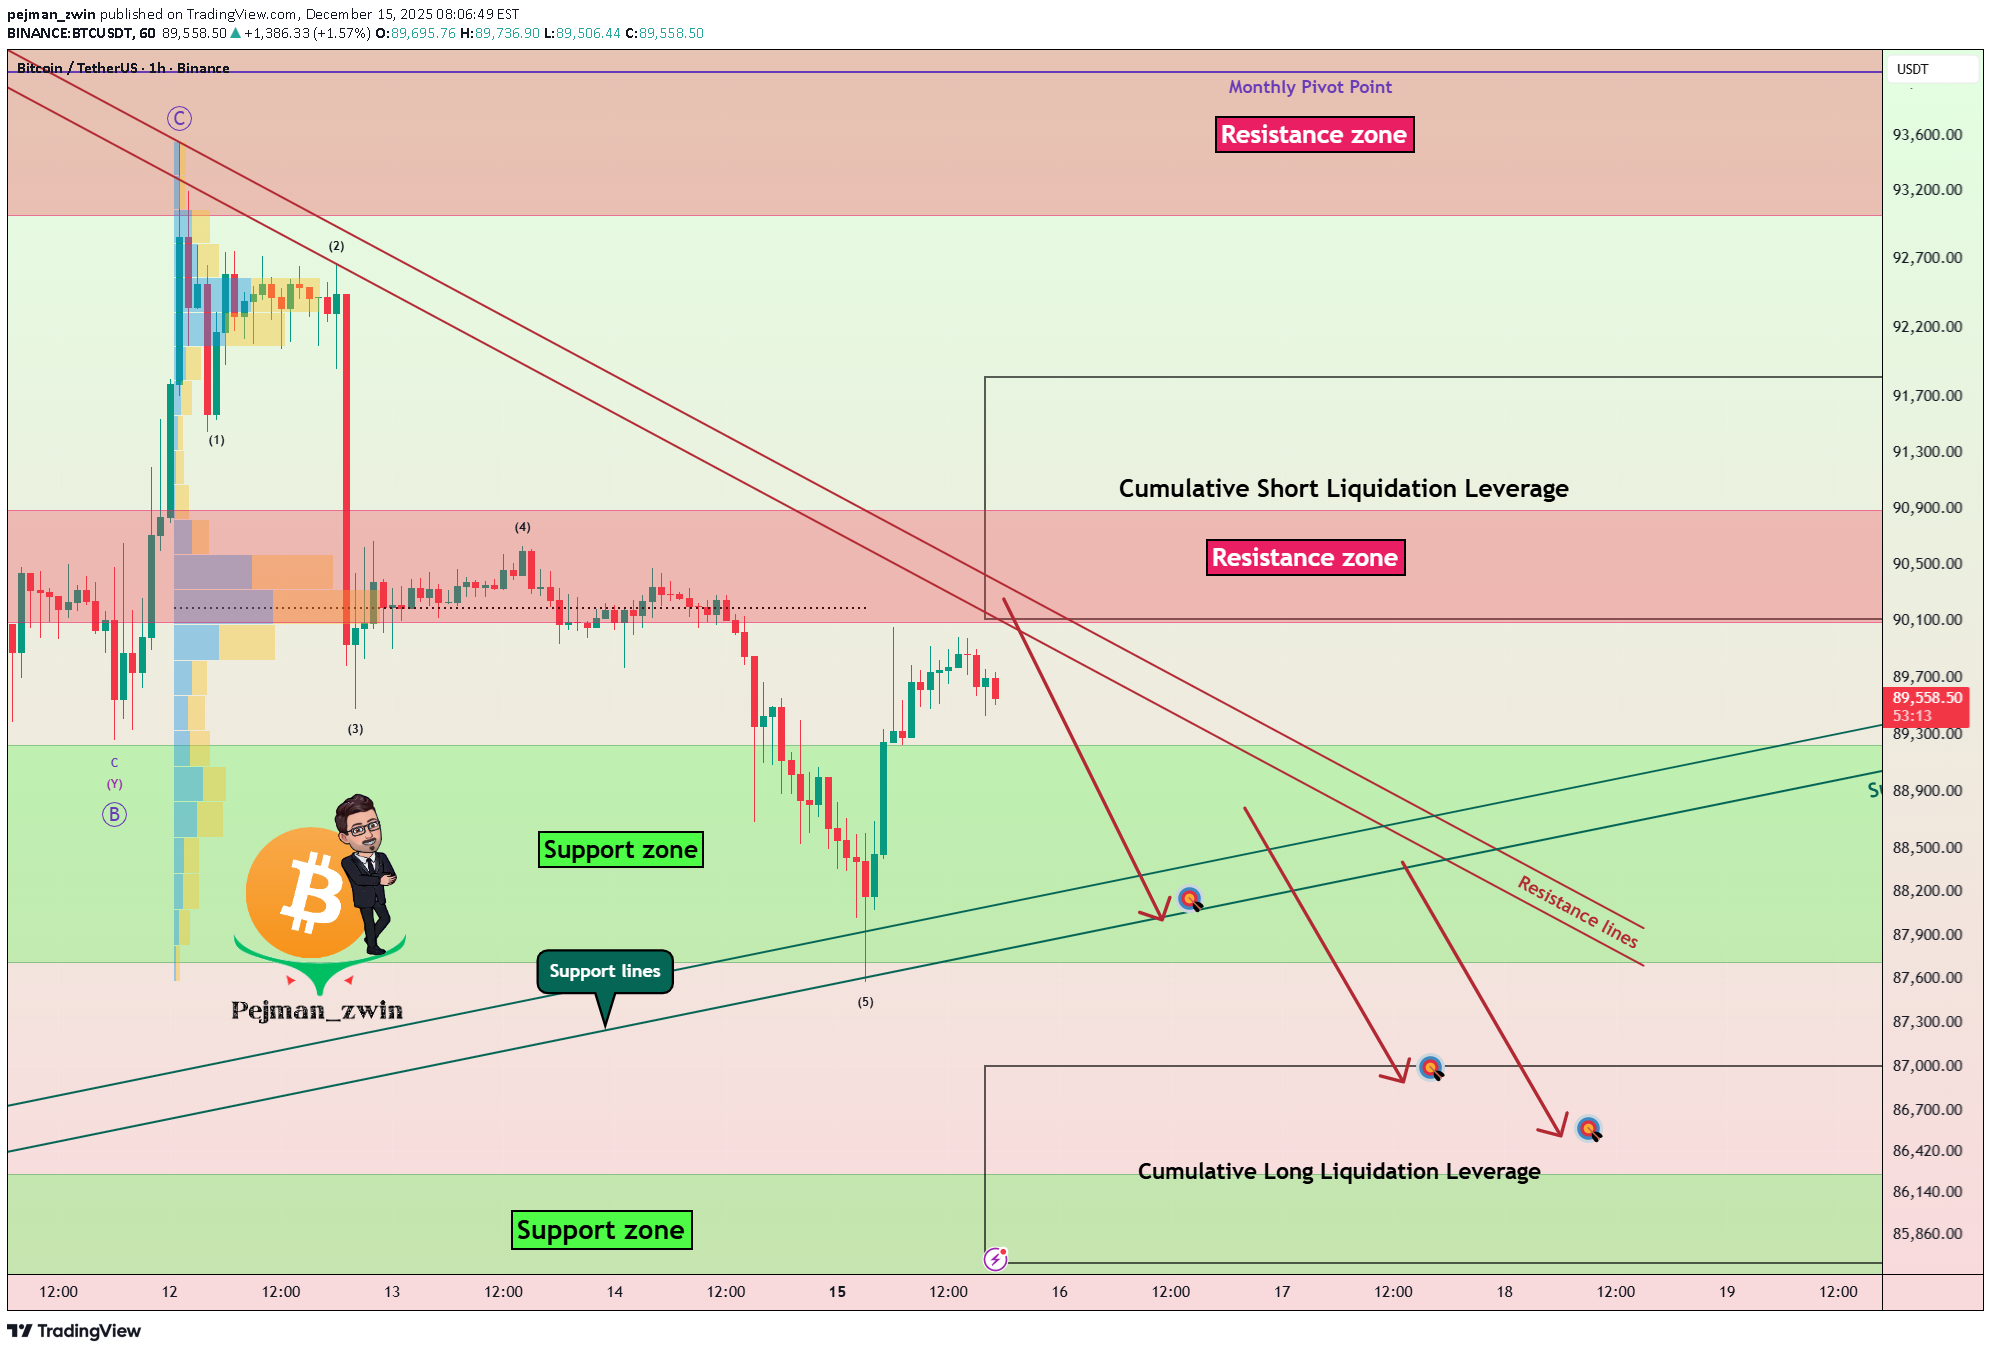
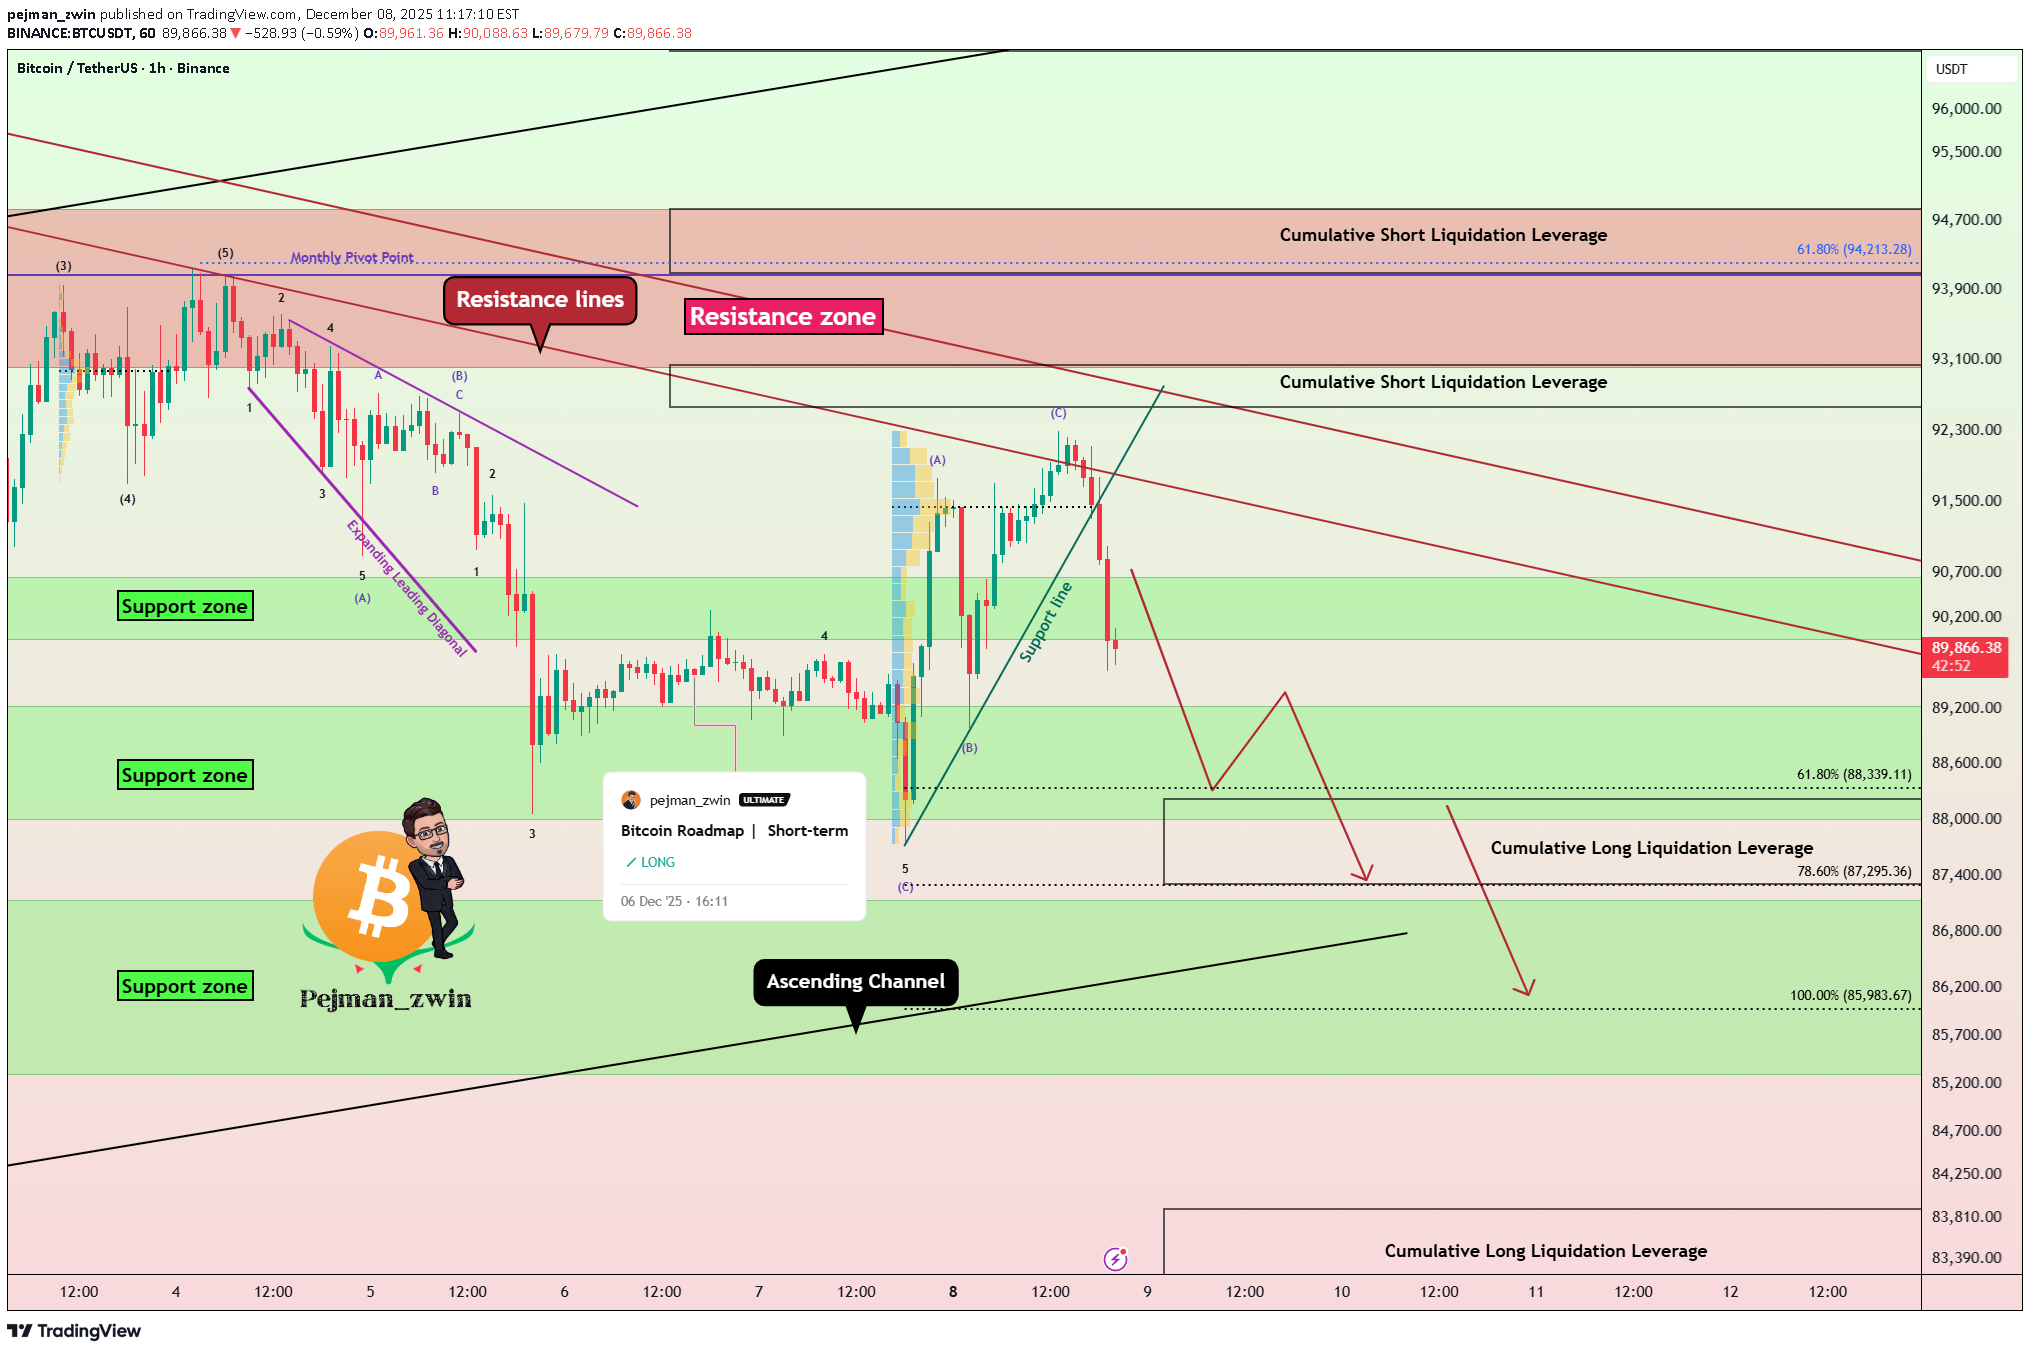
As I expected , Bitcoin( BTCUSDT ) has begun its decline from the resistance zone($94,850-$93,000) and has reached its target. Currently, Bitcoin is moving near the resistance zone($90,900-$90,100), the Cumulative Short Liquidation Leverage($91,840-$90,110), and other resistance lines. From an Elliott Wave perspective, it appears that Bitcoin has completed its five-wave downward sequence and is now in the process of forming the corrective waves upward, likely within the resistance zone($90,900-$90,100). Moreover, since the USDT.D% ( USDT.D ) has successfully broken the upper line of its falling wedge pattern, we can anticipate further increases in USDT.D%, which could put additional downward pressure on Bitcoin. Additionally, considering that the S&P 500 index( SPX ) is likely to resume a bearish trend, and given Bitcoin’s correlation with the SPX, a further decline in Bitcoin is not unexpected. In conclusion, based on the above analysis, I expect that Bitcoin will at least test the support lines and, if those are broken, it may continue to decline toward the Cumulative Long Liquidation Leverage($87,000-$85,663). If the momentum of breaking these support lines is strong, we can expect even more significant downward movement. Do you think Bitcoin can go below $87,000? First Target: Support lines Second Target: Cumulative Long Liquidation Leverage($87,000-$85,663) Stop Loss(SL): $92,000(Worst) Points may shift as the market evolves 💡 Please respect each other's opinions and express agreement or disagreement politely. 📌Bitcoin Analysis (BTCUSDT), 1-hour time frame. 🛑 Always set a Stop Loss(SL) for every position you open. ✅ This is just my idea; I’d love to see your thoughts too! 🔥 If you find it helpful, please BOOST this post and share it with your friends.Trade was activated when the support lines were broken.Full Target Done
pejman_zwin
Gold Near ATH & PRZ — Is This the Top?
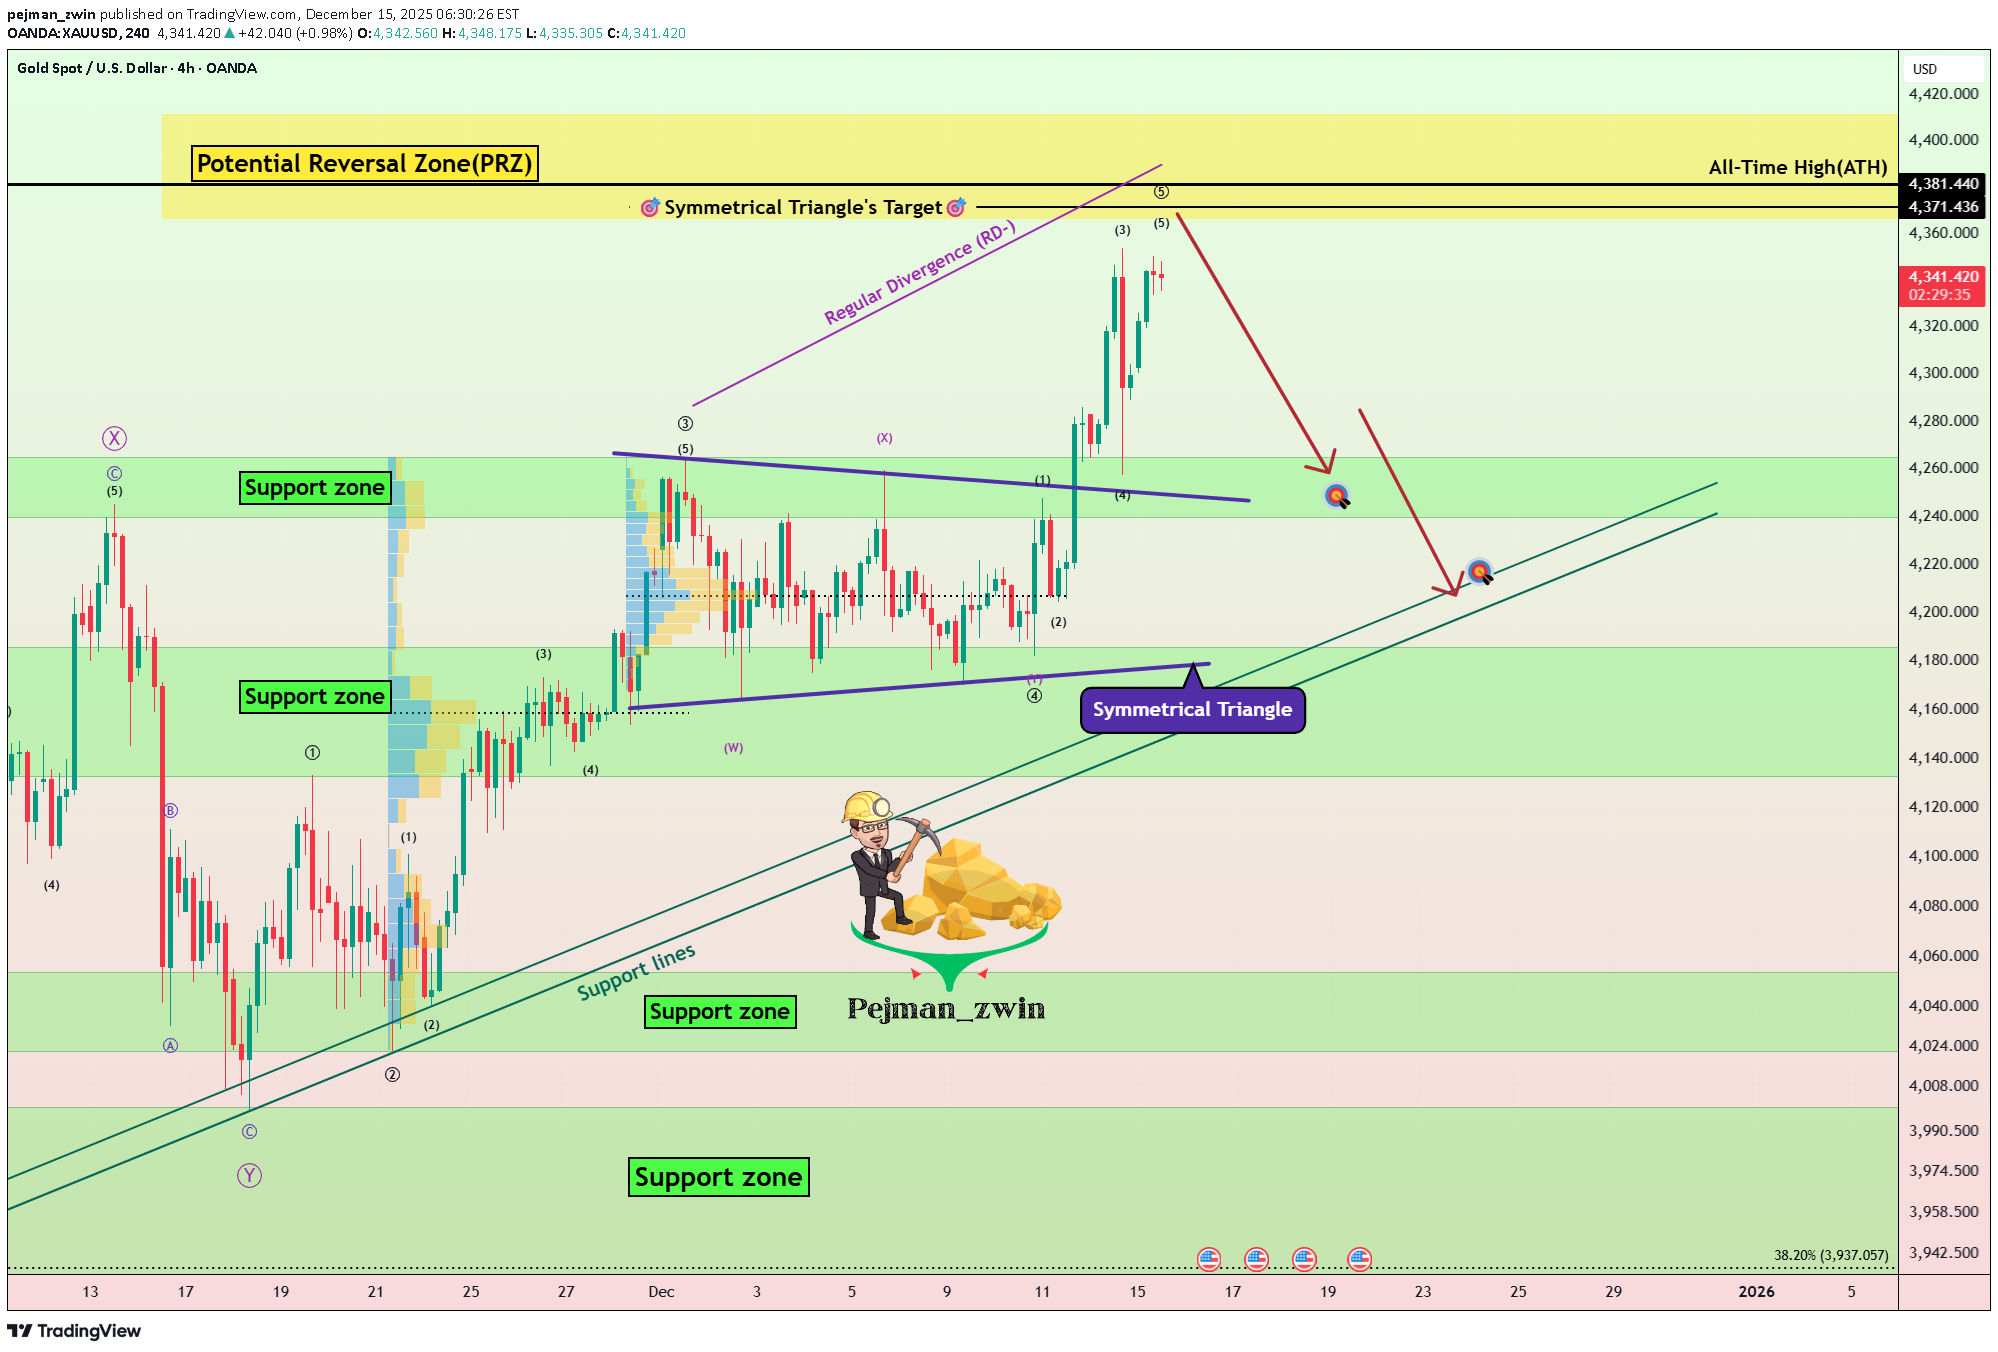
As I expected , Gold( XAUUSD ), after its pullback to the symmetrical triangle, has risen toward its target. Now, the question arises: given that Gold is near its all-time highs, is it still sensible to take long positions, or should we consider short positions instead? Gold is moving close to its All-Time High(ATH=$4,381) and the Potential Reversal Zone(PRZ) [$4,412-$4,366], also nearing the target of the Symmetrical Triangle Pattern. From an Elliott Wave perspective, it seems that Gold is in the process of completing microwave 5 of the main wave 5. One indication of this is the presence of negative Regular Divergence (RD-) between the two corresponding peaks. I expect that Gold will experience a downward correction and potentially drop to around $4,263, with significant support lines in place. Should those support lines be broken, we could anticipate even further declines. What are your thoughts? Do you believe Gold will reach new all-time highs, or are we looking at a correction ahead? First Target: $4,263 Second Target: Support lines Stop Loss(SL): $4,433 Points may shift as the market evolves 💡 Please respect each other's opinions and express agreement or disagreement politely. 📌 Gold Analyze (XAUUSD), 4-hour time frame. 🛑 Always set a Stop Loss(SL) for every position you open. ✅ This is just my idea; I’d love to see your thoughts too! 🔥 If you find it helpful, please BOOST this post and share it with your friends.Trade was activatedSince the US indices are due to be released in less than an hour, I closed the position manually with a profit.
pejman_zwin
شکست مثلث متقارن طلا (XAUUSD): آیا رکوردشکنی در راه است؟
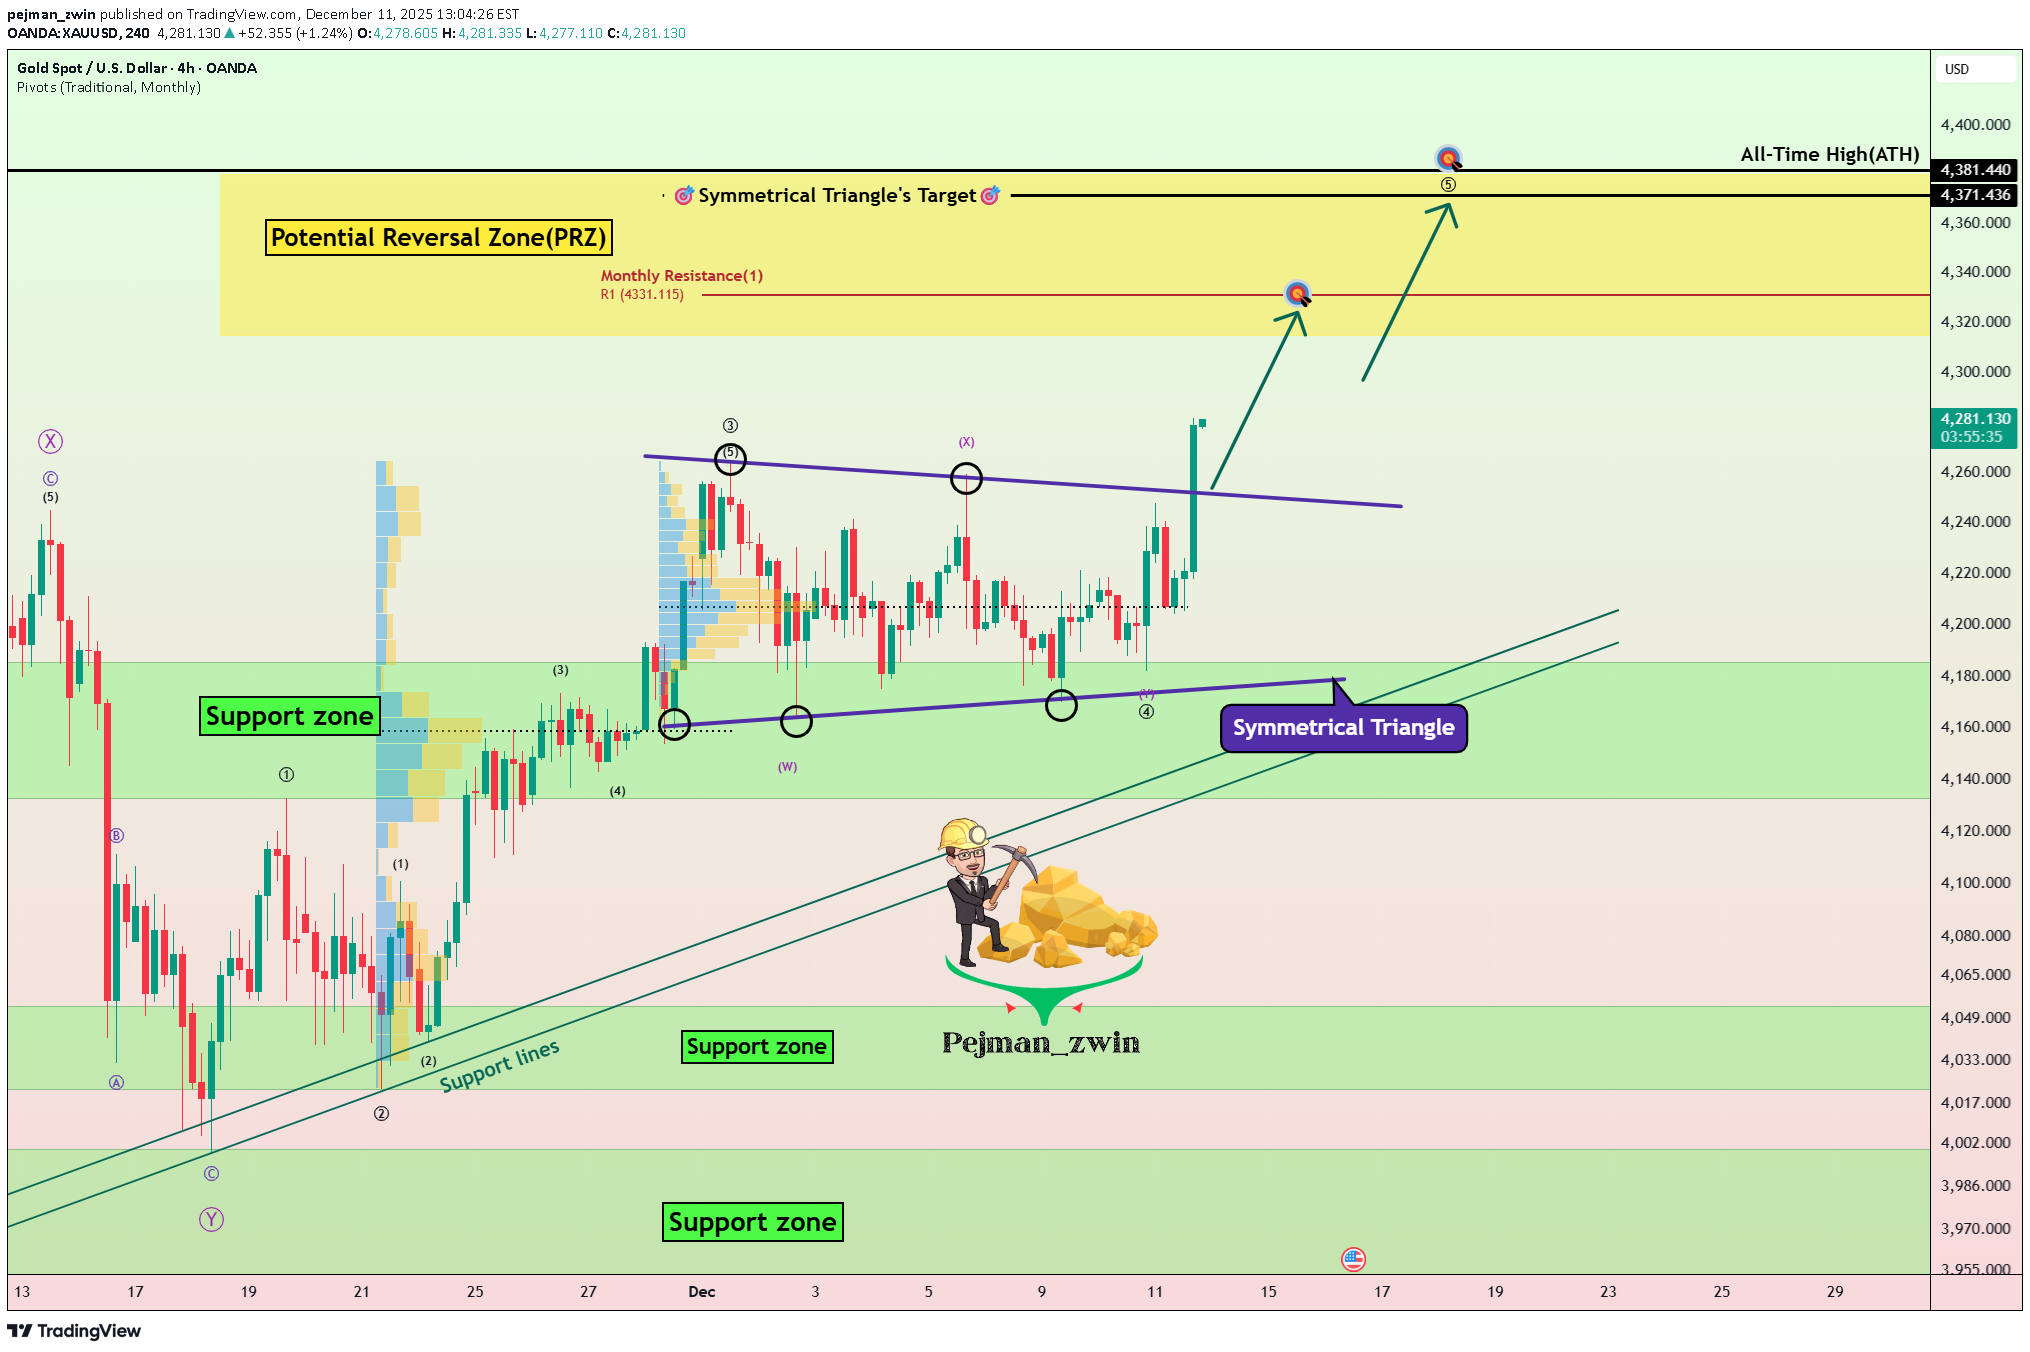
Recently, Gold( XAUUSD ) experienced a significant pump following the U.S. interest rate cut announcement, as expected by the market. With the opening of the U.S. markets, gold seems to have found its path again. Following the recent interest rate announcement and Jerome Powell’s comments, gold has re-established its bullish trend by breaking the upper line of the symmetrical triangle. From an Elliott Wave perspective, it appears that gold has completed wave 4. Given that wave 4 may have taken the form of a symmetrical triangle, this aligns well with Elliott guidelines. The big question is whether gold can achieve new all-time highs. I expect that after a potential pullback to the symmetrical triangle’s upper line, gold will resume its upward movement toward the Potential Reversal Zone(PRZ) [$4,380-$4,314]. If the bullish momentum persists, we could see gold setting new all-time highs in the coming days. However, given the proximity to these highs, taking long positions could be riskier. Still, short-term timeframes may offer opportunities to capitalize on gold’s bullish trend. What do you think? Will gold reach new all-time highs, or should we brace for a correction? Target: Potential Reversal Zone(PRZ) [$4,380-$4,314] Stop Loss(SL): $4,215(Worst) Points may shift as the market evolves 💡 Please respect each other's opinions and express agreement or disagreement politely. 📌 Gold Analyze (XAUUSD), 4-hour time frame. 🛑 Always set a Stop Loss(SL) for every position you open. ✅ This is just my idea; I’d love to see your thoughts too! 🔥 If you find it helpful, please BOOST this post and share it with your friends.Trade was activated when gold pulled back to the upper line of the symmetrical triangle.First Target DoneGold started to rise as I expected after the pullback and rose to the Potential Reversal Zone(PRZ) [$4,380-$4,314]. Potential Reversal Zone(PRZ) [$4,380-$4,314] performed well.
pejman_zwin
بیت کوین در مقاومت حیاتی: آیا تله صعودی در راه است؟
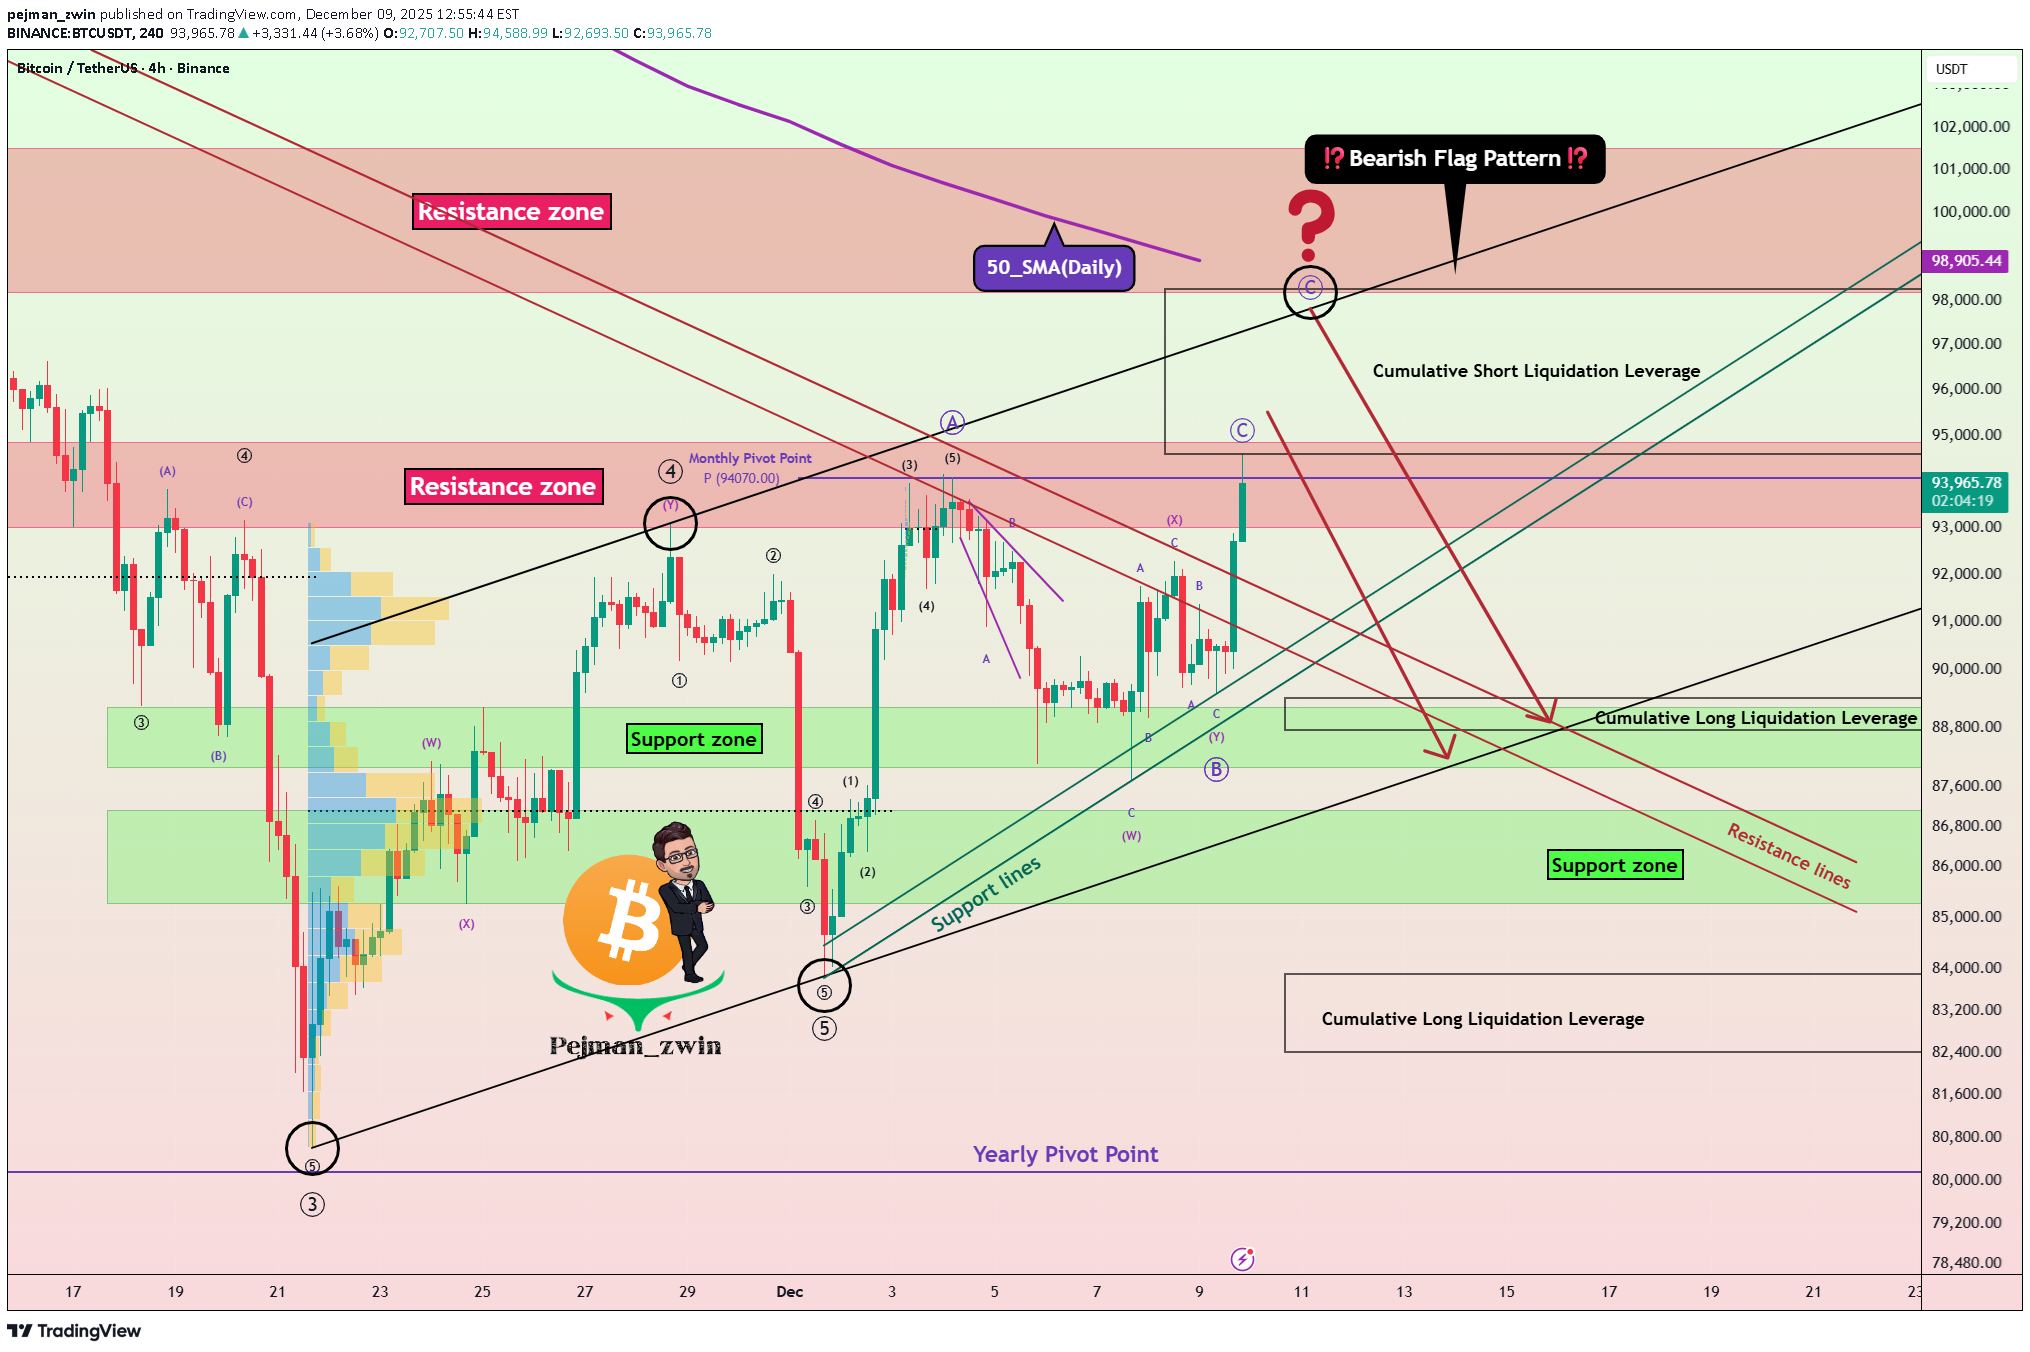
Over the past couple of hours, Bitcoin ( BTCUSDT ) has surprised many traders—including myself—with its sharp movements. The potential reason behind this could be an anticipated interest rate cut tomorrow. However, the recent JOLTS Job Openings did not fully align with that expectation. With our technical analysis tools, we can delve deeper into Bitcoin’s next moves. The key question is whether Bitcoin will maintain its recent bullish momentum or if a reversal is imminent. It’s important to note that in the next 24 to 48 hours, we may see increased volatility in the financial markets, particularly in crypto. Therefore, it’s wise to practice good risk management—or even consider staying on the sidelines until the market settles. At the moment, Bitcoin has managed to break through resistance lines, but the volume of this breakout hasn’t been particularly high. Bitcoin is also near a resistance zone($94,850-$93,000), monthly pivot points, and significant levels of Cumulative Short Liquidation Leverage($98,260-$94,600), all of which add to the complexity. High sell orders: $96,000-$94,800 From a classical technical standpoint, there’s potential for a bearish flag pattern forming. As long as Bitcoin remains below $100,000, this scenario remains plausible. From an Elliott Wave perspective, it seems that the main Wave B has completed, and we’re likely looking at a ZigZag correction(ABC/5-3-5). This correction might complete either at the resistance zone($94,850-$93,000) or near the daily 50_SMA(Daily). Considering that the S&P 500 index ( SPX ) is also showing a bearish trend, it’s more likely that Bitcoin’s main corrective Wave C will complete within these resistance levels. Also, the USDT.D% ( USDT.D ) remains a crucial factor. Until it hits around 5.49%, the overall crypto market is likely to remain bearish. In conclusion, I expect that Bitcoin will continue its downward movement, potentially testing $89,000 and even dropping below $85,000. This could represent a significant bearish phase for Bitcoin. What are your thoughts? Do you think Bitcoin will maintain this bullish momentum, or are we headed for more downside? Cumulative Long Liquidation Leverage: $89,430-$88,750 Cumulative Long Liquidation Leverage: $83,900-$82,400 First Target: $90,300 Second Target: $87,503 Stop Loss(SL): $100,020(Worst) Points may shift as the market evolves 💡 Please respect each other's opinions and express agreement or disagreement politely. 📌Bitcoin Analysis (BTCUSDT), 4-hour time frame. 🛑 Always set a Stop Loss(SL) for every position you open. ✅ This is just my idea; I’d love to see your thoughts too! 🔥 If you find it helpful, please BOOST this post and share it with your friends.Trade was activated in the resistance zone($94,850-$93,000), and I transferred the Stop loss to Entry point=Risk Free.Less than 30 minutes left until the release of the Federal Funds Rate. Volatility may continue until the FOMC Press Conference.Target Done(trailing stop)
pejman_zwin
بیت کوین پس از جهش، سقوط کرد: سیگنال فروش قدرتمند چه میگوید؟
As I expected , Bitcoin bounced from the support zone and reached its targets. Right now, Bitcoin has rejected from resistance lines and successfully broke both the support line and the support zone($90,650-$90,000). From an Elliott Wave perspective, it appears that Bitcoin has completed a ZigZag structure, and we should now anticipate the start of a bearish wave sequence. The S&P 500 index( SPX ) also shows a bearish outlook, and given Bitcoin’s correlation with SPX, further downside in BTC is not surprising. At the same time, USDT.D%( USDT.D ) has turned bullish again—at least in the short term—which can add additional pressure on Bitcoin. I expect Bitcoin to continue its downward movement, at least toward the next support zone($87,140-$85,290) and the lower line of the ascending channel. Note: It’s better to wait for a bullish correction before entering, and then take a short position according to your own strategy. Cumulative Short Liquidation Leverage: $98,260-$96,690 Cumulative Short Liquidation Leverage: $93,040-$92,560 Cumulative Long Liquidation Leverage: $94,840-$94,100 Cumulative Long Liquidation Leverage: $83,900-$82,400 Target: $87,733 Stop Loss(SL): $92,723(Worst) Points may shift as the market evolves 💡 Please respect each other's opinions and express agreement or disagreement politely. 📌Bitcoin Analysis (BTCUSDT), 1-hour time frame. 🛑 Always set a Stop Loss(SL) for every position you open. ✅ This is just my idea; I’d love to see your thoughts too! 🔥 If you find it helpful, please BOOST this post and share it with your friends.Since the SPX500 index is likely to fall and due to the USDT.D% conditions, we can still consider Bitcoin's fall likely. The JOLTS Job Openings index will be released in less than 4 hours, and if there are no special surprises in the announcement of this index, Bitcoin could maintain its downward trend.
pejman_zwin
نقشه راه بیت کوین: آیا ریزش به زیر ۷۵ هزار دلار قطعی است یا خیزش در راه؟
Bitcoin( BTCUSDT ) began to decline from the resistance zone($95,020-$94,840) exactly as expected in my previous idea , successfully reaching all targets. At the moment, Bitcoin was able to break the support zone($90,650-$90,000). It seems that the pullback to the broken support zone($90,650-$90,000) could be completed with a symmetrical triangle pattern, although given the low trading volume on Saturday and Sunday, this triangle may not function properly. In terms of Elliott Wave theory, Bitcoin appears to be completing the microwave C of the main wave B, and I expect at least one more impulsive 5-wave move to the upside. I expect Bitcoin to start rising from the support zone($89,230-$88,000) or the Potential Reversal Zone(PRZ) [$87,820-$87,120] maximum. A break of the resistance lines could be a good sign for Bitcoin to rise again. What do you think? Do you believe Bitcoin will dip below $75,000, or will it bounce back? Cumulative Short Liquidation Leverage: $98,260-$96,690 Cumulative Short Liquidation Leverage: $90,560-$89,990 Cumulative Long Liquidation Leverage: $87,820-$87,290 Cumulative Long Liquidation Leverage: $83,900-$82,400 First Target: $89,911 Second Target: $92,119 Stop Loss(SL): $86,120(Worst) Points may shift as the market evolves 💡 Please respect each other's opinions and express agreement or disagreement politely. 📌Bitcoin Analysis (BTCUSDT), 1-hour time frame. 🛑 Always set a Stop Loss(SL) for every position you open. ✅ This is just my idea; I’d love to see your thoughts too! 🔥 If you find it helpful, please BOOST this post and share it with your friends.Bitcoin fell as expected to the Potential Reversal Zone(PRZ) [$87,820-$87,120], and Cumulative Long Liquidation Leverage( $87,820-$87,290), and the short position target was touched. It seems that the main wave B is completed; however, the break of the resistance lines should confirm the downward corrective waves on the 1-hour time frame. Long position activated on Potential Reversal Zone(PRZ) [$87,820-$87,120].
pejman_zwin
بیت کوین ۱۰٪ جهش کرد: تله گاوی یا شروع روند صعودی جدید؟
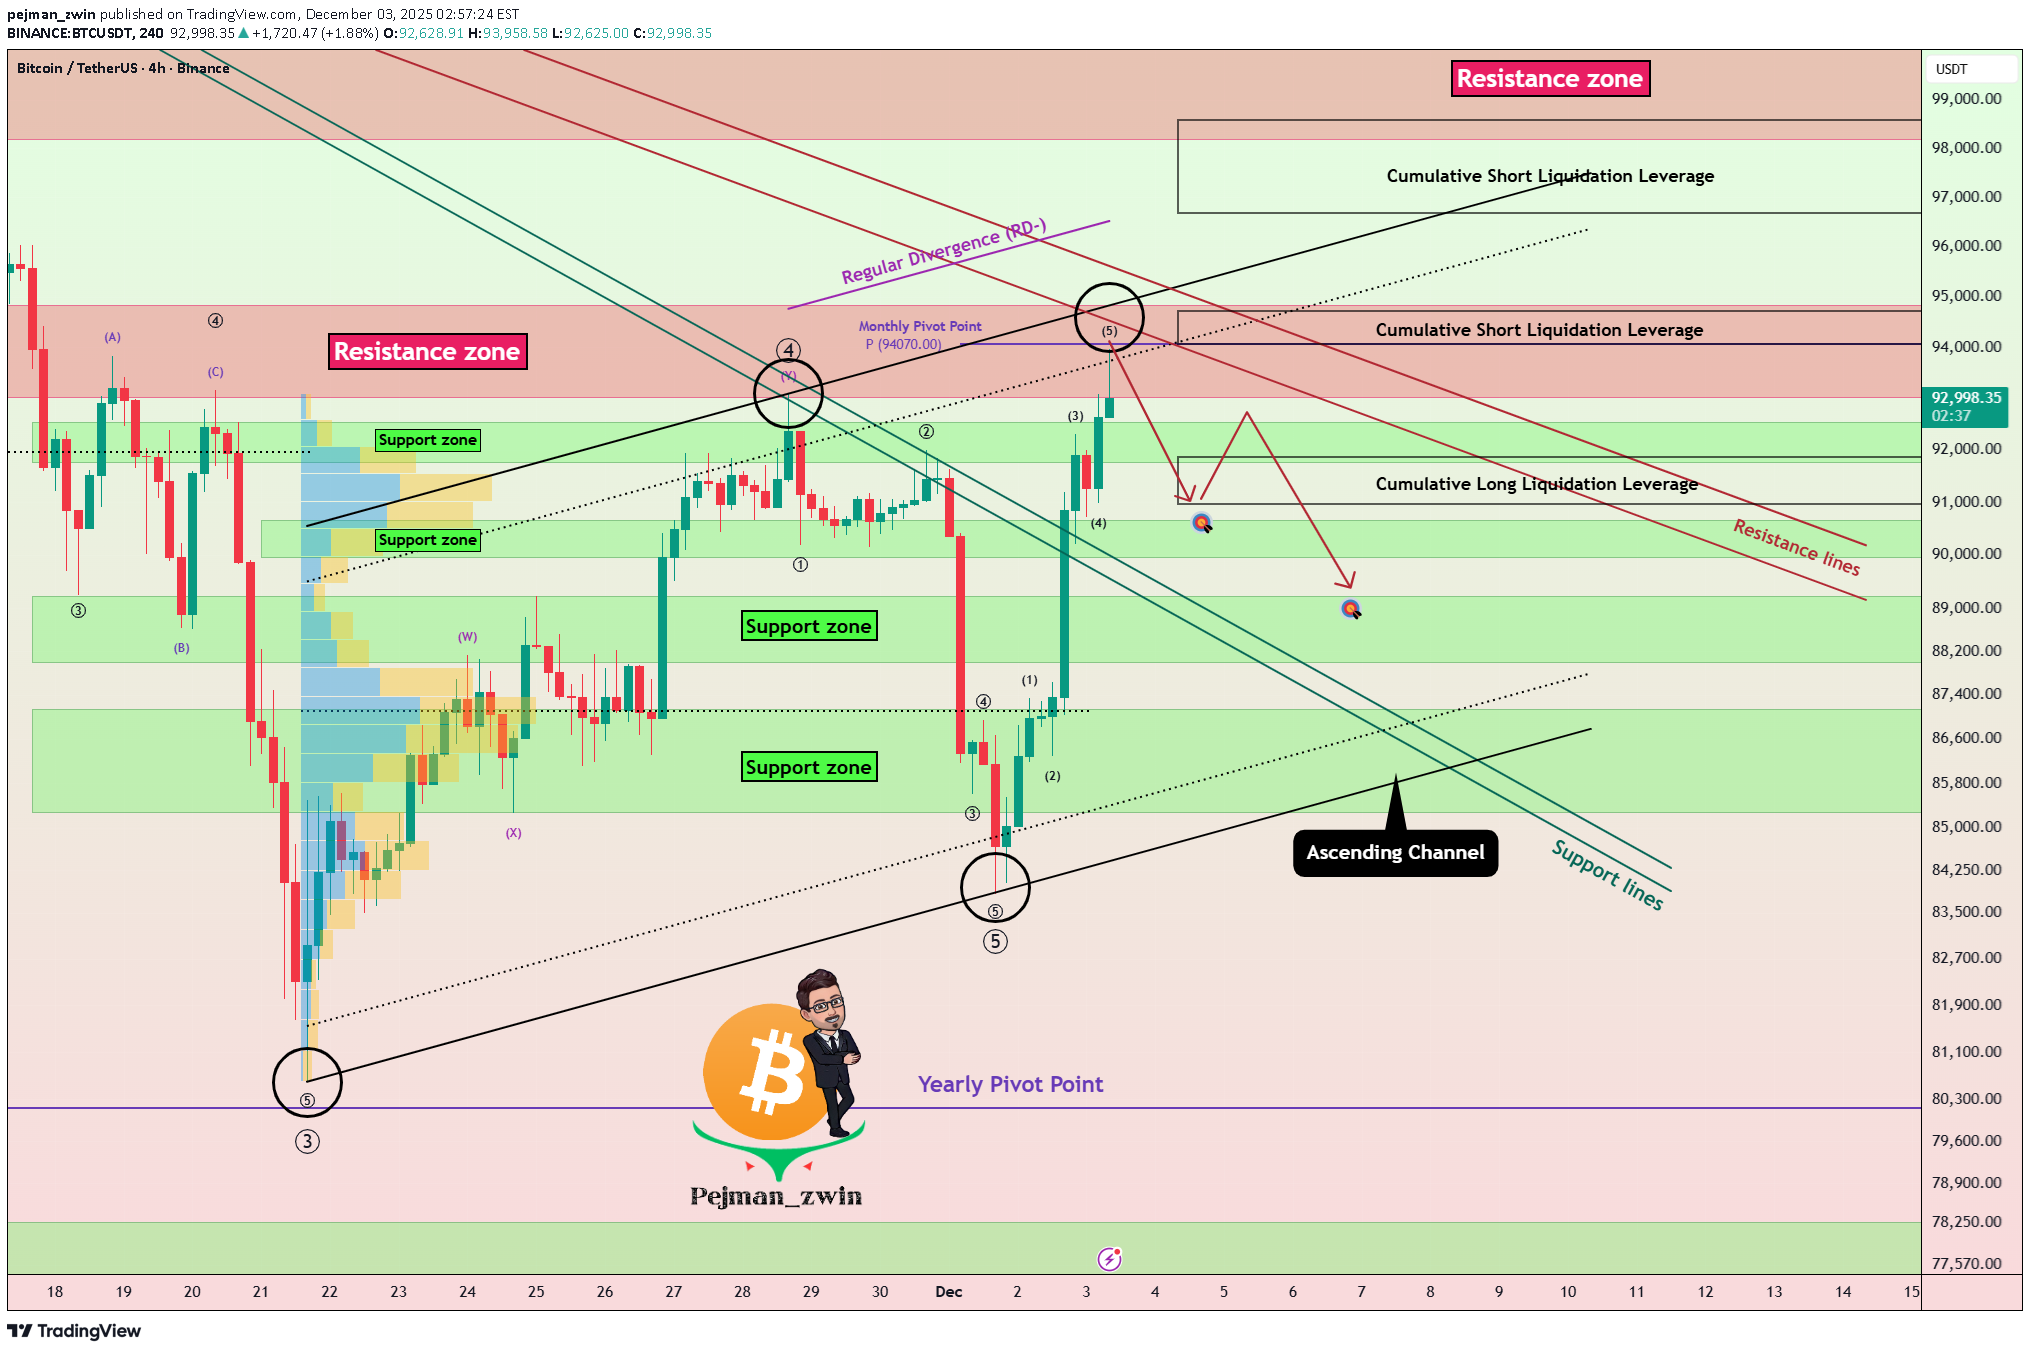
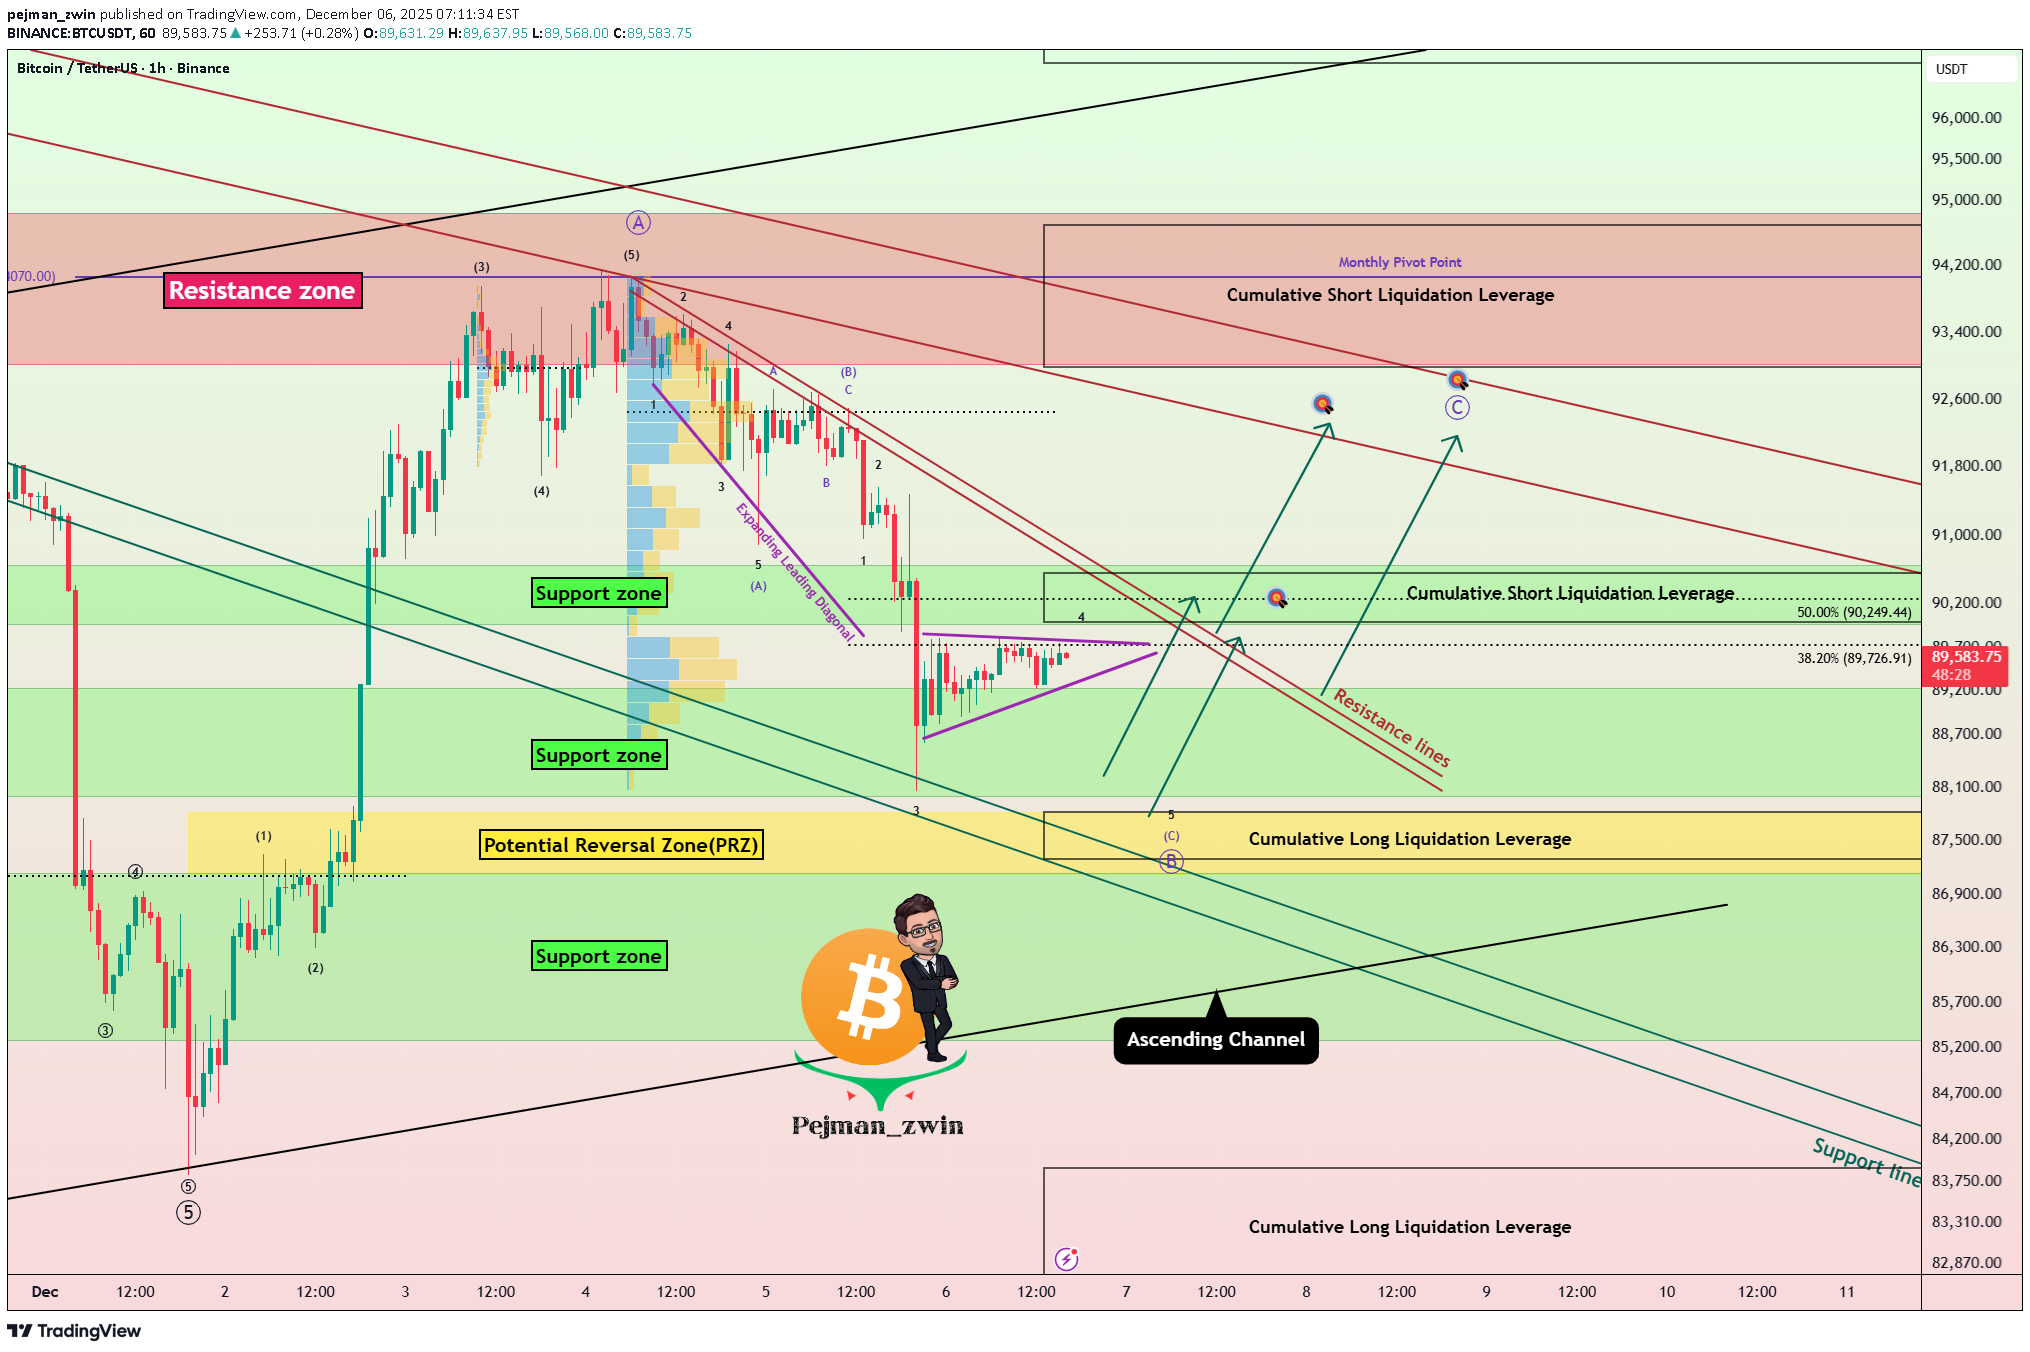
Bitcoin( BTCUSDT ) has experienced over a +10% increase in the past two days, which came as a surprise to many analysts considering the previous bearish momentum. In other words, Bitcoin is on something of a roller coaster lately😂. The question now is whether Bitcoin has started a new bullish trend or if it’s likely to see another decline. Let’s dive into the 4-hour chart of Bitcoin. Currently, Bitcoin is approaching a resistance zone($94,850-$93,000), a Cumulative Short Liquidation Leverage($94,710-$94,063), and the monthly pivot point. This cluster of resistances, combined with the recent upward momentum, might make it challenging for Bitcoin to break through. It’s also worth noting that the trading volume during this recent rally hasn’t been particularly high, so Bitcoin could still surprise us. This recent behavior shows that Bitcoin can move sharply both up and down, so it’s crucial to maintain proper risk management. From an Elliott Wave perspective, considering Bitcoin’s recent decline, I initially expected that Bitcoin might at least test the low of its main wave 3 again. However, the recent rebound suggests that the main wave 5 may be truncated, and the corrective waves could still push Bitcoin lower, potentially even below $75,000. From a classical technical analysis perspective, Bitcoin might be forming a bearish flag pattern, with the ascending channel acting as the flag’s pole. In addition, the USDT.D%( USDT.D ) is still on an upward trend, which indicates that the cryptocurrency market might still face downward pressure. Moreover, geopolitical tensions, such as those between the U.S. and Venezuela, could also act as a trigger for further Bitcoin declines if they escalate. Lastly, the S&P 500 index( SPX ), despite its recent bullish trend, doesn’t show the same positive correlation with Bitcoin. In fact, a decline in the S&P 500 could amplify Bitcoin’s downward movement. Considering all these factors, I expect Bitcoin to continue its bearish trend and potentially test the heavy support zone. If these support levels break, we could see even more significant declines in the crypto market. Based on the above explanation, I expect Bitcoin to have at least a correction to the targets I specified on the chart, and then depending on the momentum, we can expect a continuation of the decline or a resurgence. Note: In general, with the opening of the US markets, financial market movements have become more intense these days than before, and it is better to be prepared for any scenario at that time. What do you think? Do you believe Bitcoin will dip below $75,000, or will it bounce back? Cumulative Short Liquidation Leverage: $98,591-$96,688 Cumulative Long Liquidation Leverage: $91,860-$90,960 Stop Loss(SL): $96,200 Points may shift as the market evolves 💡 Please respect each other's opinions and express agreement or disagreement politely. 📌Bitcoin Analysis (BTCUSDT), 4-hour time frame. 🛑 Always set a Stop Loss(SL) for every position you open. ✅ This is just my idea; I’d love to see your thoughts too! 🔥 If you find it helpful, please BOOST this post and share it with your friends.Trade was activatedFirst Target Done
pejman_zwin
بدترین نوامبر بیت کوین: آیا سقوط ادامه مییابد یا زمان خرید است؟
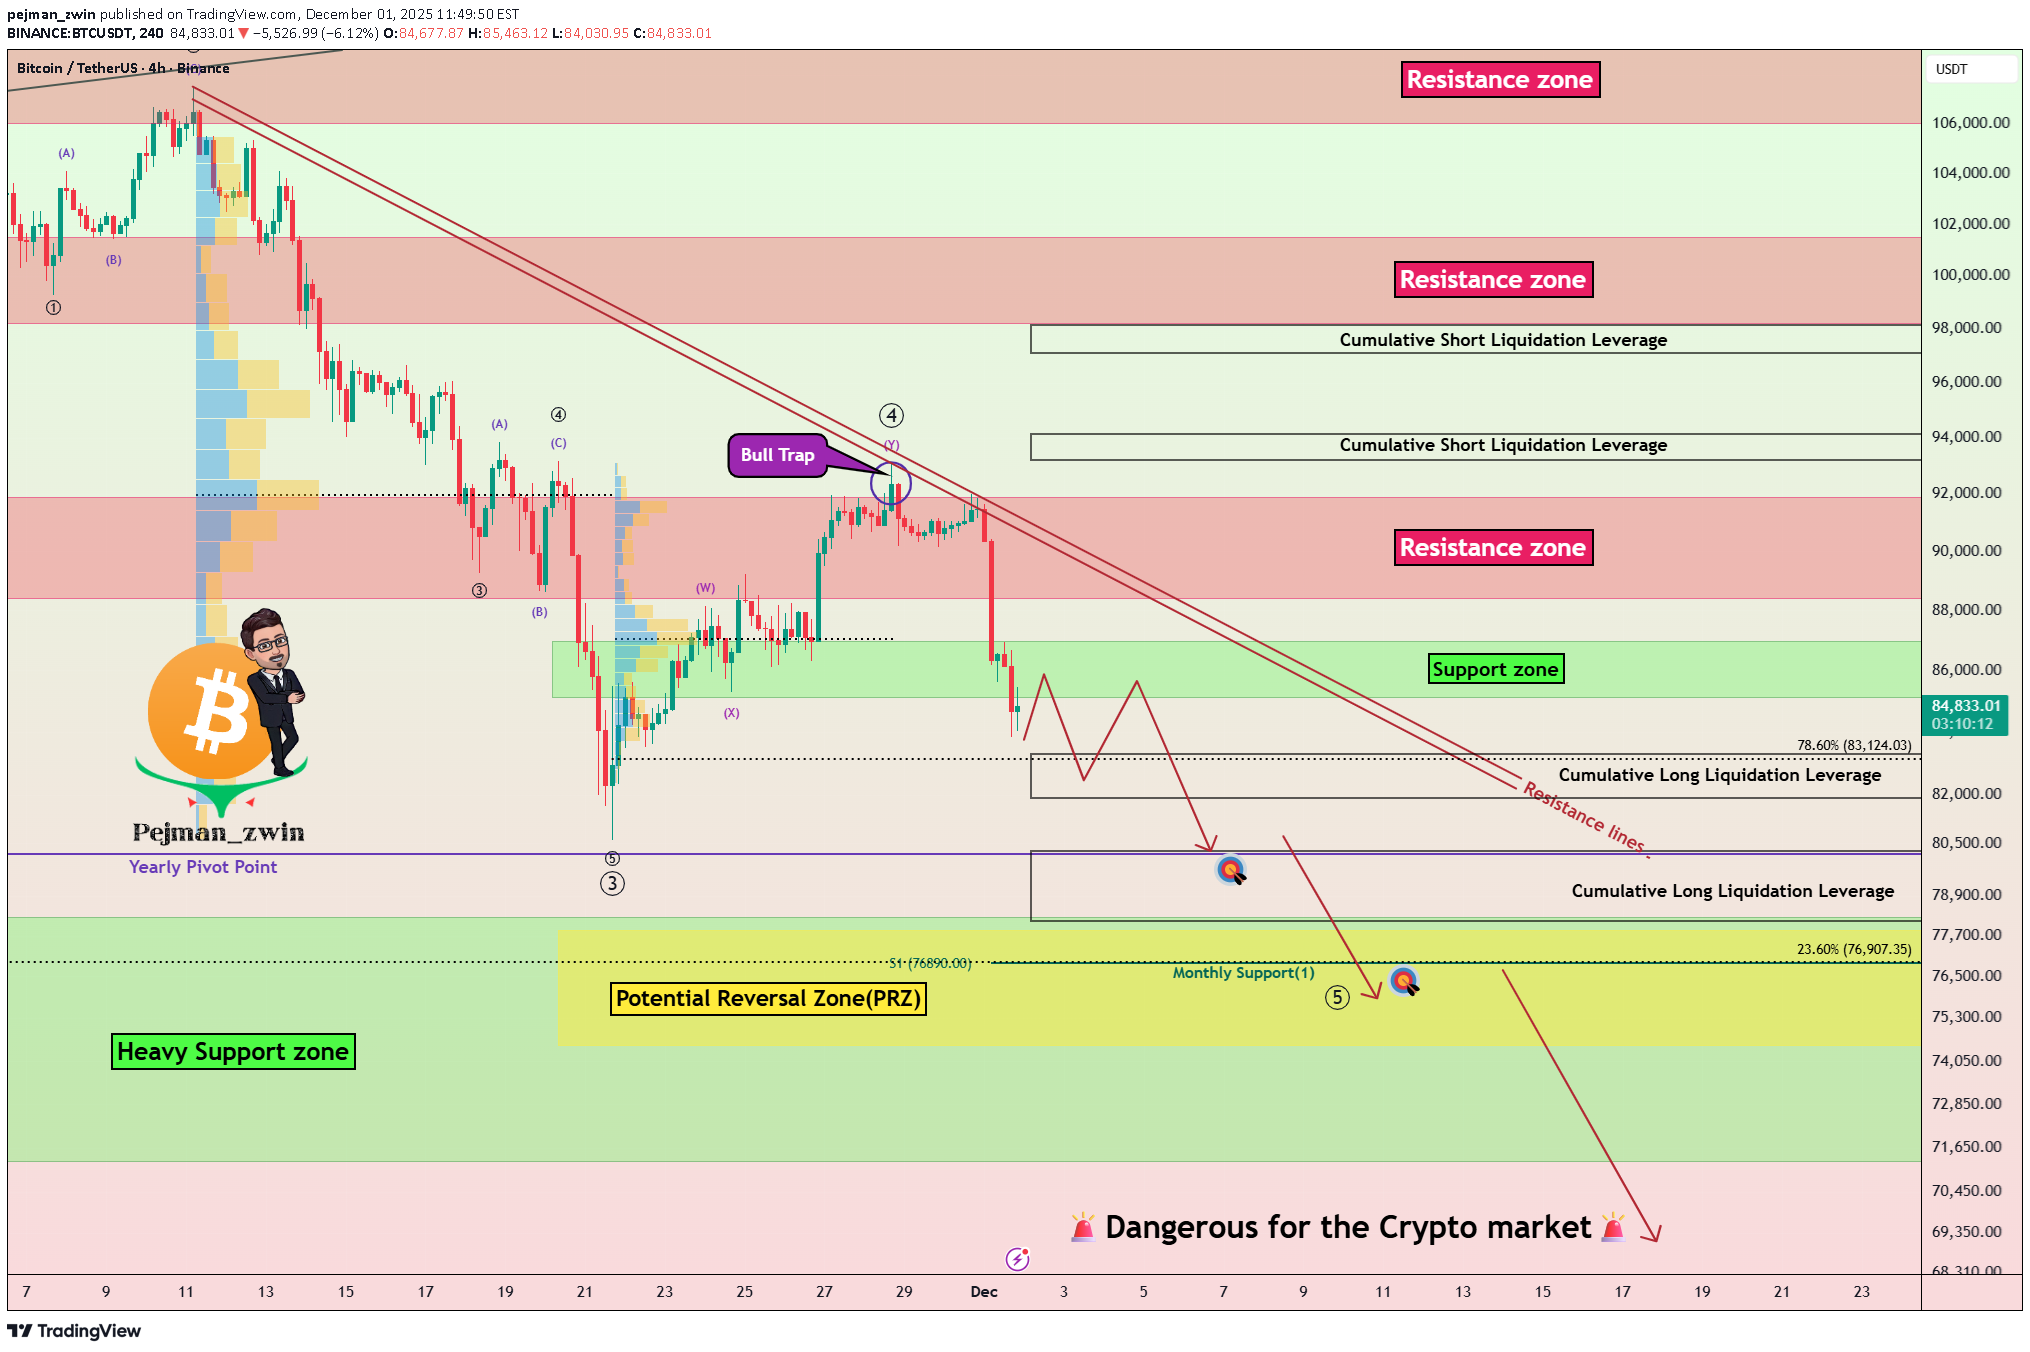
In the past 24 hours, Bitcoin( BTCUSDT ) has dropped by more than -8%, marking its worst November performance ever, with a decline of about -17.67% this month alone. Now, the question is whether Bitcoin will continue its downward trend or start to rebound. So, stay tuned! At the moment, it seems that Bitcoin has successfully broken through the support zone($87,000-$85,130) and is moving toward the Cumulative Long Liquidation Leverage($83,273-$81,900). From an Elliott Wave perspective, it appears that Bitcoin has completed its main wave 4, forming a bull trap, and is now in the process of completing the main wave 5. On the fundamental side, we need to pay attention to a few key factors: 1-For one, the USDT.D% ( USDT.D ) is on the rise, and this could put downward pressure on the crypto market. 2-Another point is that the stock market is also trending upward, but unlike stocks, Bitcoin tends to react more negatively when the stock market declines. 3-The US 10-Year Government Bond Yield ( US10 ) also appears to be trending upward, causing riskier assets like stocks and Bitcoin to decline. 4-Additionally, geopolitical tensions, especially between the US and Venezuela over the past 72 hours, could also trigger further declines in Bitcoin if they escalate. Considering all of this, I expect Bitcoin to continue its downward trend and test the heavy support zone($78,300-$71,280). The Potential Reversal Zone(PRZ) [$77,850-$74,500] might serve as a rebound point for Bitcoin, but if the heavy support zone($78,300-$71,280) is broken, we could see a more severe sell-off in the crypto markets. What do you think? Will Bitcoin drop below $70,000 or not? Let me know your thoughts! Cumulative Short Liquidation Leverage: $97,100-$98,135 Cumulative Short Liquidation Leverage: $93,215-$94,130 Cumulative Long Liquidation Leverage: $80,263-$78,131 First Target: Cumulative Long Liquidation Leverage: $80,263-$78,131 Second Target: Potential Reversal Zone(PRZ) [$77,850-$74,500] Stop Loss(SL): $90,423 Points may shift as the market evolves 💡 Please respect each other's opinions and express agreement or disagreement politely. 📌Bitcoin Analysis (BTCUSDT), 4-hour time frame. 🛑 Always set a Stop Loss(SL) for every position you open. ✅ This is just my idea; I’d love to see your thoughts too! 🔥 If you find it helpful, please BOOST this post and share it with your friends.New Cumulative Short Liquidation Leverage: $89,014-$87,631 New Cumulative Long Liquidation Leverage: $86,058-$85,558Stop loss was touched, BTC more pumps right now. I am looking for a Long position.
pejman_zwin
تحلیل فنی XRP: آیا مثلث شکسته میشود و ریزش بزرگ در راه است؟
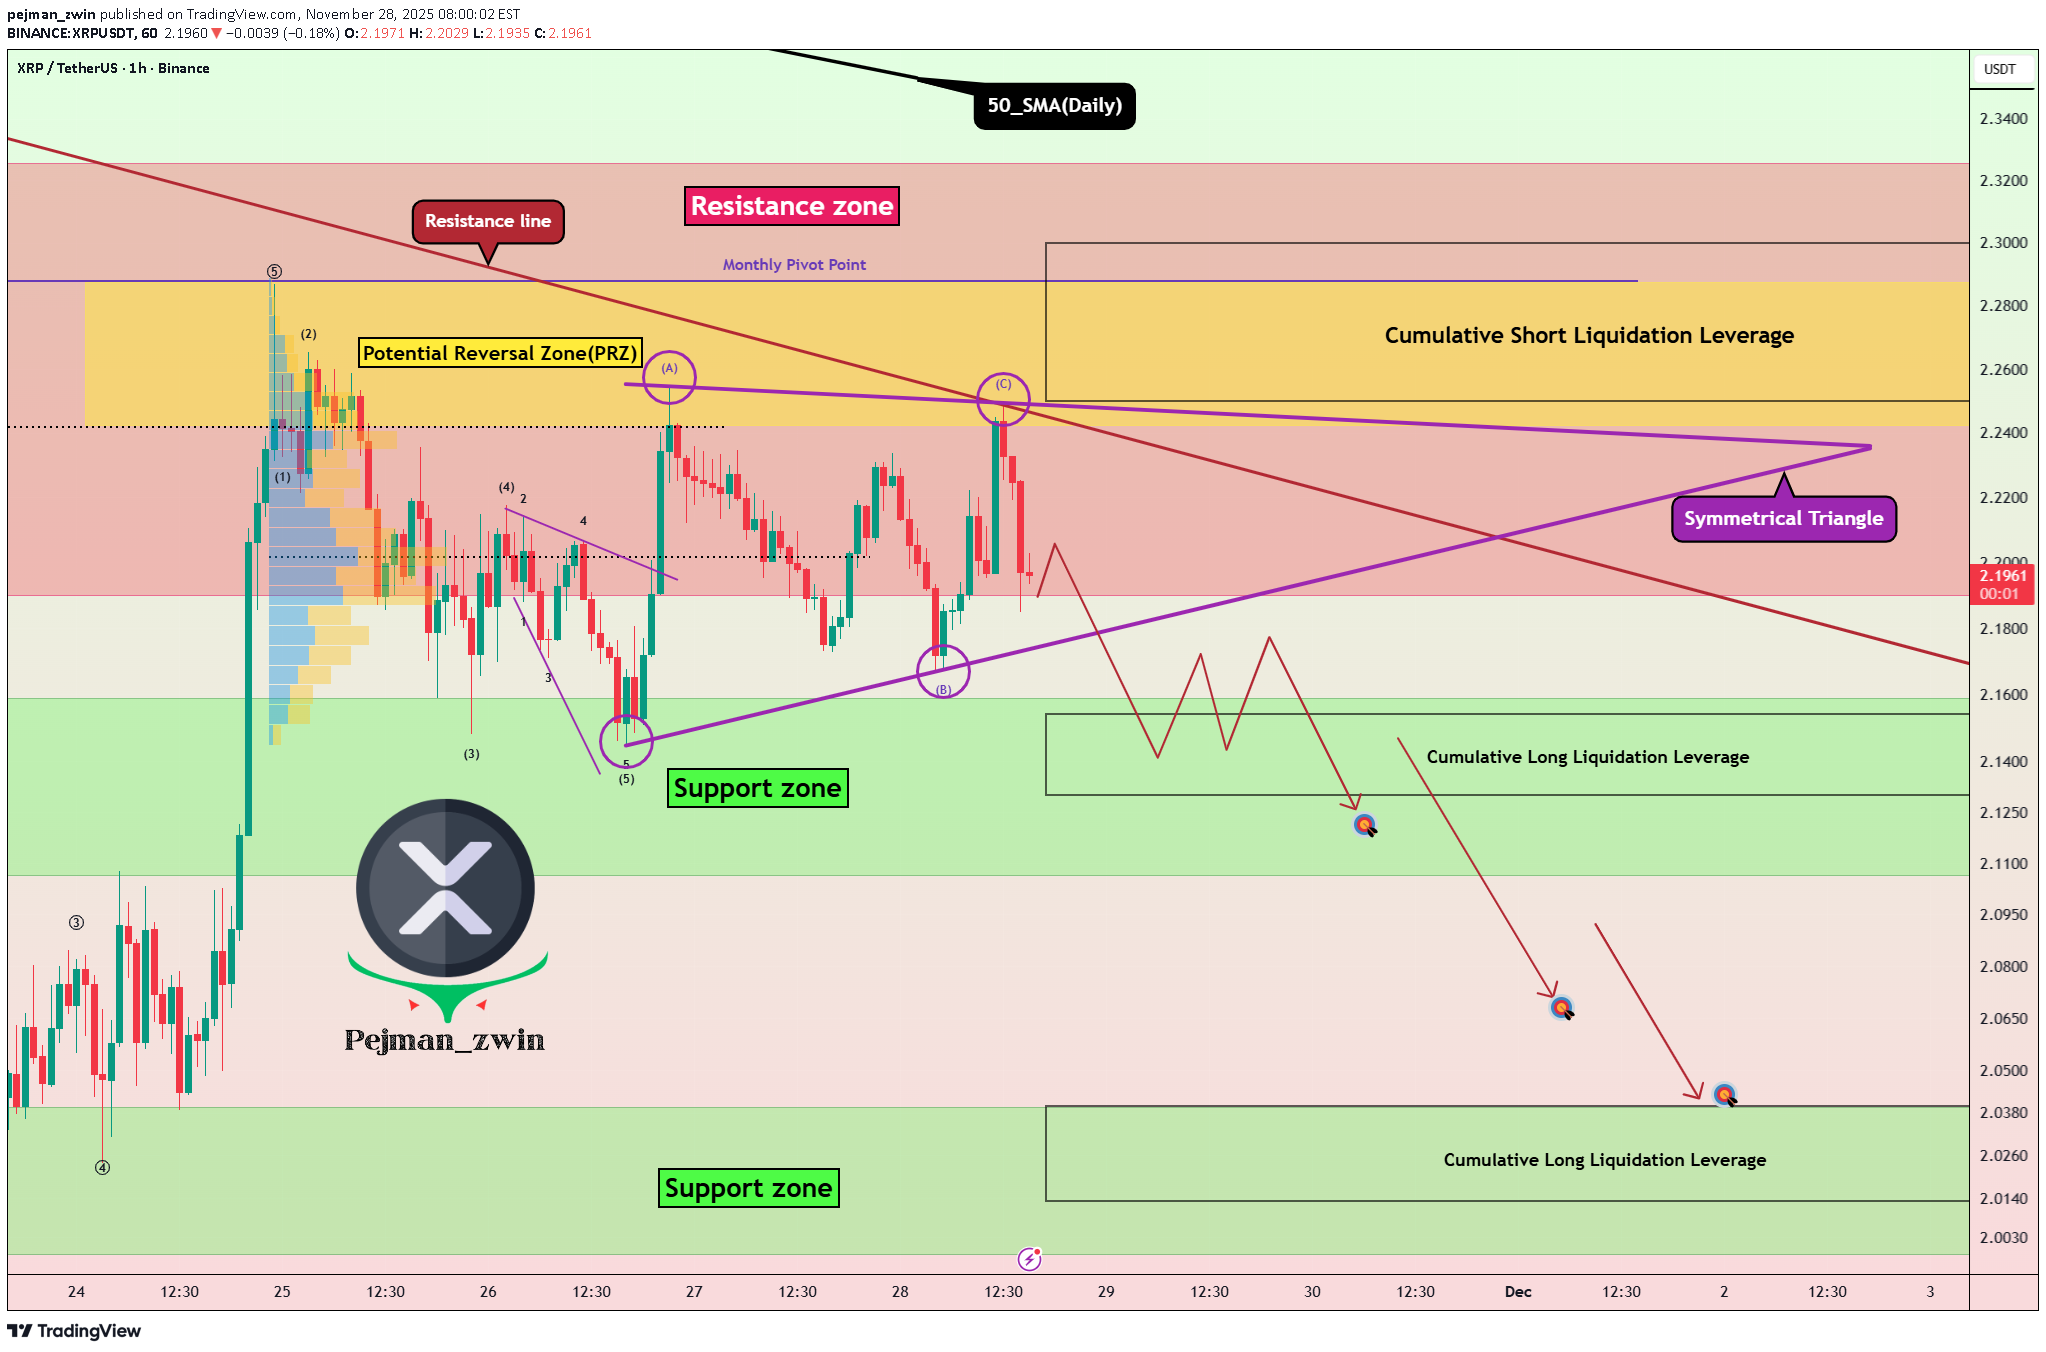
XRP( XRPUSDT ) is moving within a resistance zone($2.32-$2.19) and has shown notable reactions to the resistance line and the Potential Reversal Zone(PRZ) [$2.29-$2.24]. From a technical analysis perspective, it seems that XRP has formed a Symmetrical Triangle Pattern. If the lower line of this pattern is broken, it would align with our analysis. Additionally, from an Elliott Wave theory standpoint, we expect the next corrective wave for XRP, and a break of that lower triangle line would confirm this expectation. I expect that in the upcoming hours, XRP will begin a downward trend and test the support zone($2.16-$2.11). If it breaks through that support, we can expect further declines toward the next support zone($2.04-$2.00) and Cumulative Long Liquidation Leverage($2.04-$2.02). First Target: $2.133 Second Target: $2.069 Third Target: $2.043 Stop Loss(SL): $2.330 Cumulative Short Liquidation Leverage: $2.30-$2.25 Cumulative Long Liquidation Leverage: $2.16-$2.13 💡 Please respect each other's opinions and express agreement or disagreement politely. 📌 XRP Analyze (XRPUSDT), 1-hour time frame. 🛑 Always set a Stop Loss(SL) for every position you open. ✅ This is just my idea; I’d love to see your thoughts too! 🔥 If you find it helpful, please BOOST this post and share it with your friends.Trade was activated in Cumulative Short Liquidation Leverage: $2.30-$2.25Full Target Done
Disclaimer
Any content and materials included in Sahmeto's website and official communication channels are a compilation of personal opinions and analyses and are not binding. They do not constitute any recommendation for buying, selling, entering or exiting the stock market and cryptocurrency market. Also, all news and analyses included in the website and channels are merely republished information from official and unofficial domestic and foreign sources, and it is obvious that users of the said content are responsible for following up and ensuring the authenticity and accuracy of the materials. Therefore, while disclaiming responsibility, it is declared that the responsibility for any decision-making, action, and potential profit and loss in the capital market and cryptocurrency market lies with the trader.