
faisal_qaisy5
@t_faisal_qaisy5

What symbols does the trader recommend buying?
Purchase History
پیام های تریدر
Filter
faisal_qaisy5
سطوح کلیدی: آیا منطقه برگشت قیمت در PERP در شرف وقوع است؟
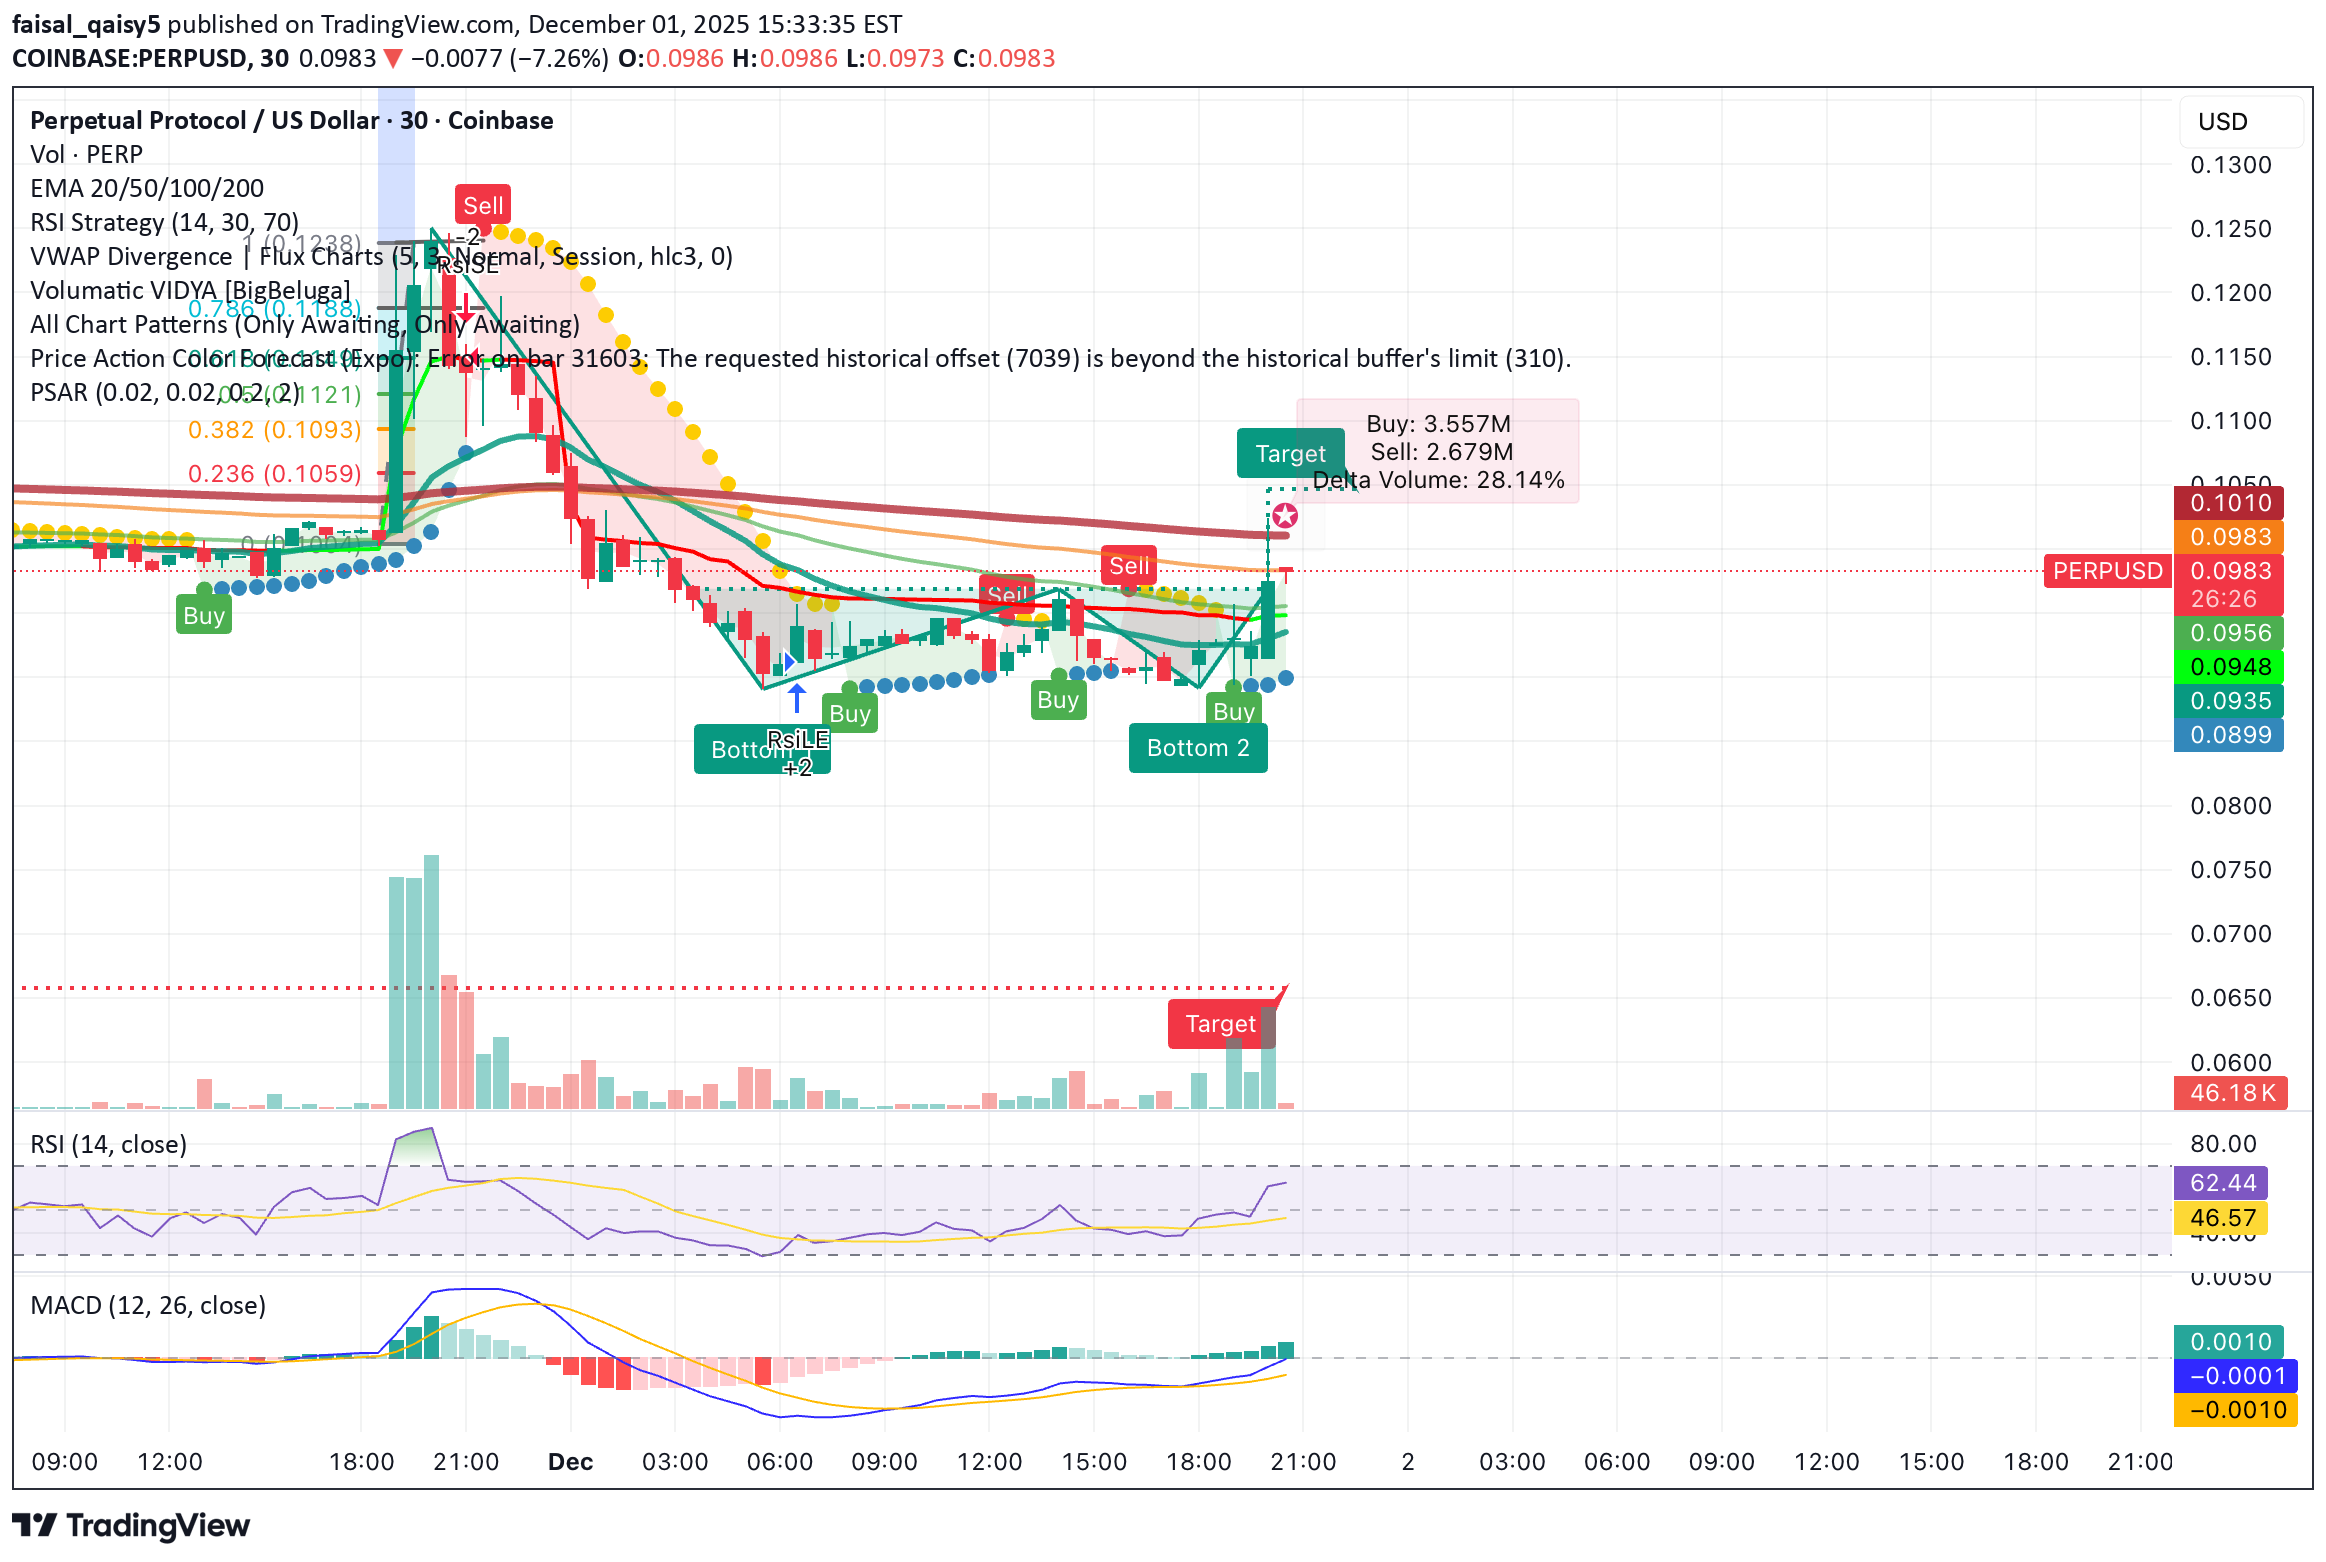
Key Levels: Watching support around 0.0938 MACD (Daily): Momentum is beginning to curl upward, showing early signs of a potential shift in trend. RSI: Sitting in oversold territory, historically an area where PERP often reacts. Volume: Gradually increasing, signaling growing interest as price approaches a major support zone. Idea PERPUSD is sitting on a strong historical demand level while multiple momentum indicators show early reversal conditions. If buyers continue to step in and volume expands on green candles, this area could mark the start of a short-term bounce or even a broader trend recovery. Invalidation A clean breakdown below support would invalidate the reversal structure.
faisal_qaisy5
راز رسیدن به قله: سطوح حمایتی و مقاومتی کلیدی برای سودآوری فوری!

All you need to know: 🟩 Support Levels (visible on the chart) $0.791 — The lowest green EMA ribbon line at the bottom of the indicator cluster; this is a major support floor. $0.820 – $0.871 — Multiple EMA levels (100/200) converge here, forming a strong support zone where price consolidated before the breakout. $0.914 – $0.925 — Bollinger Band midline and EMA 50–20 cluster; acts as a short-term support area. $0.943 — Labeled as VWAP Divergence (Flux Charts); current dynamic support after the breakout. 🟥 Resistance Levels (clearly marked on chart) $1.037 — Marked horizontal red line labeled “BB 20 SMA close 2”; immediate overhead resistance. $1.159 — The major resistance line shown in red near the top of the chart — likely the next key upside target (where the upward arrow points). $1.200 (approx) — Slightly above the 1.159 mark; the top psychological zone visible on the price axis. Currently a recent breakout upward move with a large green candle breaking above all moving averages and ribbons. Volume: 124.1K, confirming strong buying activity. EMA trend: Bullish crossover — all EMAs (20/50/100/200) are aligned upward. ⚙️ Visual Interpretation The arrow drawn upward from $0.986 targets the $1.15–$1.16 resistance area, indicating bullish sentiment or an anticipated move toward that level. If rejected near $1.037, price might retest supports near $0.94 or $0.92 before continuing higher. ✅ Summary from day chart Immediate Support: $0.943 → $0.914 → $0.871 Immediate Resistance: $1.037 → $1.159 Short-term bullish momentum after strong breakout Happy hunting!
faisal_qaisy5
ABT is about to explode - watch out for the breakout

Currently consolidating, last year same time went up +100%. Watch out for the upcoming breakout which I expect it to be in the net two to three days. Happy hunting
Disclaimer
Any content and materials included in Sahmeto's website and official communication channels are a compilation of personal opinions and analyses and are not binding. They do not constitute any recommendation for buying, selling, entering or exiting the stock market and cryptocurrency market. Also, all news and analyses included in the website and channels are merely republished information from official and unofficial domestic and foreign sources, and it is obvious that users of the said content are responsible for following up and ensuring the authenticity and accuracy of the materials. Therefore, while disclaiming responsibility, it is declared that the responsibility for any decision-making, action, and potential profit and loss in the capital market and cryptocurrency market lies with the trader.