
APE
ApeCoin
| تریدر | نوع سیگنال | حد سود/ضرر | زمان انتشار | مشاهده پیام |
|---|---|---|---|---|
خرید | حد سود: تعیین نشده حد ضرر: تعیین نشده | 12/21/2025 |

Price Chart of ApeCoin
سود 3 Months :
سیگنالهای ApeCoin
Filter
Sort messages by
Trader Type
Time Frame
$APE is EXTREMELY underpriced for being a meme coin
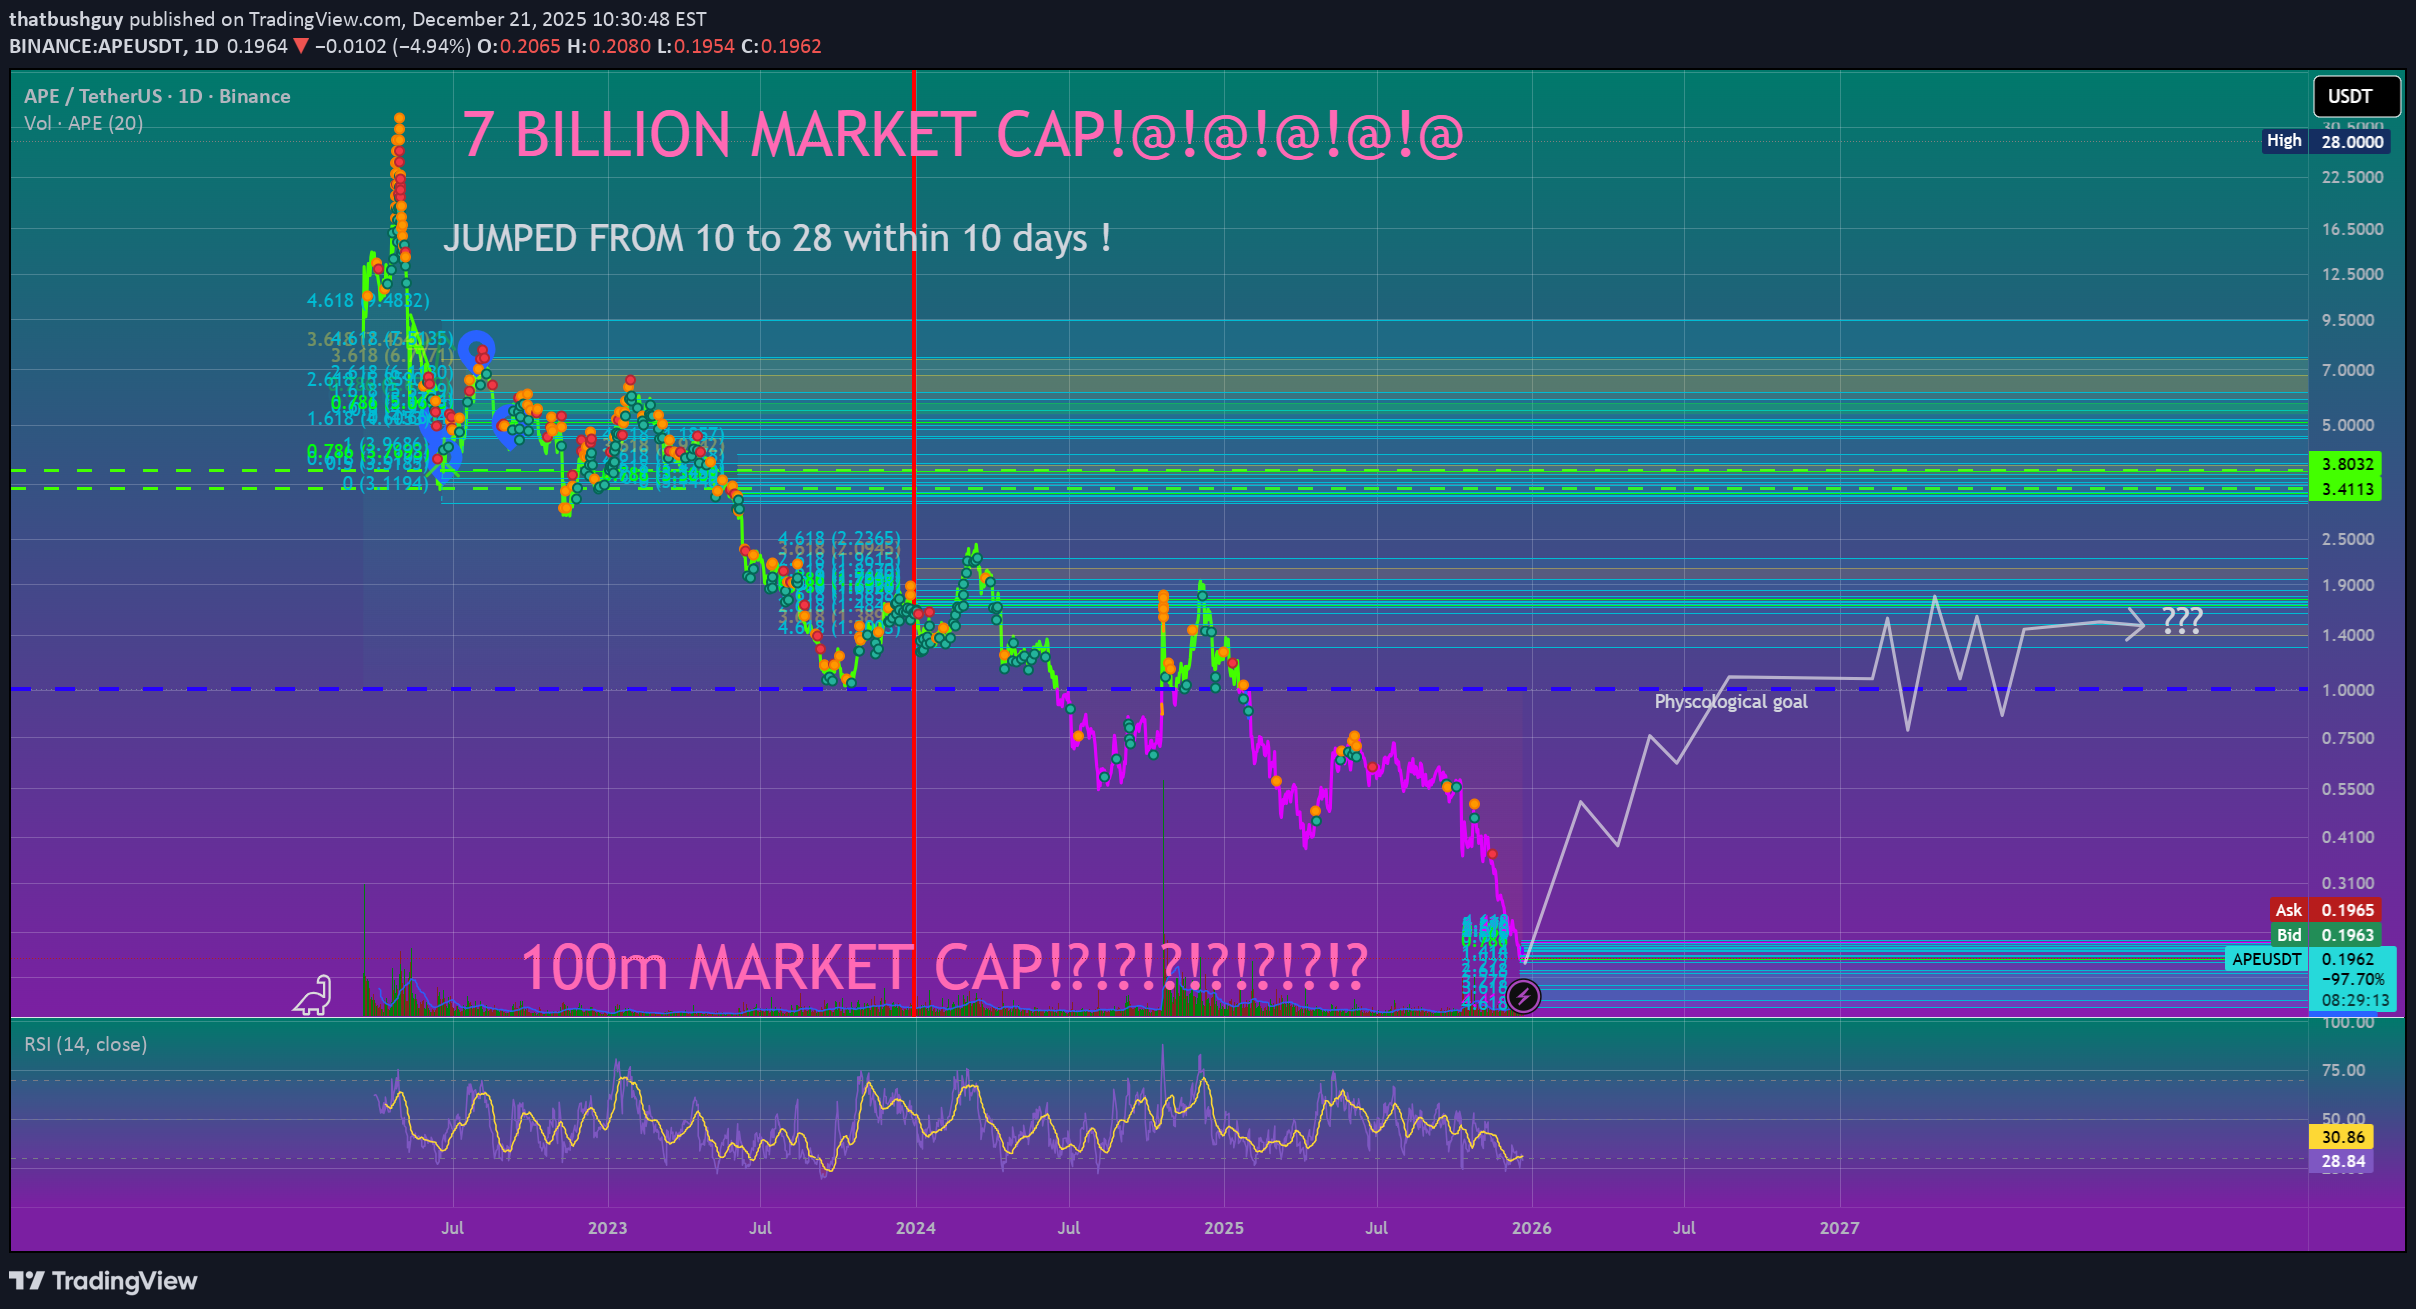
When it got added to the canadian market Wealthsimple it, like every other new crypto added to Wealthsimple(not anymore there's too many), It Shot to the moon in a week tripling in value! A back of the mind crypto once worth nearly 8 BILLION is finding a floor at 100m+. A psychological target of $1 from 20 cents will easily 5x with such little market cap!
تحلیل حیاتی APE: آیا ریزش ادامه دارد یا لحظه انفجار فرا رسیده است؟
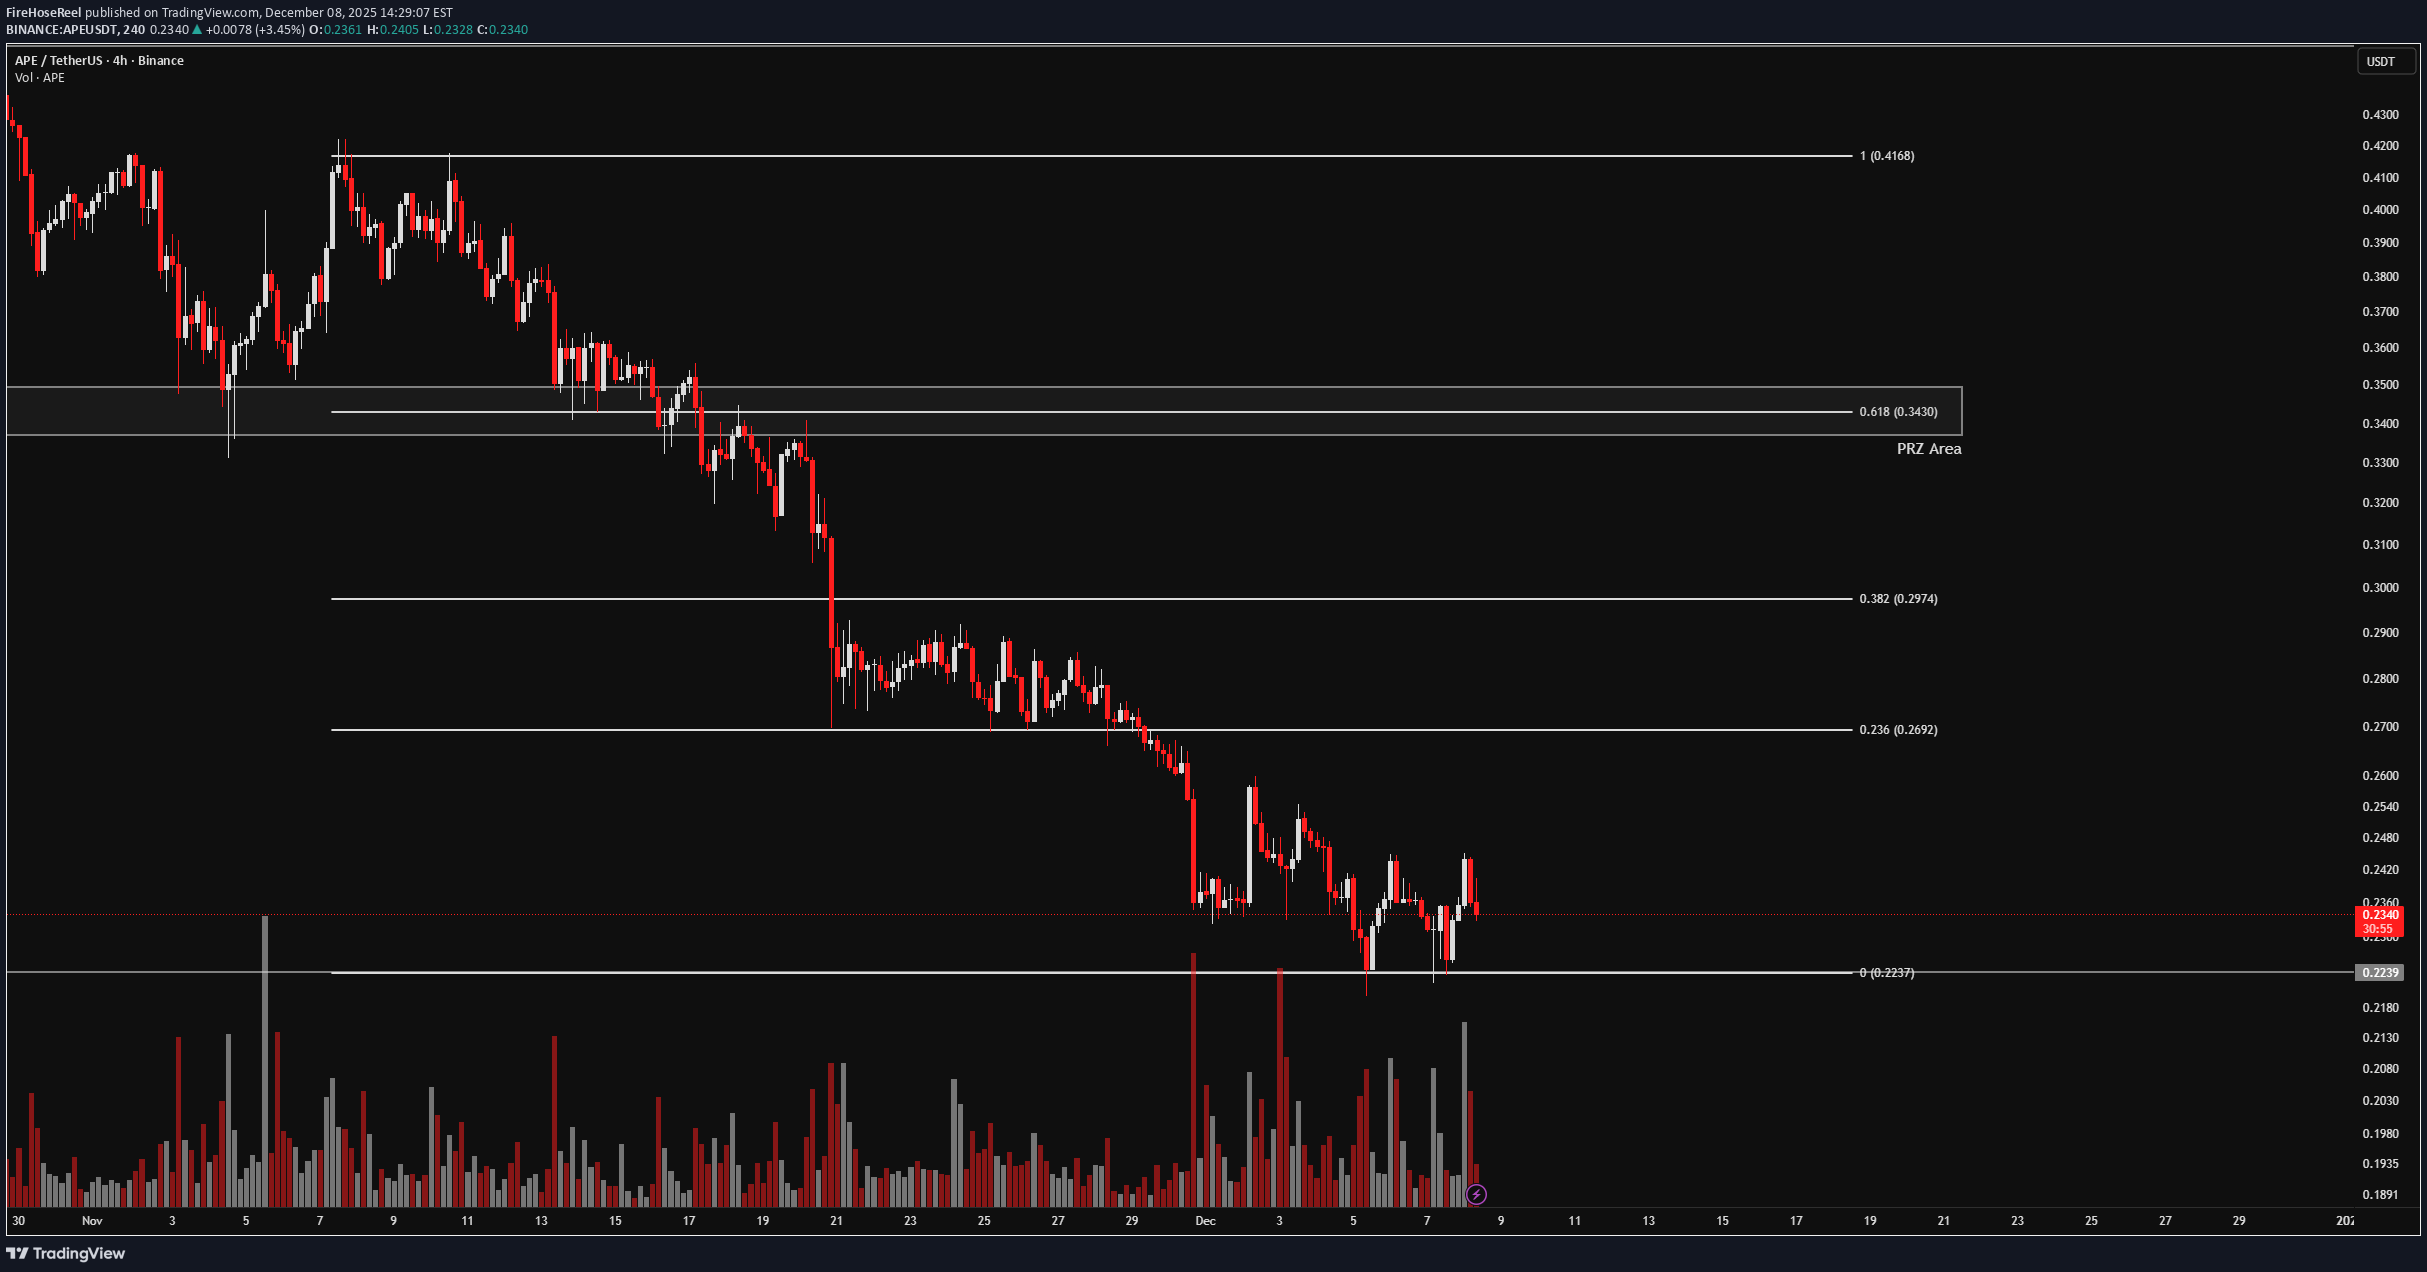
🔥 Welcome To FireHoseReel ! Let’s dive into APE analysis. 👀 APE 4H Overview APE remains bearish across most higher timeframes. We’ve applied a Fibonacci retracement on the last 4H bearish leg, which has highlighted several key levels. A break below the current low signals continuation of the downtrend, while a breakout above the PRZ zone would act as the best bullish trigger. 📊 Volume Analysis APE volume has increased as price reached this zone. This rise in volume suggests that whales may be defending lower prices. If the floor breaks, heavy liquidations and spot selling could follow. ✍️ APE Trading Scenarios 🟢 Long Scenario: A breakout above the PRZ at $0.343, supported by strong buy volume, could activate a long trigger. Prefer entries on the second or third test of the breakout. 🔴 Short Scenario: A breakdown of the current base with strong selling pressure and whale capitulation could push price lower. The main short trigger lies below $0.2237. 🧠 Protect your capital first. No setup is worth blowing your account. If risk isn’t controlled, profit means nothing. Trade with rules, not emotions.

تحلیل فوری APE/USDT: آیا پامپ بزرگ در راه است؟ (سطوح کلیدی خرید و فروش)
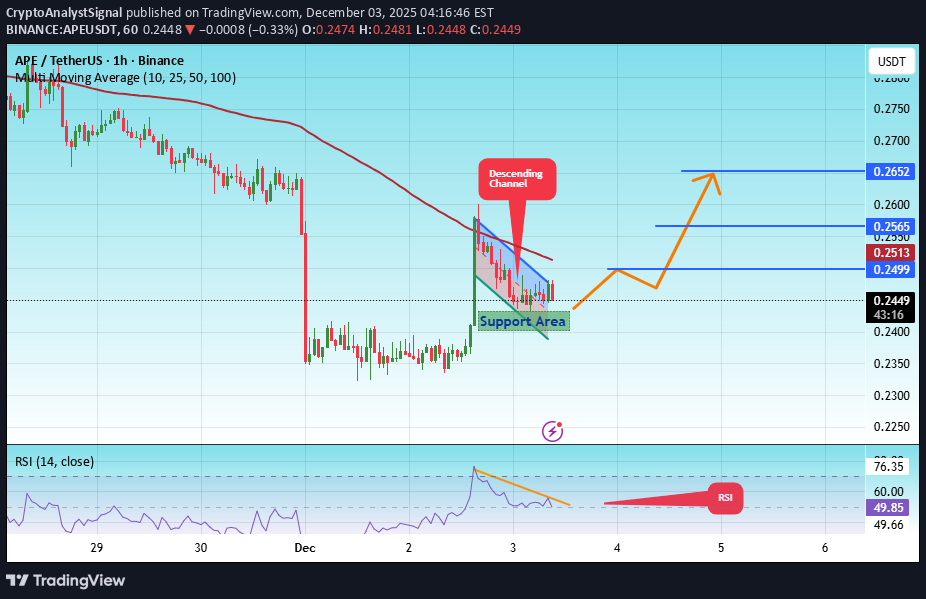
#APE The price is moving in a descending channel on the 1-hour timeframe. It has reached the lower boundary and is heading towards breaking above it, with a retest of the upper boundary expected. We have a downtrend on the RSI indicator, which has reached near the lower boundary, and an upward rebound is expected. There is a key support zone in green at 0.2412. The price has bounced from this zone multiple times and is expected to bounce again. We have a trend towards consolidation above the 100-period moving average, as we are moving close to it, which supports the upward movement. Entry price: 0.2453 First target: 0.2500 Second target: 0.2565 Third target: 0.2652 Don't forget a simple principle: money management. Place your stop-loss order below the green support zone. For any questions, please leave a comment. Thank you.#APE First target: 0.2500 Reached Second target: 0.2565 Reached Third target: 0.2652 Reached
تحلیل فوری APE/USDT: آماده انفجار صعودی در کانال موازی!
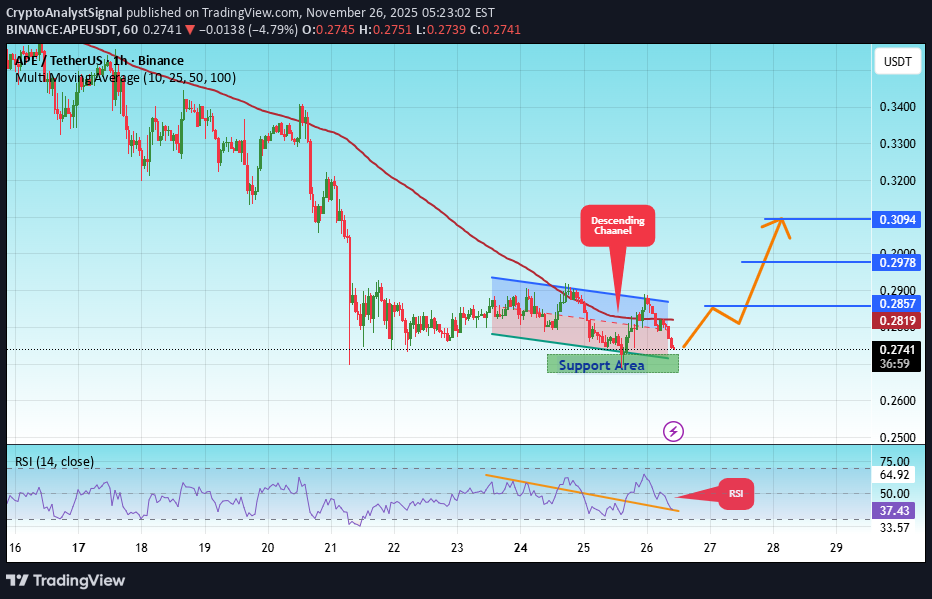
#APE The price is moving within an ascending channel on the 1-hour timeframe and is adhering to it well. It is poised to break out strongly and retest the channel. We have a downtrend line on the RSI indicator that is about to break and retest, which supports the upward move. There is a key support zone in green at 0.2650, representing a strong support point. We have a trend of consolidation above the 100-period moving average. Entry price: 0.2700 First target: 0.2857 Second target: 0.2978 Third target: 0.3094 Don't forget a simple money management rule: Place your stop-loss order below the support zone in green. Once you reach the first target, save some money and then change your stop-loss order to an entry order. For any questions, please leave a comment. Thank you.

آخرین شانس خریداران APEUSDT: آیا سقوط ادامه دارد یا حمایت شکسته میشود؟
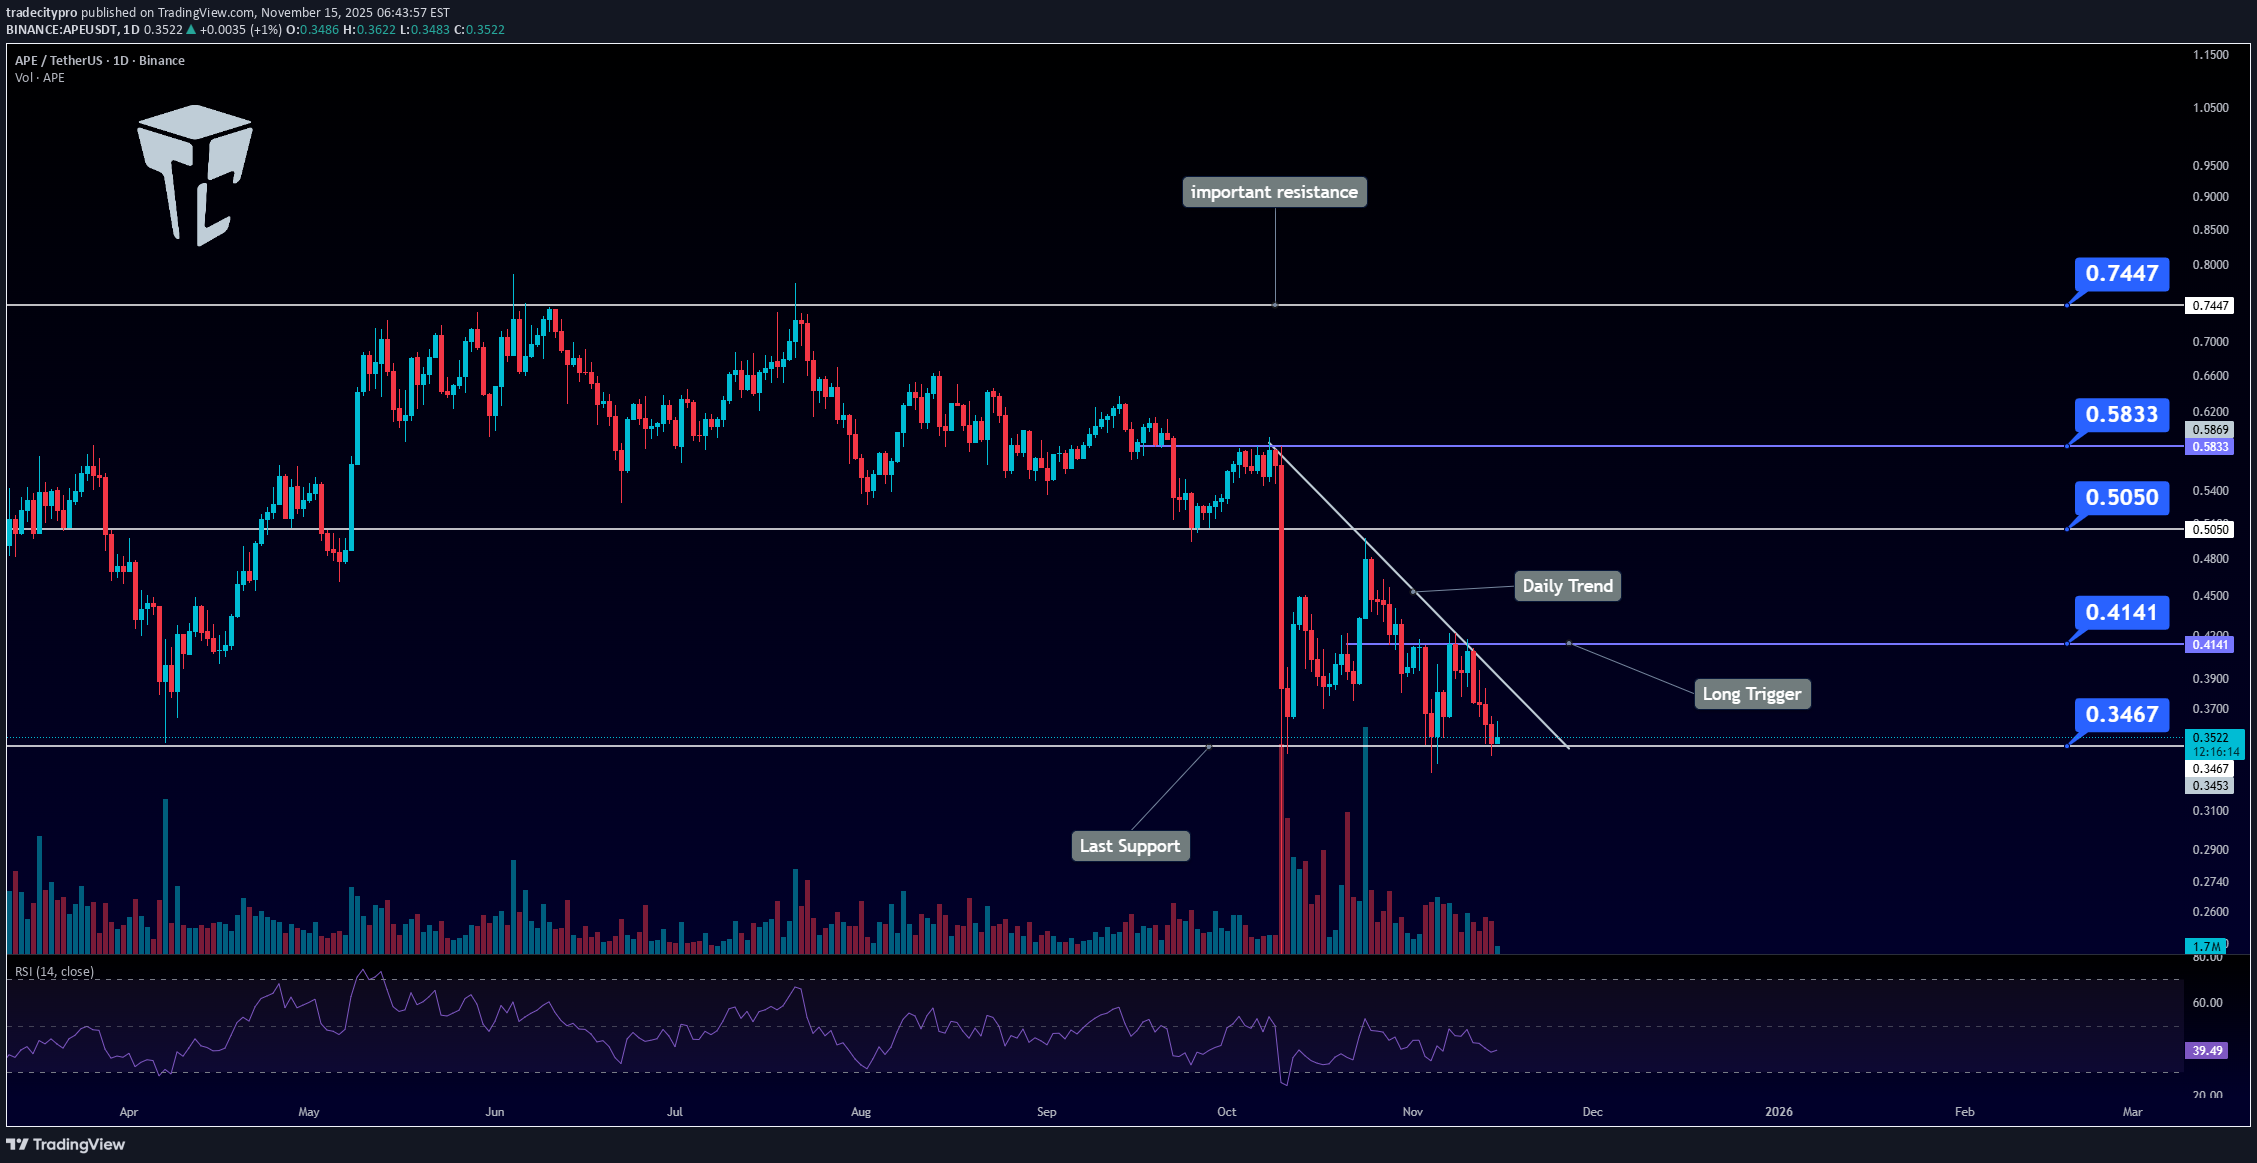
🔥 APEUSDT Analysis — Buyers’ Last Attempt Let’s move on to the analysis of APE, one of the NFT-sector tokens that has recently experienced a deep decline and is currently facing several critical developments. 🌐 Overview of Bitcoin Before starting the analysis, let me remind you once again that we’ve moved the Bitcoin analysis section to a dedicated daily report at your request — allowing us to discuss Bitcoin’s trend, dominance, and overall market sentiment in greater detail each day. 📉 Daily Timeframe Analysis After the recent market drop and the rejection from 0.5833, APE experienced a sharp decline and has now reached its final major support zone. If 0.3467 breaks, we will likely see another sharp sell-off, meaning buyers must make their final effort to defend this support and prevent further collapse. 📈 Long Position Setup For a long entry, we first need to see a proper structure forming on lower timeframes. The main long trigger will be: A breakout of the daily trendline, and A confirmed break above 0.4141 This would signal a potential trend reversal. 🔻 Short Position Setup Our short trigger is completely clear: A confirmed break below 0.3467 But be aware: volatility is expected to be high, so it’s necessary to use a larger stop-loss to avoid getting wicked out during price spikes. 📝 Final Thoughts Stay calm, trade wisely, and let's capture the market's best opportunities! This analysis reflects our opinions and is not financial advice.

جهش باورنکردنی APE: آماده انفجار ۷۵۰ درصدی با پشتوانه قوی!
APE has reacted strongly from its support level and looks ready for a breakout. The setup suggests a potential 750% gain from current levels. With strong funding, solid backing, and momentum building, this project has all the tools needed to push much higher.

تحلیل پلهای APE: کجاست تا موج صعودی بعدی آغاز شود؟
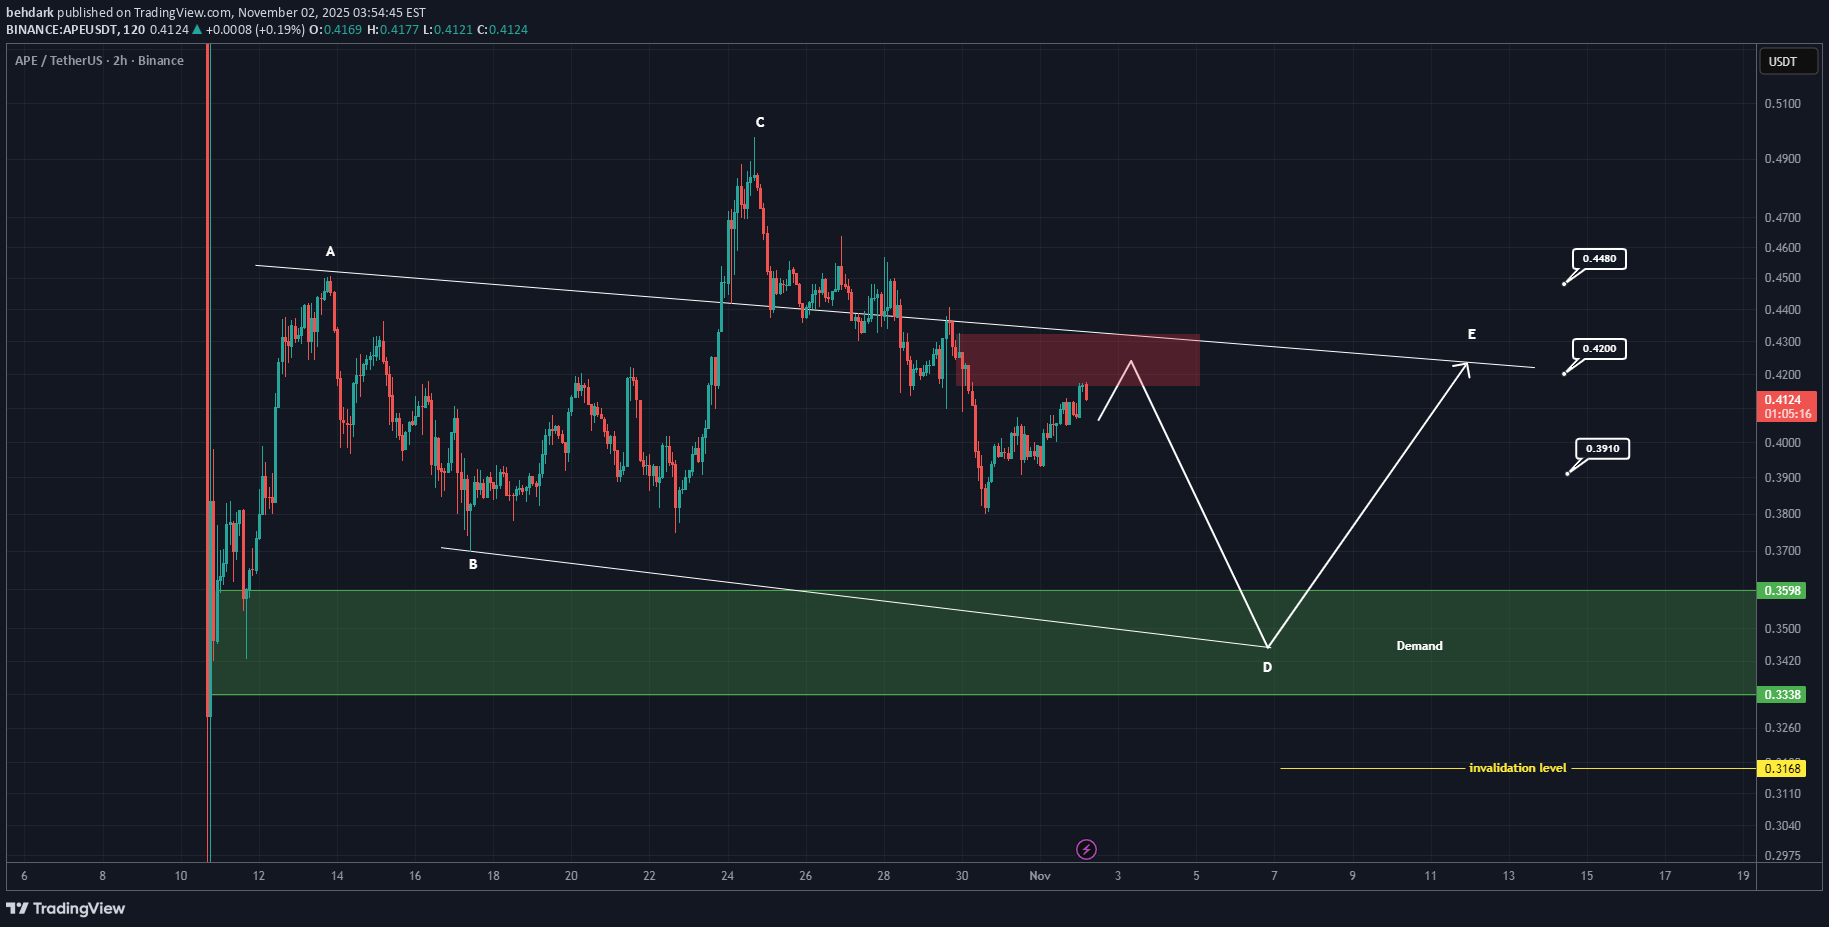
This is one of the coins that hasn’t shown any significant upward movement after the market’s heavy dump. In such cases, it’s better to look for the origin of potential moves. From a wave perspective, it seems to be forming a triangle, which could start from the green zone of wave E. Therefore, we’ll be looking for buy/long positions around the green zone. Targets are marked on the chart. A 4-hour candle closing below the invalidation level will invalidate this analysis. For risk management, please don't forget stop loss and capital management When we reach the first target, save some profit and then change the stop to entry Comment if you have any questions Thank YouAfter hitting the red zone, it dropped more than 16% and reached the green zone, where it has shown a reaction for nowAfter hitting the green zone, it pumped more than 11% and the first target was reached
تحلیل تکنیکال APE/USDT: کانال صعودی و فرصت ورود با اهداف جذاب!
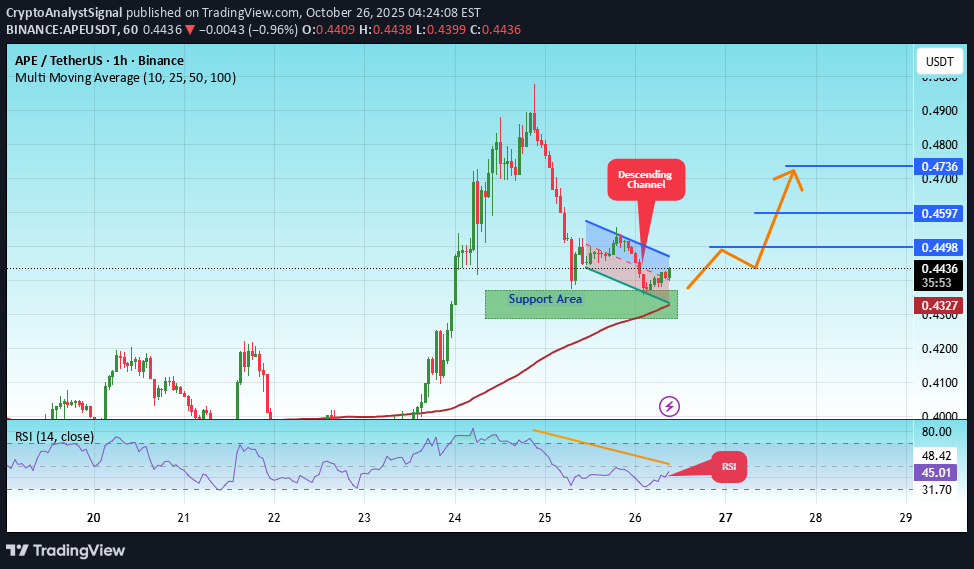
#APE The price is moving in an ascending channel on the 1-hour frame, adhering well to it, and heading for a strong breakout and retest. We have a bearish trend on the RSI indicator that is about to be broken and retested, which supports the upward breakout. There is a major support area in green at 0.4330, which represents a strong support point. We are heading for consolidation above the 100 moving average. Entry price: 0.4336 First target: 0.4500 Second target: 0.4600 Third target: 0.4736 Don't forget a simple matter: capital management. When you reach the first target, save some money and then change your stop-loss order to an entry order. For inquiries, please leave a comment. Thank you.#APE First target: 0.4500 Reached Second target: 0.4600 Reached

آینده APE: مثلث نزولی در نمودار روزانه و اهداف انفجاری پس از شکست!
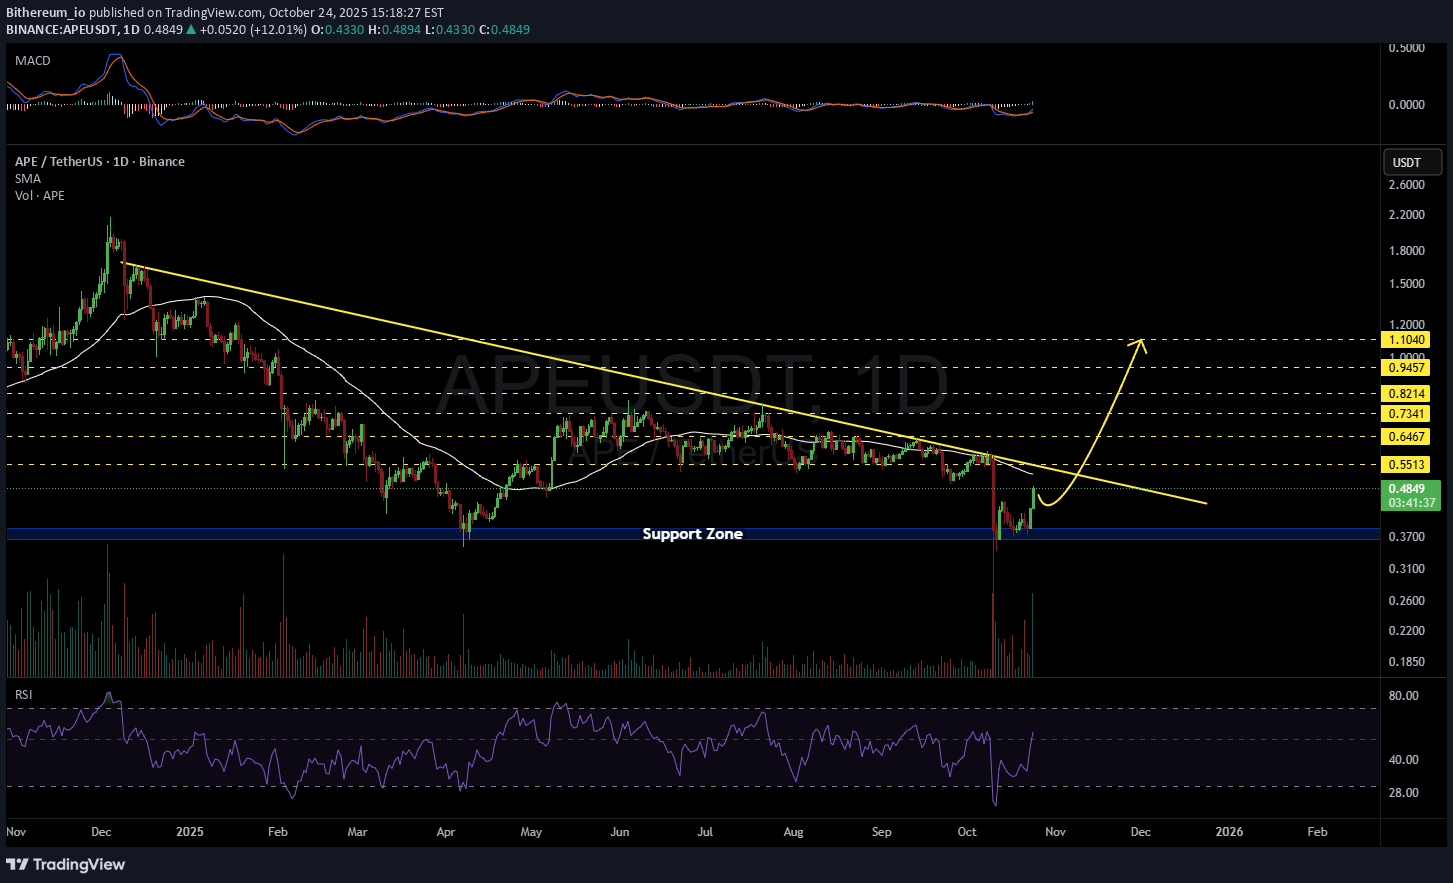
#APE is moving inside a descending triangle on the daily chart. In case of a breakout above the daily SMA50 and the triangle resistance, the potential targets are: 🎯 $0.5513 🎯 $0.6467 🎯 $0.7341 🎯 $0.8214 🎯 $0.9457 🎯 $1.1040 ⚠️ Always remember to use a tight stop-loss and maintain proper risk management.

پامپ عظیم APEUSDT: آیا سود 5 برابری در راه است؟ (تحلیل تکنیکال)
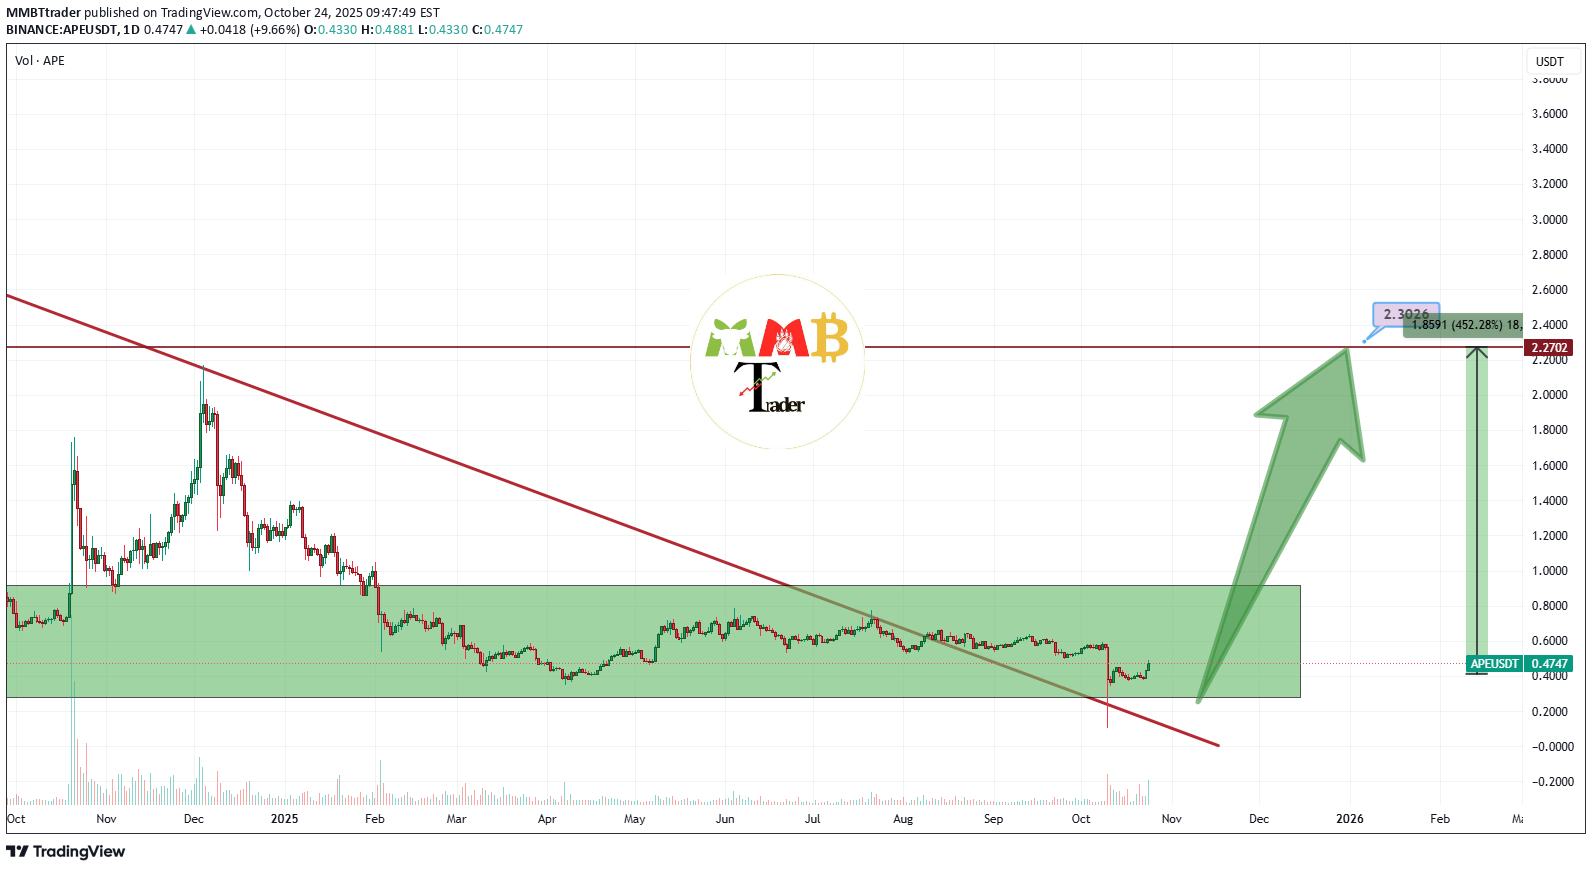
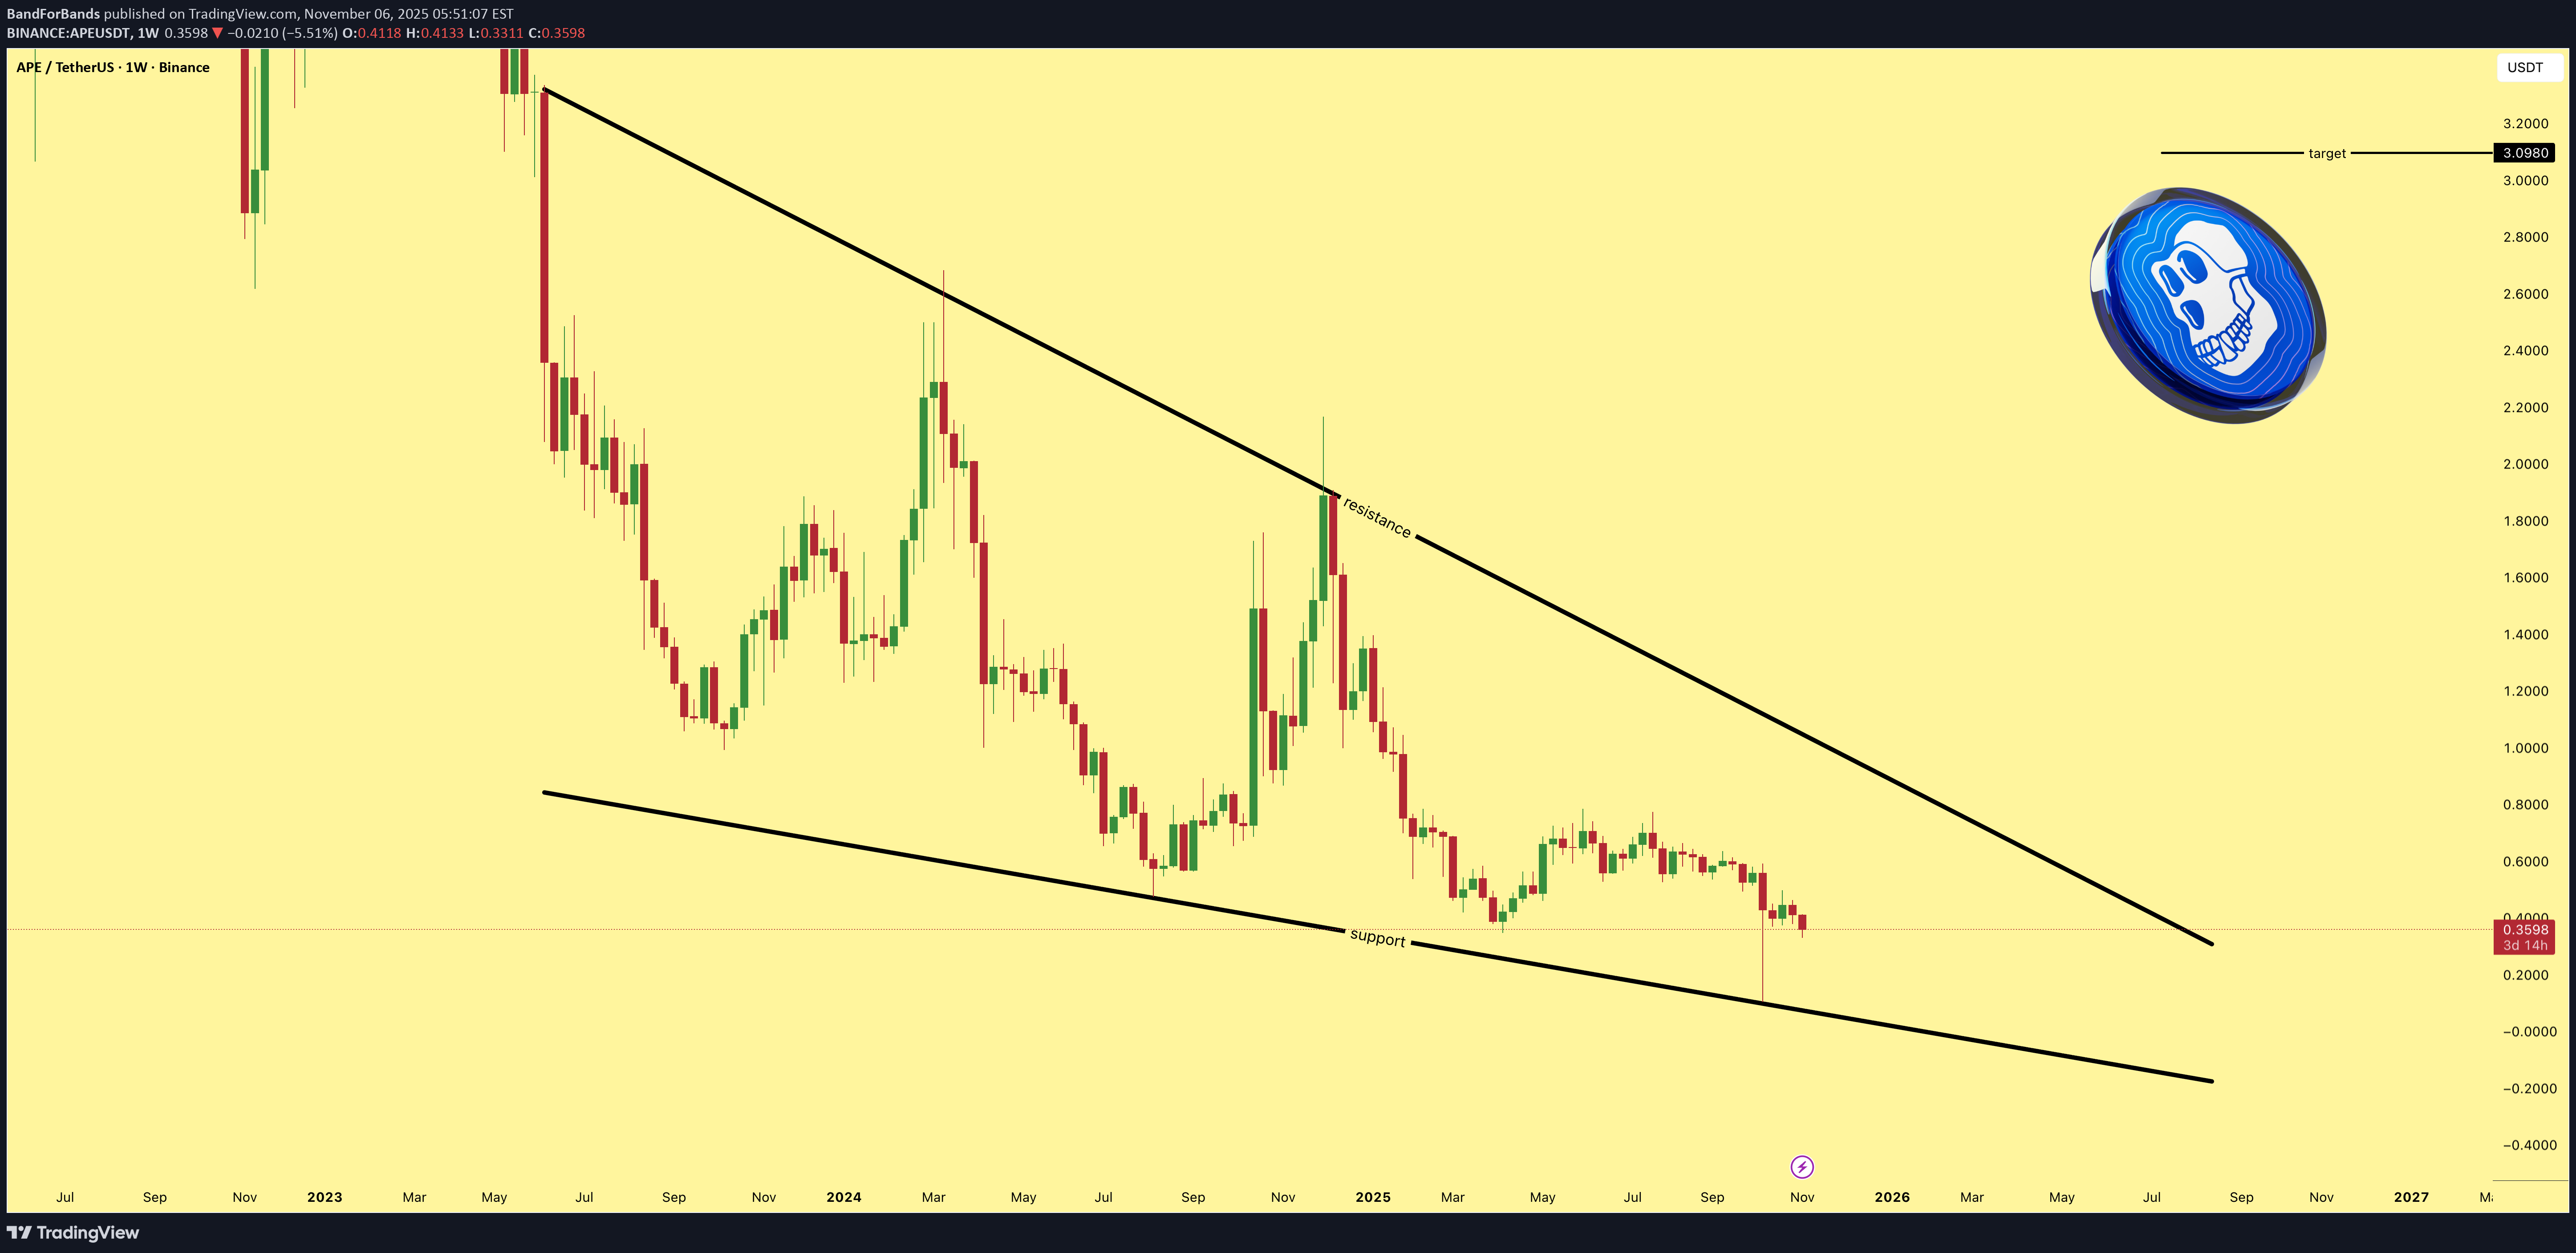
As previously outlined in our analysis, the APEUSDT pair is trading in a zone that historically constitutes a long-term support base. The current price action suggests a potential exhaustion of selling pressure, indicating that the asset may be consolidating for its next significant move. We anticipate a substantial bullish wave, projecting a minimum appreciation of +500% towards the predefined targets illustrated on our technical chart. This upward movement is expected to materialize upon the confirmation of a trend reversal, irrespective of the exact timing.
DISCLAIMER: ((trade based on your own decision))
<
Disclaimer
Any content and materials included in Sahmeto's website and official communication channels are a compilation of personal opinions and analyses and are not binding. They do not constitute any recommendation for buying, selling, entering or exiting the stock market and cryptocurrency market. Also, all news and analyses included in the website and channels are merely republished information from official and unofficial domestic and foreign sources, and it is obvious that users of the said content are responsible for following up and ensuring the authenticity and accuracy of the materials. Therefore, while disclaiming responsibility, it is declared that the responsibility for any decision-making, action, and potential profit and loss in the capital market and cryptocurrency market lies with the trader.