
ALPHA
Alpha Finance Lab
| تریدر | نوع سیگنال | حد سود/ضرر | زمان انتشار | مشاهده پیام |
|---|---|---|---|---|
No results found. | ||||
Price Chart of Alpha Finance Lab
سود 3 Months :
سیگنالهای Alpha Finance Lab
Filter
Sort messages by
Trader Type
Time Frame

CryptoAnalystSignal
پیشبینی انفجاری قیمت آلفا (ALPHA/USDT): ورود به موقع برای سود بزرگ!

#ALPHA The price is moving in a descending channel on the 1-hour frame and is expected to break and continue upward. We have a trend to stabilize above the 100 moving average once again. We have a downtrend on the RSI indicator that supports the upward move with a breakout. We have a major support area in green that pushed the price higher at 0.01450. Entry price: 0.01521. First target: 0.01600. Second target: 0.01668. Third target: 0.01748. To manage risk, don't forget stop loss and capital management. When you reach the first target, save some profits and then change the stop order to an entry order. For inquiries, please comment. Thank you.
CryptoAnalystSignal
#ALPHA/USDT — The Final Battle at the Descending Trendline!
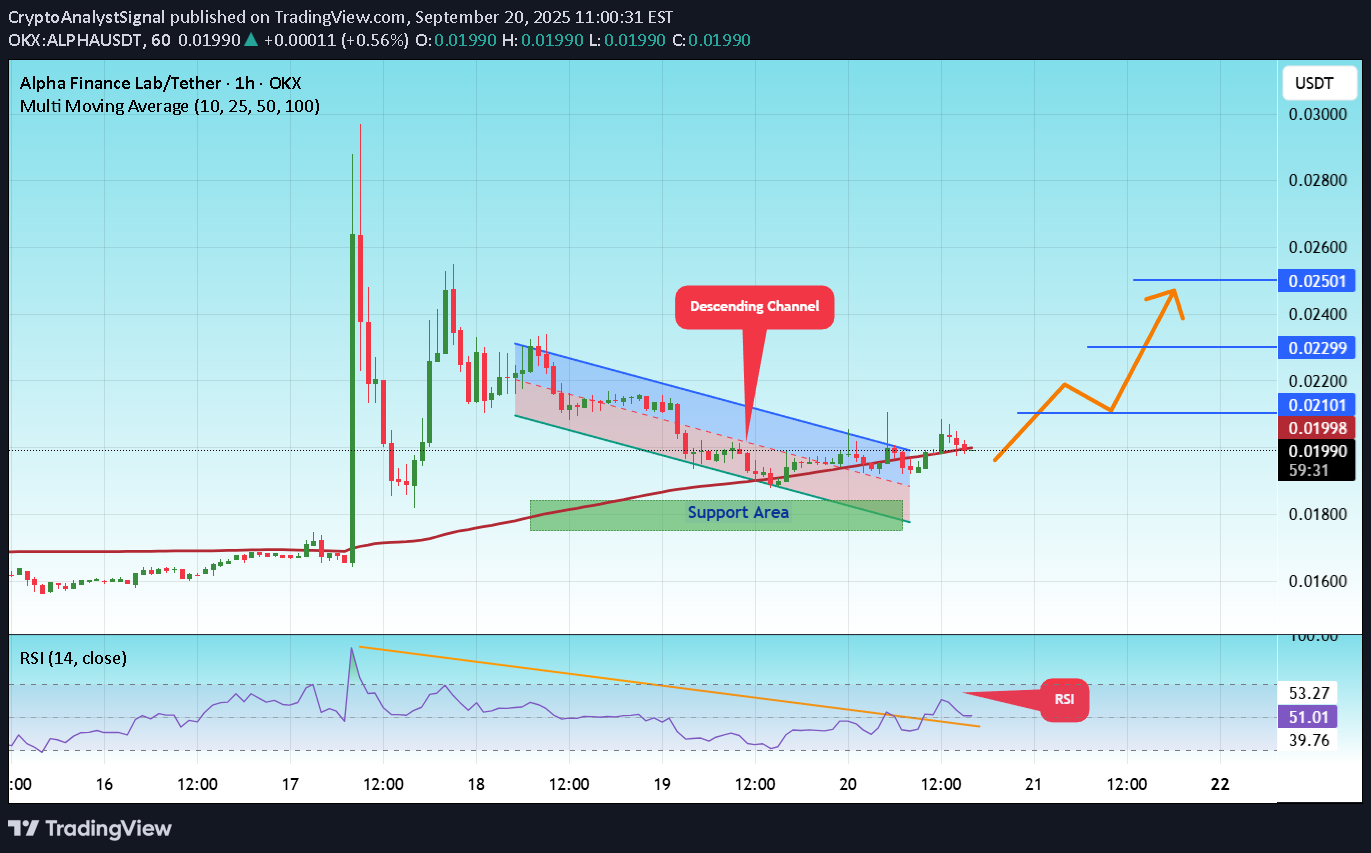
#ALPHA The price is moving in a descending channel on the 1-hour frame and is expected to break and continue upward. We have a trend to stabilize above the 100 moving average again. We have a downtrend on the RSI indicator that supports the upward move with a breakout. We have a major support area in green that pushed the price higher at 0.01750. Entry price: 0.01990. First target: 0.02100. Second target: 0.02300. Third target: 0.02501. To manage risk, don't forget stop loss and capital management. When you reach the first target, save some profits and then change the stop order to an entry order. For inquiries, please comment. Thank you.#ALPHA First target: 0.02100 Reached Second target: 0.02300 Reached Third target: 0.02501 Reached

CryptoNuclear
ALPHA/USDT — The Final Battle at the Descending Trendline!
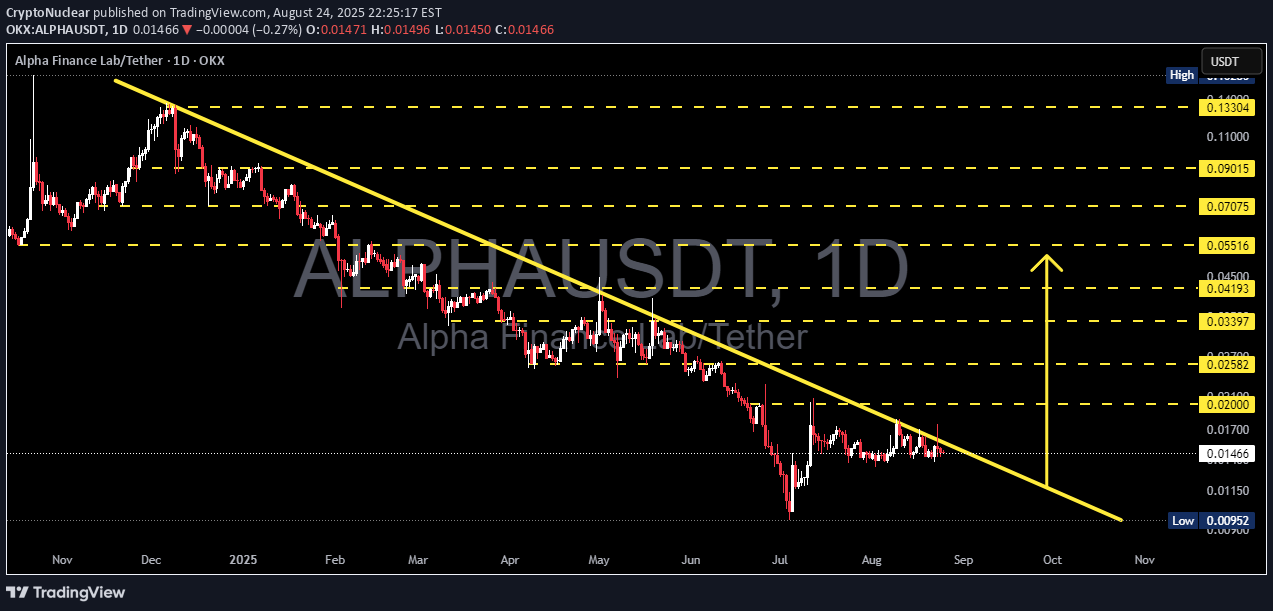
Full Daily Analysis Since early 2025, ALPHA/USDT has been locked in a strong downtrend, forming a series of lower highs and lower lows along a descending trendline (yellow line). Selling pressure remains dominant, yet price action is now consolidating right below the trendline, with a tightening range that signals an explosive move ahead. The market is preparing for a major decision — breakout or rejection. --- 🔎 Structure & Price Pattern Primary Trend: Long-term downtrend (dominant since Q1 2025). Current Pattern: Compression zone under descending resistance — a setup often leading to a strong breakout or breakdown. Nearest Support: 0.00952 (key low). First Resistance: 0.02000 (psychological + structural level). Key Levels Above: 0.02582 → 0.03397 → 0.04193 → 0.05516 → 0.07075 → 0.09015. --- 🚀 Bullish Scenario If price successfully breaks out and closes a daily candle above the trendline (~0.016–0.017): 1. First confirmation: strong bullish daily close + rising volume. 2. Initial Target: 0.02000. 3. Next targets: 0.02582 → 0.03397 → 0.04193. 4. Mid-term potential: 0.05516 up to 0.07075 (+380% from current price). 5. Indicator signals: RSI >50, daily MACD bullish crossover. 📌 Note: A breakout retest of the trendline as support often provides a safer swing entry. --- 🔻 Bearish Scenario If price fails at the trendline and faces strong rejection: 1. Downside path: revisit minor support 0.012–0.011. 2. Main target: 0.00952 (key chart low). 3. If 0.00952 breaks, further downside to new lows (check weekly chart for deeper historical levels). 4. Bearish confirmation: strong rejection candles + rising selling volume + RSI below 50. --- 🎯 Key Takeaways & Trading Strategy ALPHA/USDT is approaching a decisive moment. Breakout above the trendline → potential trend reversal toward 0.02–0.02582. Rejection from the trendline → continuation of the bearish cycle toward 0.00952. Aggressive traders: may scale in right after breakout confirmation with tight stops. Conservative traders: wait for daily close + retest before positioning. Risk management: never risk more than 1–3% per trade. Fakeouts are common in crypto — patience and discipline are key. --- “ALPHA/USDT has been trapped under a heavy downtrend for months. Now price is consolidating just below the descending trendline — the decisive move is coming soon. Will ALPHA break out into a new bullish phase, or will bears push it back to the 0.0095 low? Wait for daily close confirmation before making moves. Remember: in every opportunity lies risk, and proper risk management is your best weapon.” #ALPHA #ALPHAUSDT #Crypto #Altcoin #TechnicalAnalysis #Breakout #Bullish #Bearish #CryptoTrading #SwingTrade #RiskManagement

smarthashmi21
Alpha USDT Analysis
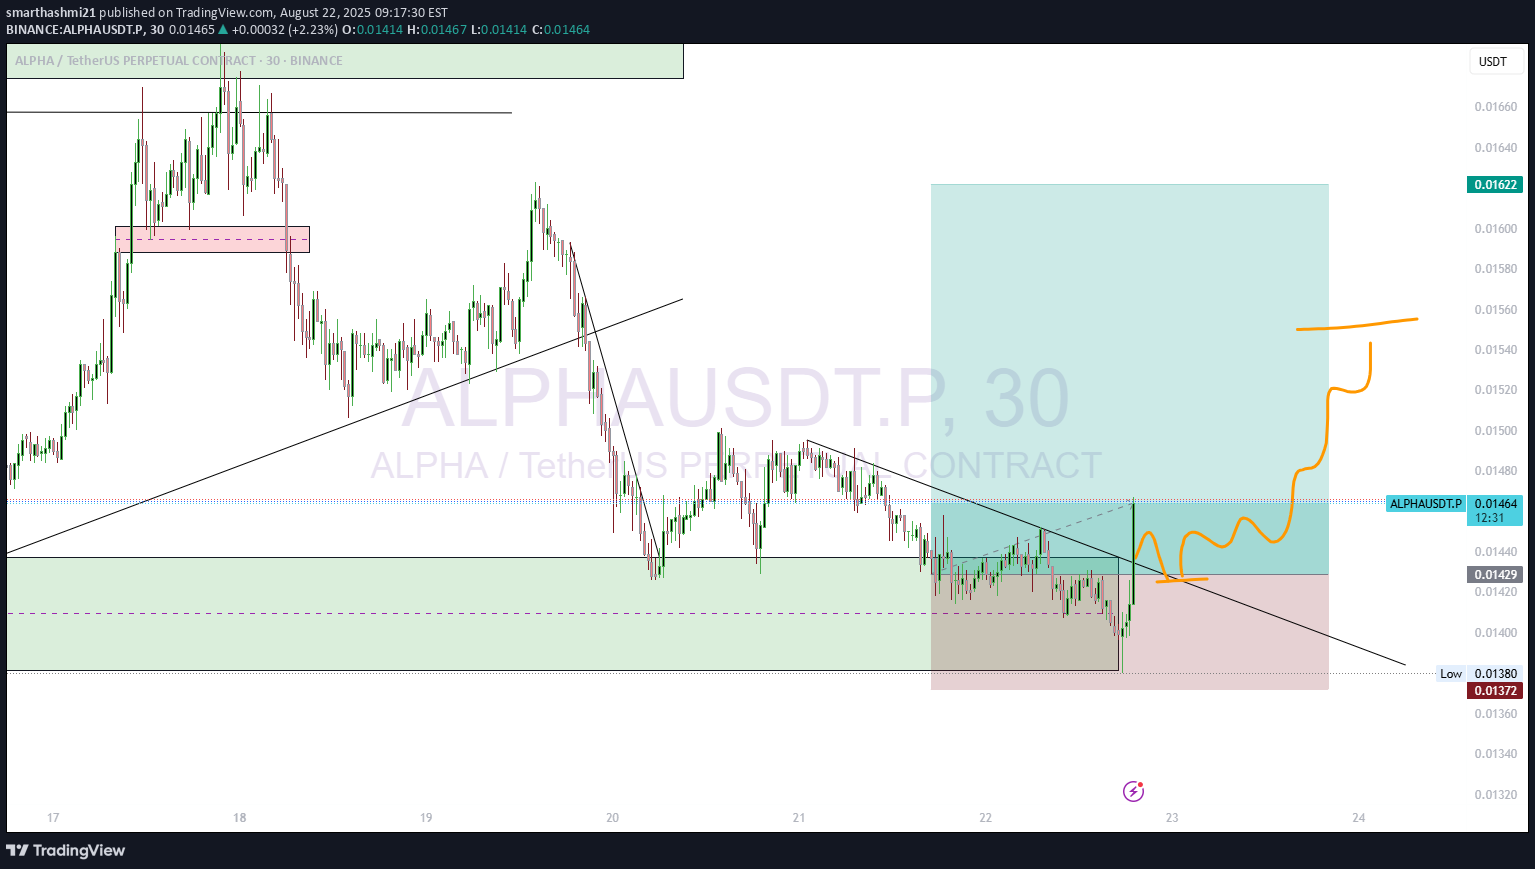
After the recent BTCUSD Bitcoin (BTC) short dump, some altcoins are starting to show strength and are breaking out. We might see a small correction before the altcoin season officially begins. Chart Analysis for ALPHAUSDT.P ALPHA/USDT: Breakout: The chart shows a potential breakout above a downward-sloping trendline. Correction: The orange line illustrates a potential path, suggesting a small correction or retest of the breakout level before a significant upward move. Target Price: The potential target for this move is around the $0.01622 level. Stop-Loss: A stop-loss is placed at $0.01372 to manage risk.

Risk_Adj_Return
ALPHA | Long | Post-Liquidation Bounce | (July 2025)
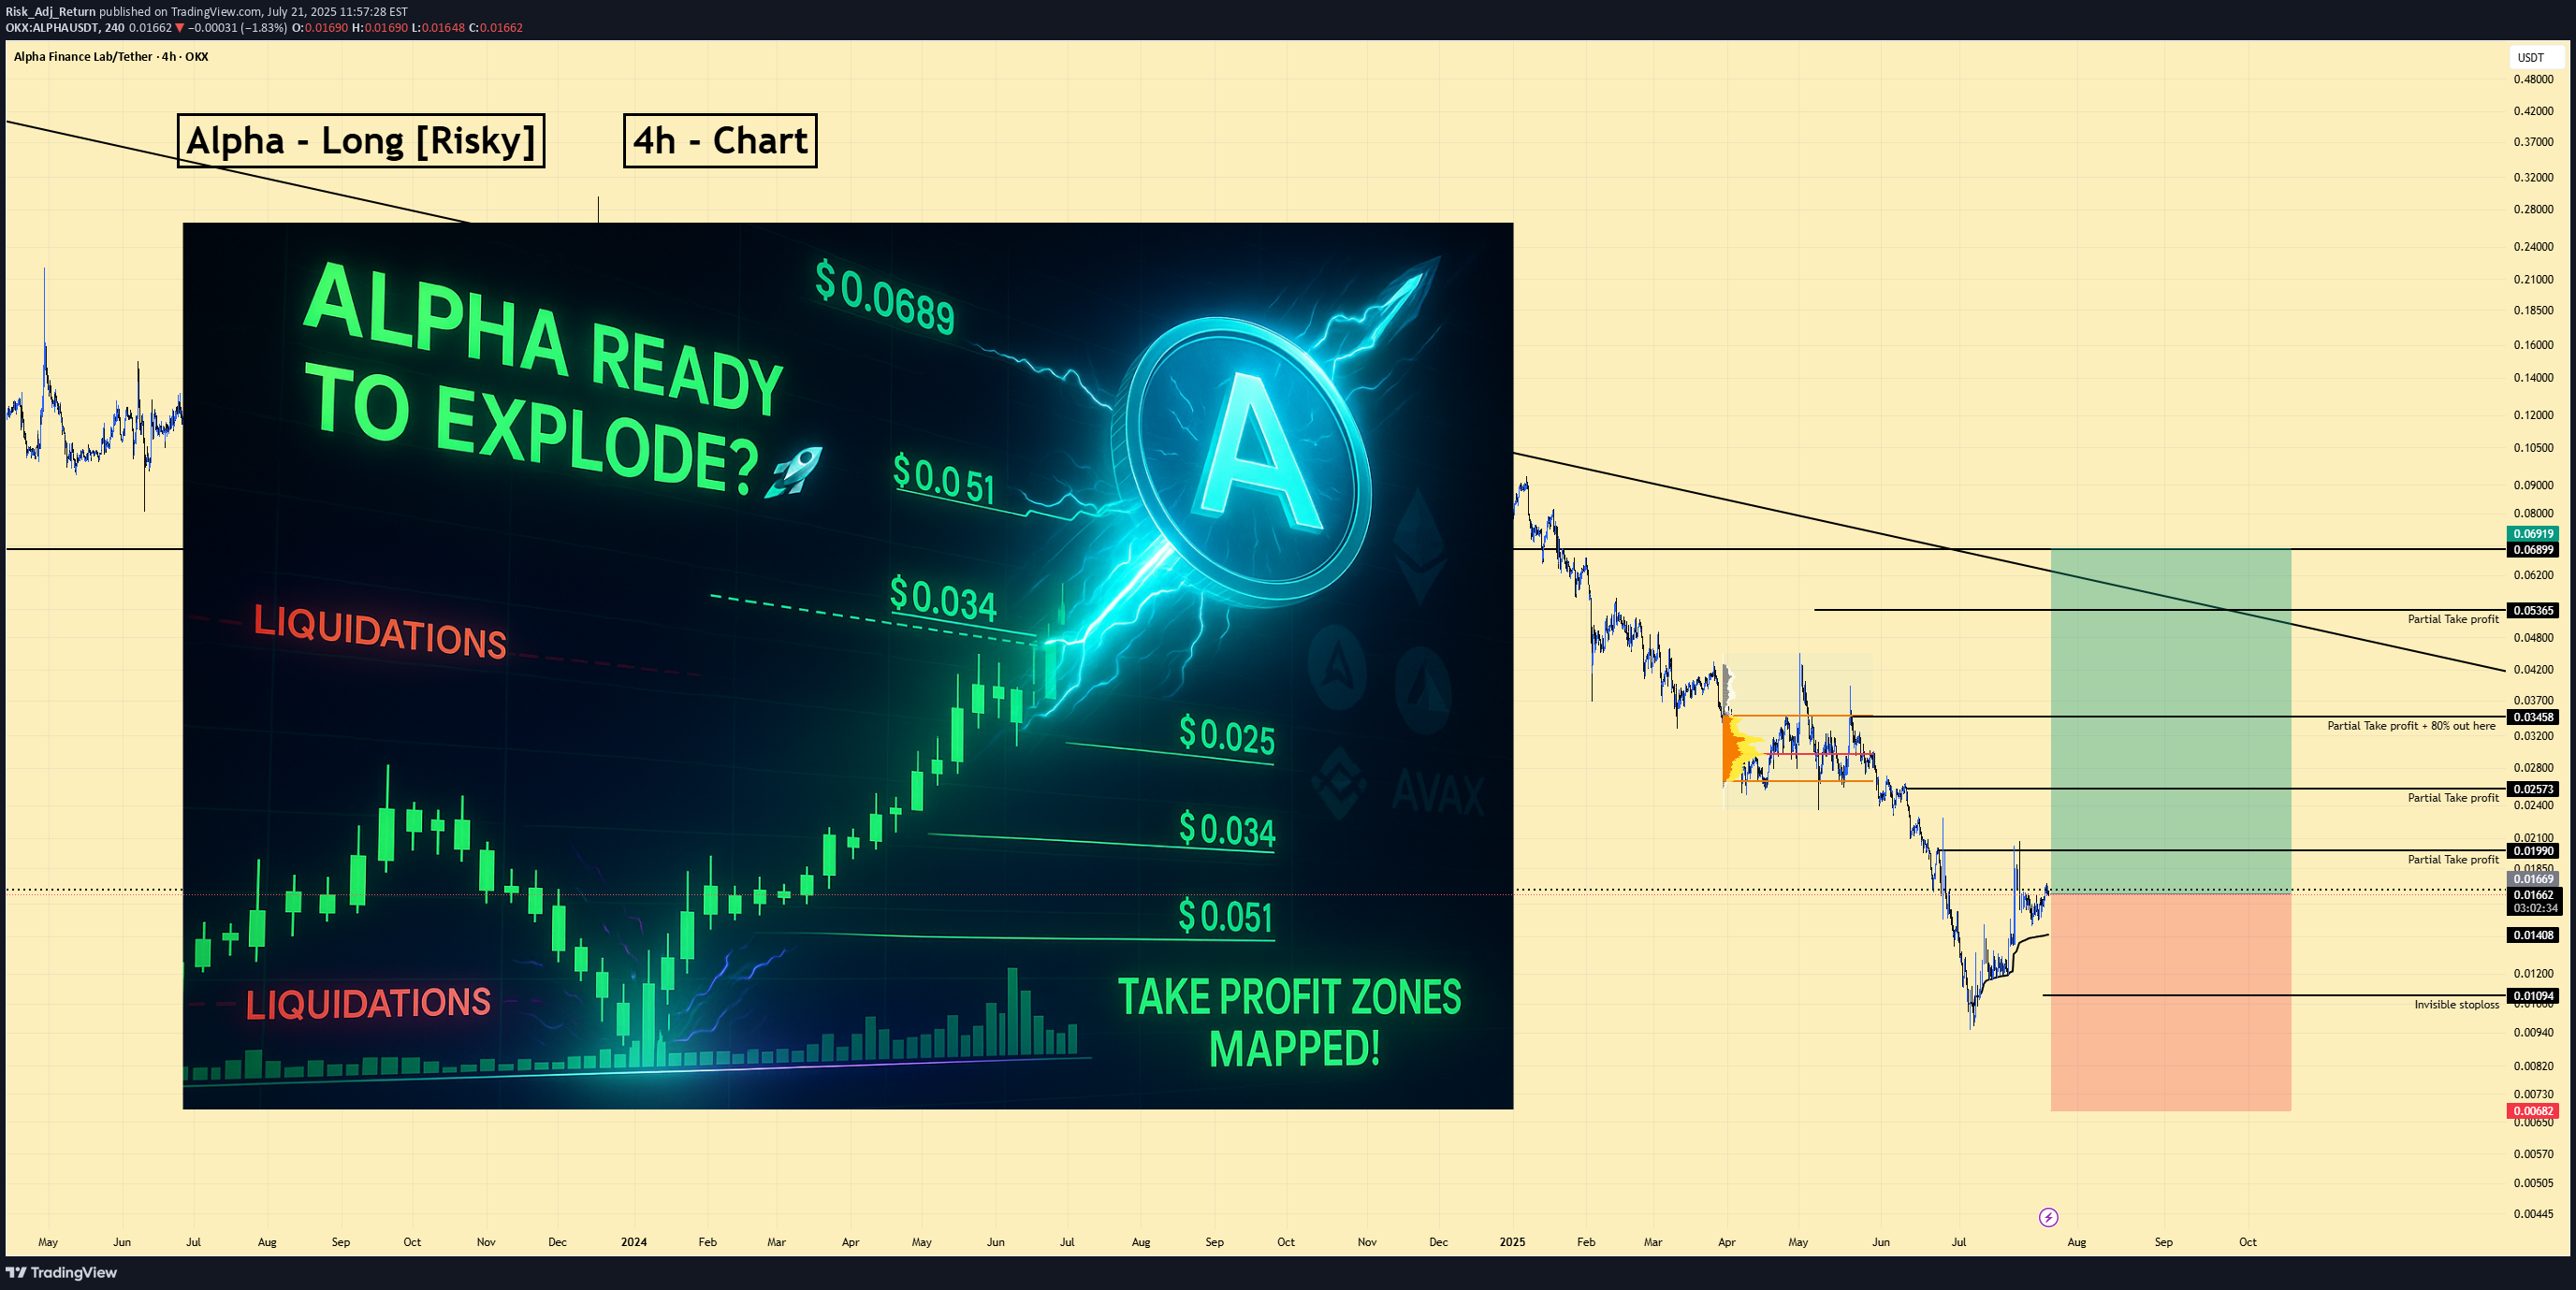
ALPHA | Long | Post-Liquidation Bounce with Volume Surge | (July 2025) 1️⃣ Short Insight Summary ALPHA recently experienced heavy liquidations, but we’re now seeing strong support forming on the daily chart with notable volume returning. This setup hints at a potential recovery and bounce from the recent lows. 2️⃣ Trade Parameters Bias: Long Entry: Accumulation zone between $0.016–$0.020 (recent bottom after liquidation sweep) Stop Loss: $0.00682 (invalidation below deep liquidity zone) TP1: $0.025 TP2: $0.034 TP3: $0.051–$0.053 (major profit zone for large exits) TP Max: $0.0689 (macro recovery target) Partial Exits: Around $0.027–$0.034, where prior volume and structure align. 3️⃣ Key Notes ✅ ALPHA is showing strength post-liquidation with fresh daily volume support. ✅ Several DeFi narratives like AlphaX rollout and DAO incubations may drive renewed interest. ❌ Risks include broader crypto weakness and cross-chain liquidity instability. ❌ Stop loss sits below last liquidation zone—important to protect capital if trend fails. 4️⃣ Optional Follow-up Note I’ll revisit this setup if ALPHA breaks above the $0.034 resistance cleanly or if AlphaX launches with traction. Please LIKE 👍, FOLLOW ✅, SHARE 🙌 and COMMENT ✍ if you enjoy this idea! Also share your ideas and charts in the comments section below! This is best way to keep it relevant, support us, keep the content here free and allow the idea to reach as many people as possible. Disclaimer: This is not a financial advise. Always conduct your own research. This content may include enhancements made using AI.

Ren_MomentumTrader
ALPHA/USDT

Key Level Zone: 0.01150 - 0.01200LMT v2.0 detected.The setup looks promising—price previously trended upward with rising volume and momentum, then retested this zone cleanly. This presents an excellent reward-to-risk opportunity if momentum continues to align.Introducing LMT (Levels & Momentum Trading)- Over the past 3 years, I’ve refined my approach to focus more sharply on the single most important element in any trade: the KEY LEVEL.- While HMT (High Momentum Trading) served me well—combining trend, momentum, volume, and structure across multiple timeframes—I realized that consistently identifying and respecting these critical price zones is what truly separates good trades from great ones.- That insight led to the evolution of HMT into LMT – Levels & Momentum Trading.Why the Change? (From HMT to LMT)Switching from High Momentum Trading (HMT) to Levels & Momentum Trading (LMT) improves precision, risk control, and confidence by:- Clearer Entries & Stops: Defined key levels make it easier to plan entries, stop-losses, and position sizing—no more guesswork.- Better Signal Quality: Momentum is now always checked against a support or resistance zone—if it aligns, it's a stronger setup.- Improved Reward-to-Risk: All trades are anchored to key levels, making it easier to calculate and manage risk effectively.- Stronger Confidence: With clear invalidation points beyond key levels, it's easier to trust the plan and stay disciplined—even in tough markets.Whenever I share a signal, it’s because:- A high‐probability key level has been identified on a higher timeframe.- Lower‐timeframe momentum, market structure and volume suggest continuation or reversal is imminent.- The reward‐to‐risk (based on that key level) meets my criteria for a disciplined entry.***Please note that conducting a comprehensive analysis on a single timeframe chart can be quite challenging and sometimes confusing. I appreciate your understanding of the effort involved.Important Note: The Role of Key Levels- Holding a key level zone: If price respects the key level zone, momentum often carries the trend in the expected direction. That’s when we look to enter, with stop-loss placed just beyond the zone with some buffer.- Breaking a key level zone: A definitive break signals a potential stop‐out for trend traders. For reversal traders, it’s a cue to consider switching direction—price often retests broken zones as new support or resistance.My Trading Rules (Unchanged)Risk Management- Maximum risk per trade: 2.5%- Leverage: 5xExit Strategy / Profit Taking- Sell at least 70% on the 3rd wave up (LTF Wave 5).- Typically sell 50% during a high‐volume spike.- Move stop‐loss to breakeven once the trade achieves a 1.5:1 R:R.- Exit at breakeven if momentum fades or divergence appears.The market is highly dynamic and constantly changing. LMT signals and target profit (TP) levels are based on the current price and movement, but market conditions can shift instantly, so it is crucial to remain adaptable and follow the market's movement.If you find this signal/analysis meaningful, kindly like and share it.Thank you for your support~Sharing this with love!From HMT to LMT: A Brief Version HistoryHM Signal :Date: 17/08/2023- Early concept identifying high momentum pullbacks within strong uptrends- Triggered after a prior wave up with rising volume and momentum- Focused on healthy retracements into support for optimal reward-to-risk setupsHMT v1.0:Date: 18/10/2024- Initial release of the High Momentum Trading framework- Combined multi-timeframe trend, volume, and momentum analysis.- Focused on identifying strong trending moves high momentumHMT v2.0:Date: 17/12/2024- Major update to the Momentum indicator- Reduced false signals from inaccurate momentum detection- New screener with improved accuracy and fewer signalsHMT v3.0:Date: 23/12/2024- Added liquidity factor to enhance trend continuation- Improved potential for momentum-based plays- Increased winning probability by reducing entries during peaksHMT v3.1:Date: 31/12/2024- Enhanced entry confirmation for improved reward-to-risk ratiosHMT v4.0:Date: 05/01/2025- Incorporated buying and selling pressure in lower timeframes to enhance the probability of trending moves while optimizing entry timing and scalingHMT v4.1:Date: 06/01/2025- Enhanced take-profit (TP) target by incorporating market structure analysisHMT v5 :Date: 23/01/2025- Refined wave analysis for trending conditions- Incorporated lower timeframe (LTF) momentum to strengthen trend reliability- Re-aligned and re-balanced entry conditions for improved accuracyHMT v6 :Date : 15/02/2025- Integrated strong accumulation activity into in-depth wave analysisHMT v7 :Date : 20/03/2025- Refined wave analysis along with accumulation and market sentimentHMT v8 :Date : 16/04/2025- Fully restructured strategy logicHMT v8.1 :Date : 18/04/2025- Refined Take Profit (TP) logic to be more conservative for improved win consistencyLMT v1.0 :Date : 06/06/2025- Rebranded to emphasize key levels + momentum as the core frameworkLMT v2.0Date: 11/06/2025

Captain-MAO
ALPHA/USDT- 'V' Recovery
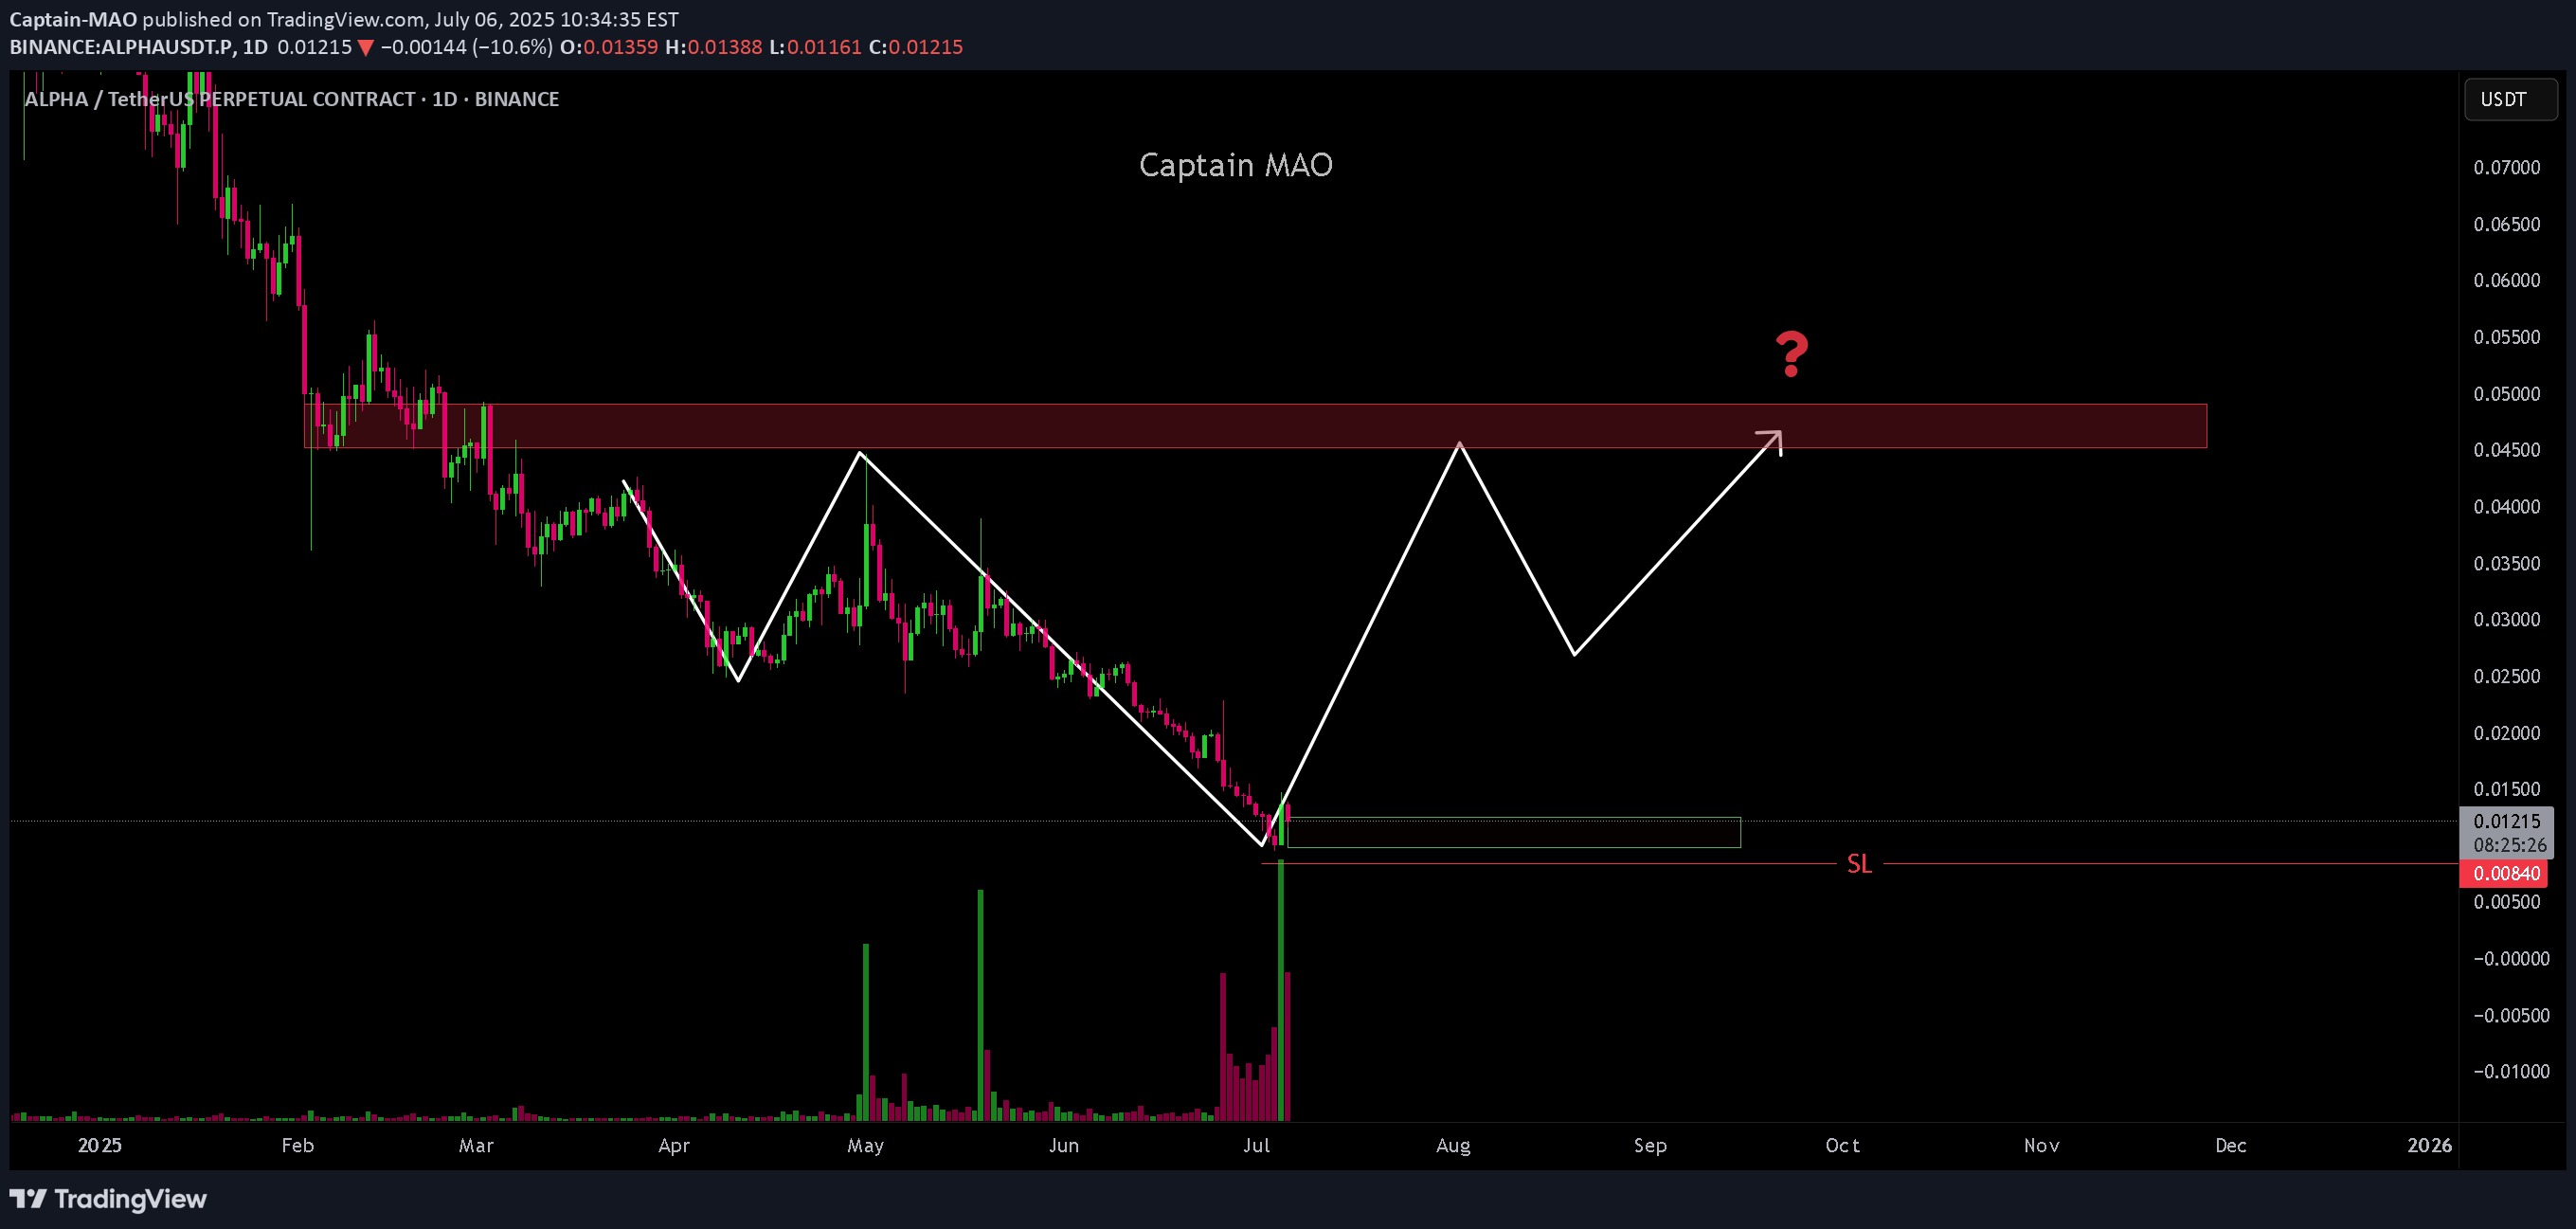
ALPHA is in the process of forming a V-shape recovery, showing strong momentum to reclaim the 0.025 price zone. Yesterday’s daily candle printed a solid bullish reaction, indicating buyer strength stepping inStop Loss: Below 0.0084 (depending on risk appetite)
CryptoAnalystSignal
#ALPHA /USDT breakdown alert

#ALPHAThe price is moving within a descending channel on the 1-hour frame and is expected to break and continue upward.We have a trend to stabilize above the 100 moving average once again.We have a downtrend on the RSI indicator that supports the upward break.We have a support area at the lower limit of the channel at 0.01111, acting as strong support from which the price can rebound.Entry price: 0.01156.First target: 0.01288.Second target: 0.01400.Third target: 0.01512.To manage risk, don't forget stop loss and capital management.When you reach the first target, save some profits and then change the stop order to an entry order.For inquiries, please comment.Thank you.

Leanghorng
potential to buy

On many coins that have hit the previous weeks low 3 times in a row, and In all those coins, 5 of them have made another 3 days of breakout to the low of the week, looking to buy when a there is a session turnover to the upside. The second trade to finish the week. Hopefully tomorrow will be give a trade entry

Qaisrani-Trades
ALPHAUSDT breakdown alert

ALPHAUSDT breakdown alertALPHAUSDT has broken down from a descending triangle pattern, which is typically a bearish continuation setup. The price failed to hold above the lower support trendline, indicating increased selling pressure and a possible continuation of the downtrend.If the breakdown sustains with strong volume, we may see further downside movement. However, if the price quickly reclaims the broken support level, the move could turn out to be a fakeout.Key levels to watch:* Previous support now acting as resistance* Breakdown confirmation zone* Volume strength for validationKeep an eye on ALPHA — confirmation of this breakdown could lead to lower targets ahead.
Disclaimer
Any content and materials included in Sahmeto's website and official communication channels are a compilation of personal opinions and analyses and are not binding. They do not constitute any recommendation for buying, selling, entering or exiting the stock market and cryptocurrency market. Also, all news and analyses included in the website and channels are merely republished information from official and unofficial domestic and foreign sources, and it is obvious that users of the said content are responsible for following up and ensuring the authenticity and accuracy of the materials. Therefore, while disclaiming responsibility, it is declared that the responsibility for any decision-making, action, and potential profit and loss in the capital market and cryptocurrency market lies with the trader.