
smarthashmi21
@t_smarthashmi21

What symbols does the trader recommend buying?
Purchase History
پیام های تریدر
Filter
smarthashmi21
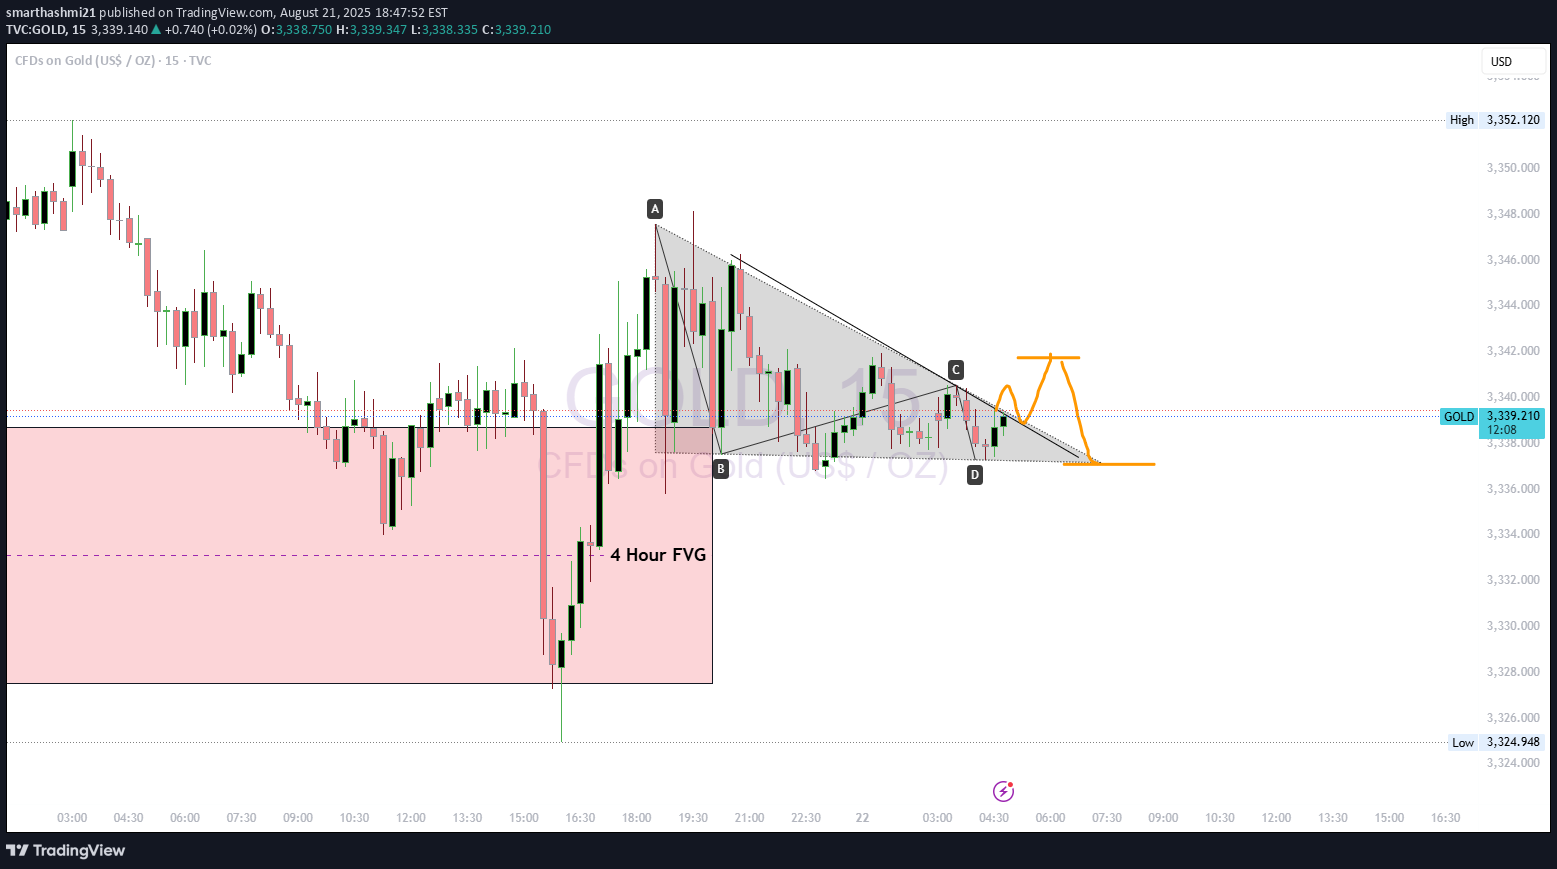
Gold (XAUUSD) – Symmetrical Triangle Breakout & Supply Zone Shor

GOLD recently broke out of a symmetrical triangle on the upside. While this pattern is neutral, the breakout direction gives us momentum clues. 🔑 Key Zones: Central Zone (0.5 Fib retracement of last high) → currently acting as supply. If price rejects here → I expect reversal toward lower levels. If no reaction → next supply zone becomes my reversal area. 📉 My Plan: Entering a short position at Central Zone. Stop Loss: Above the last 4H candle close. Target: Previous imbalance/FVG and below. ⚙️ Methodology Used: Chart Patterns (Symmetrical Triangle breakout) MMC (Mirror Market Concept: market repeats behavior over time) Fibonacci Supply Zones 📌 Conclusion: Watching closely for rejection in the Central Zone. If confirmed, bearish momentum could bring strong downside. If not, I’ll wait for the upper supply zone to trigger reversal.
smarthashmi21
BTC
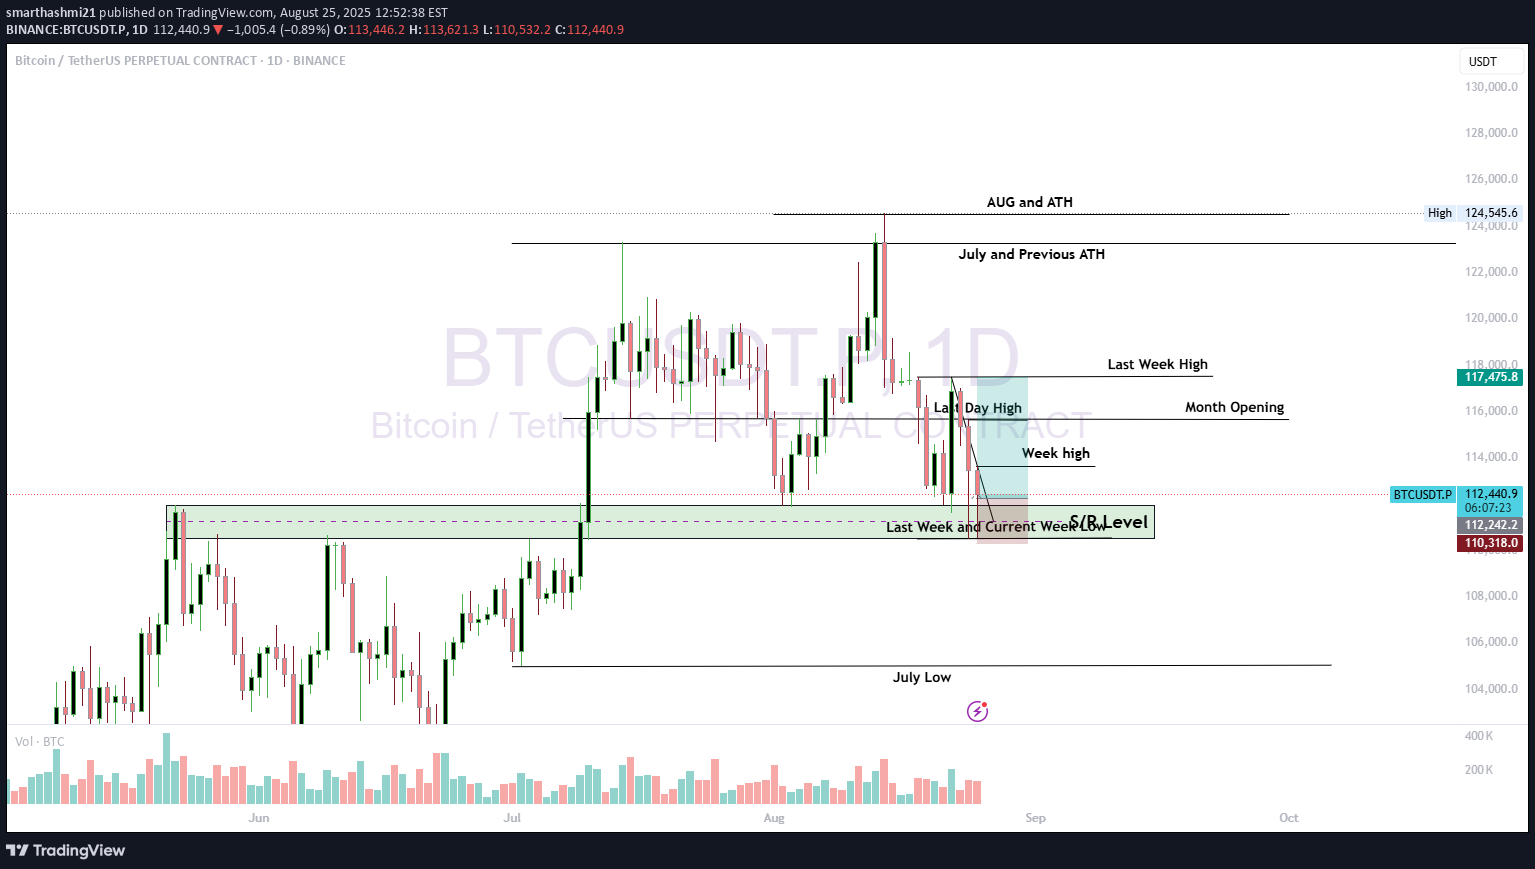
BTC is stuck in a range between 110K – 118K. Until a clean breakout happens, range trading or liquidity sweeps around these levels make sense.
smarthashmi21
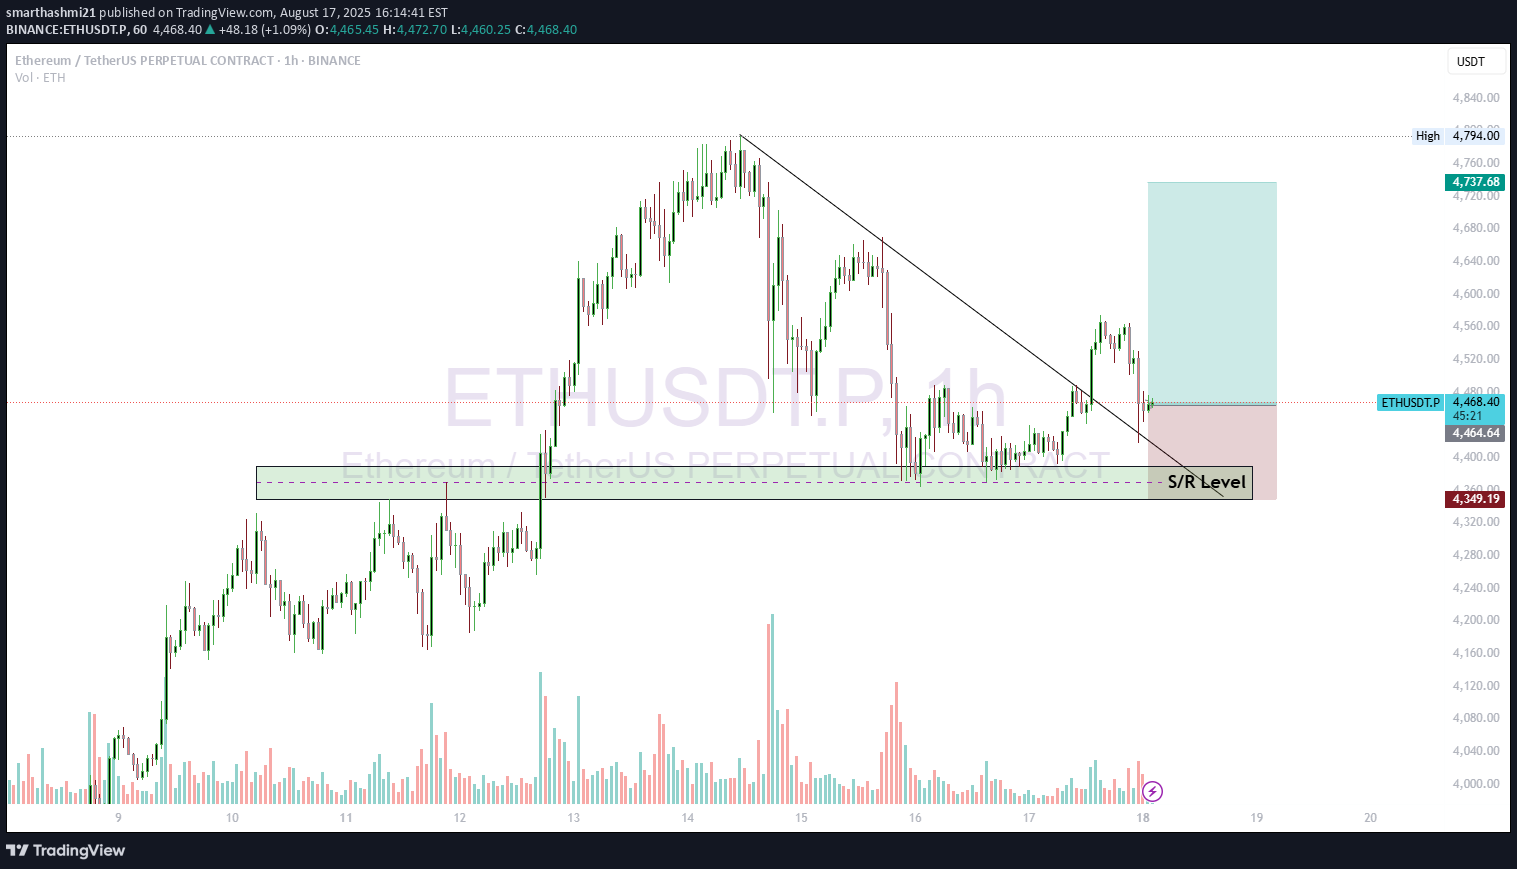
ETH/USDT Chart Analysis
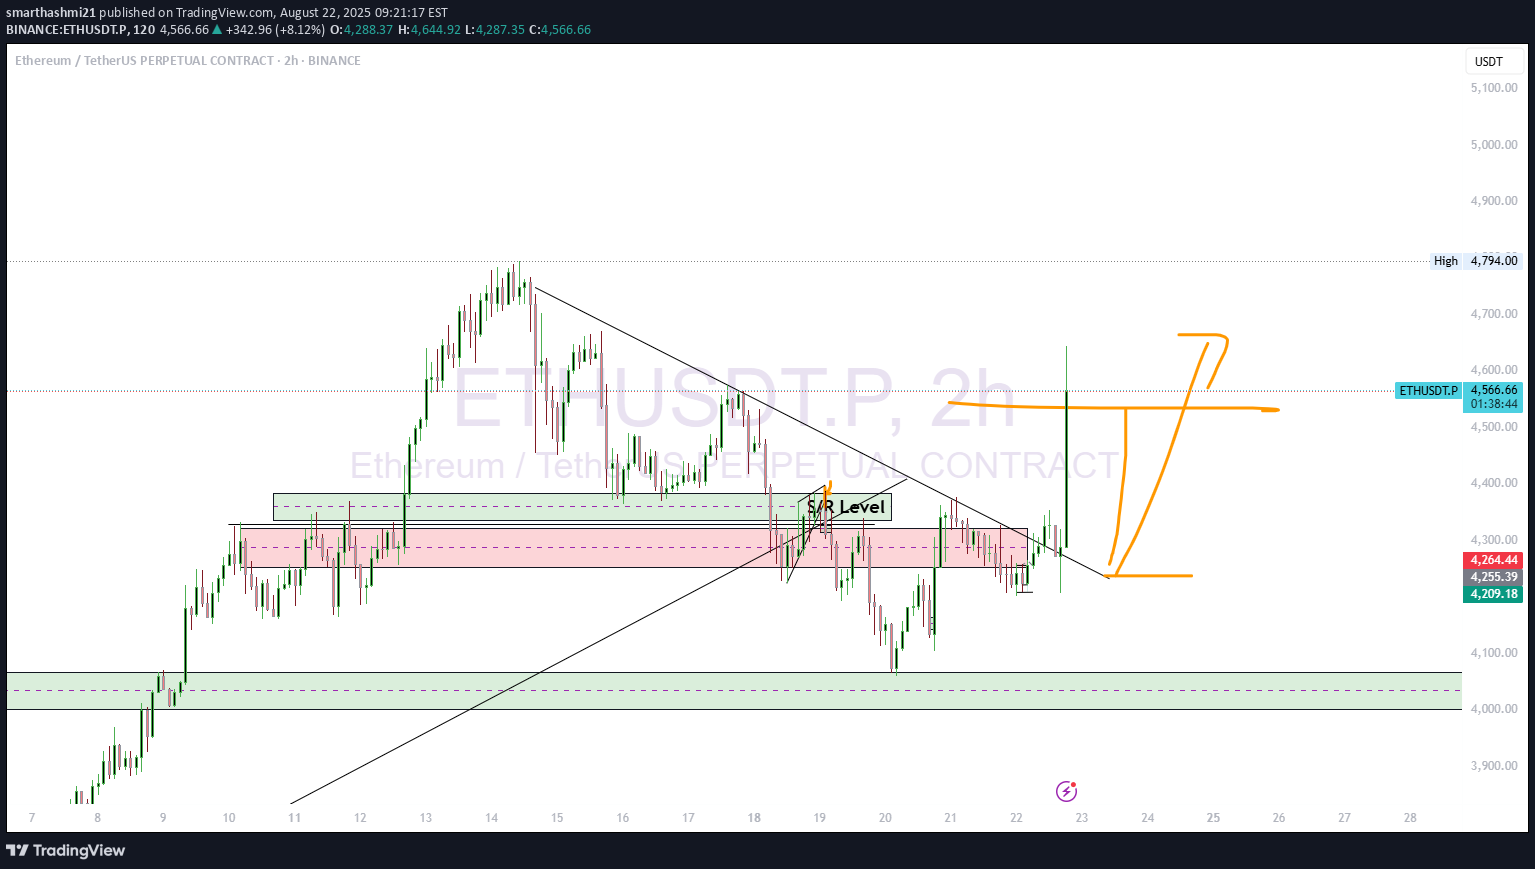
ETHUSD ETH/USDT shows a strong upward move after a period of consolidation and a breakout from a descending trendline. Bullish Momentum: The price has moved significantly higher from the S/R level and is currently trading at the higher end of the recent range. Impulsive Move: The recent candle is a large green candle, indicating strong buying pressure and an impulsive move to the upside. Potential Pullback: As mentioned in the previous analysis, the price may experience a pullback or a retest of the broken trendline. The strong move up could be followed by some profit-taking before a continuation of the trend. This is a common pattern in breakouts. Key Levels: The price action confirms that the S/R level around $4,284 is a critical area. As long as the price stays above this level, the bullish structure remains intact. A break below this level could signal a false breakout and a return to the previous range.
smarthashmi21
Alpha USDT Analysis
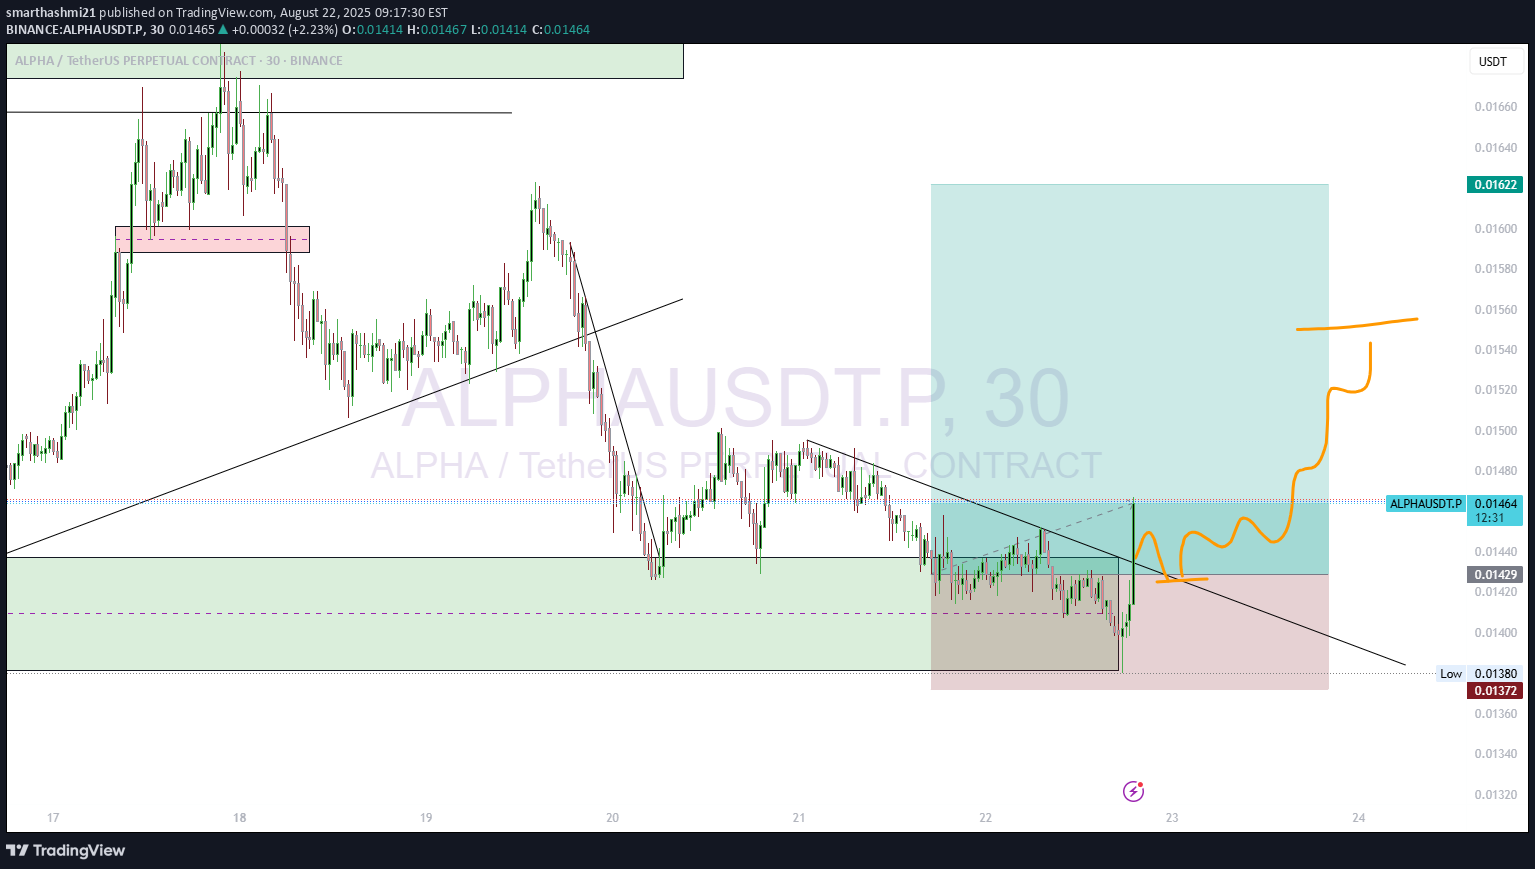
After the recent BTCUSD Bitcoin (BTC) short dump, some altcoins are starting to show strength and are breaking out. We might see a small correction before the altcoin season officially begins. Chart Analysis for ALPHAUSDT.P ALPHA/USDT: Breakout: The chart shows a potential breakout above a downward-sloping trendline. Correction: The orange line illustrates a potential path, suggesting a small correction or retest of the breakout level before a significant upward move. Target Price: The potential target for this move is around the $0.01622 level. Stop-Loss: A stop-loss is placed at $0.01372 to manage risk.
smarthashmi21
XAUUSD Idea
XAU is farming triangle and if it break then we will wait for retest but tomorrow is also something so we should wait for it
smarthashmi21
smarthashmi21
BTC
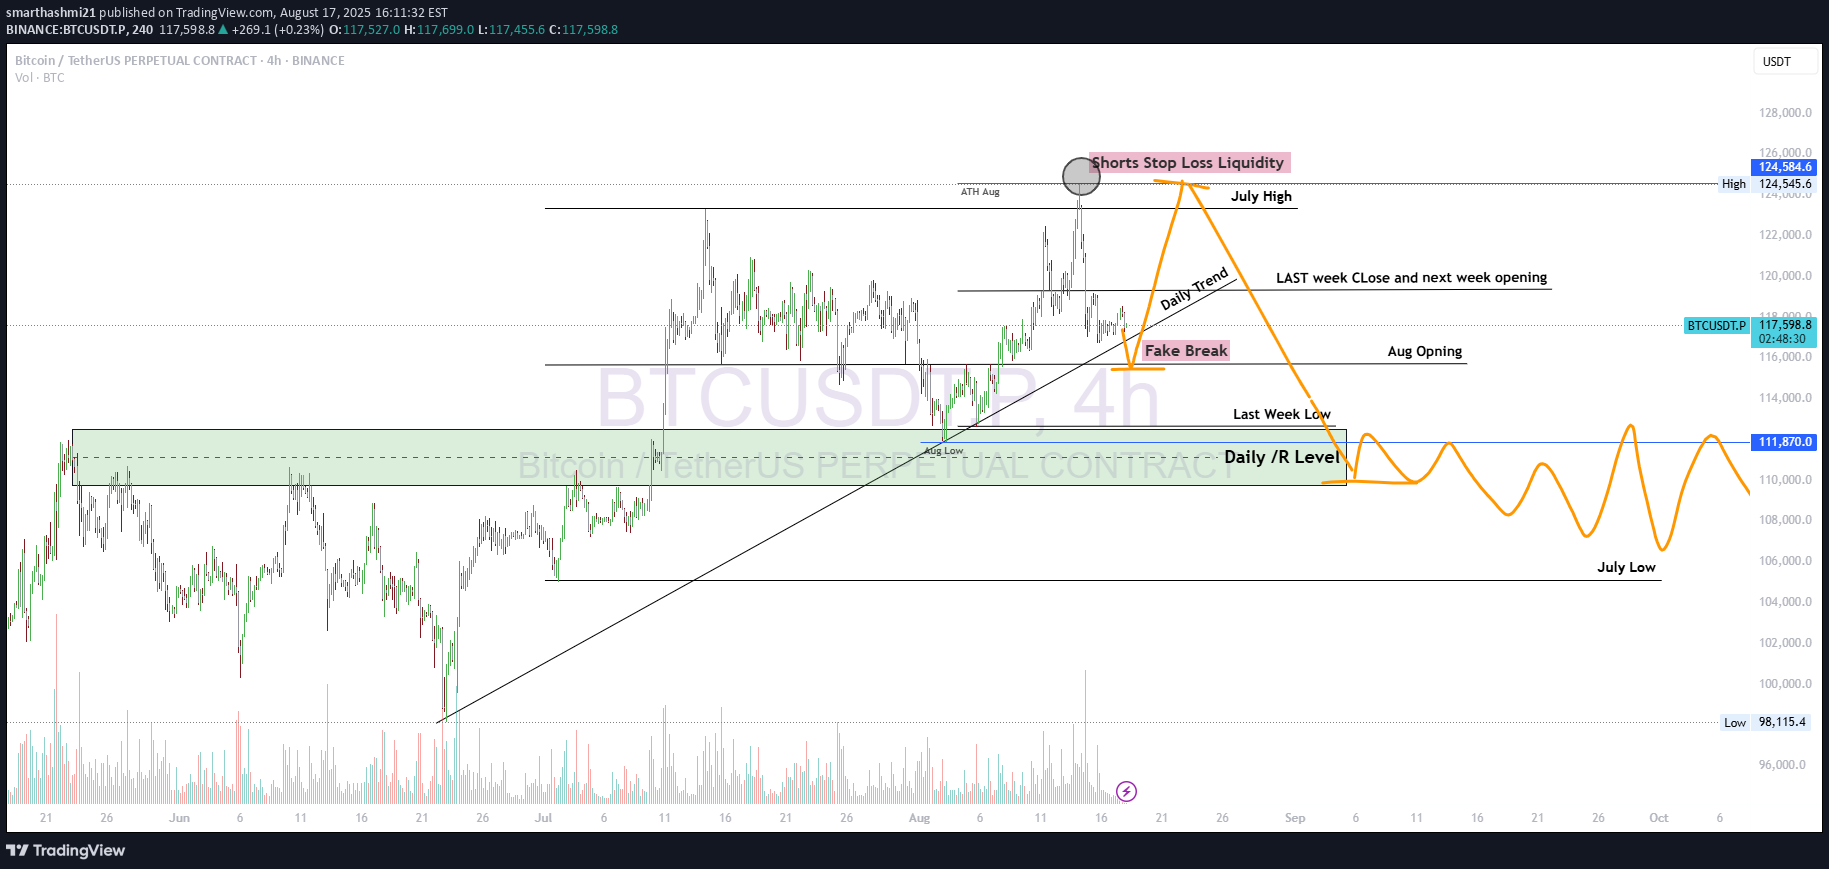
My view on BTC BTCUSD BTC looks like it’s in a distribution zone near 124k–126k. A liquidity sweep above July High (124k–126k) is likely before a deeper correction. After liquidity grab → a retrace toward 111.8k – 112k (your Daily/R Level) is very realistic. If momentum is weak, BTC can even test July Low (105k – 106k). 🔹projection (fake break + liquidity sweep + drop to support) is valid.I agree with it — very probable path.
smarthashmi21
ADA/USDT – Symmetrical Triangle + Harmonic Setup
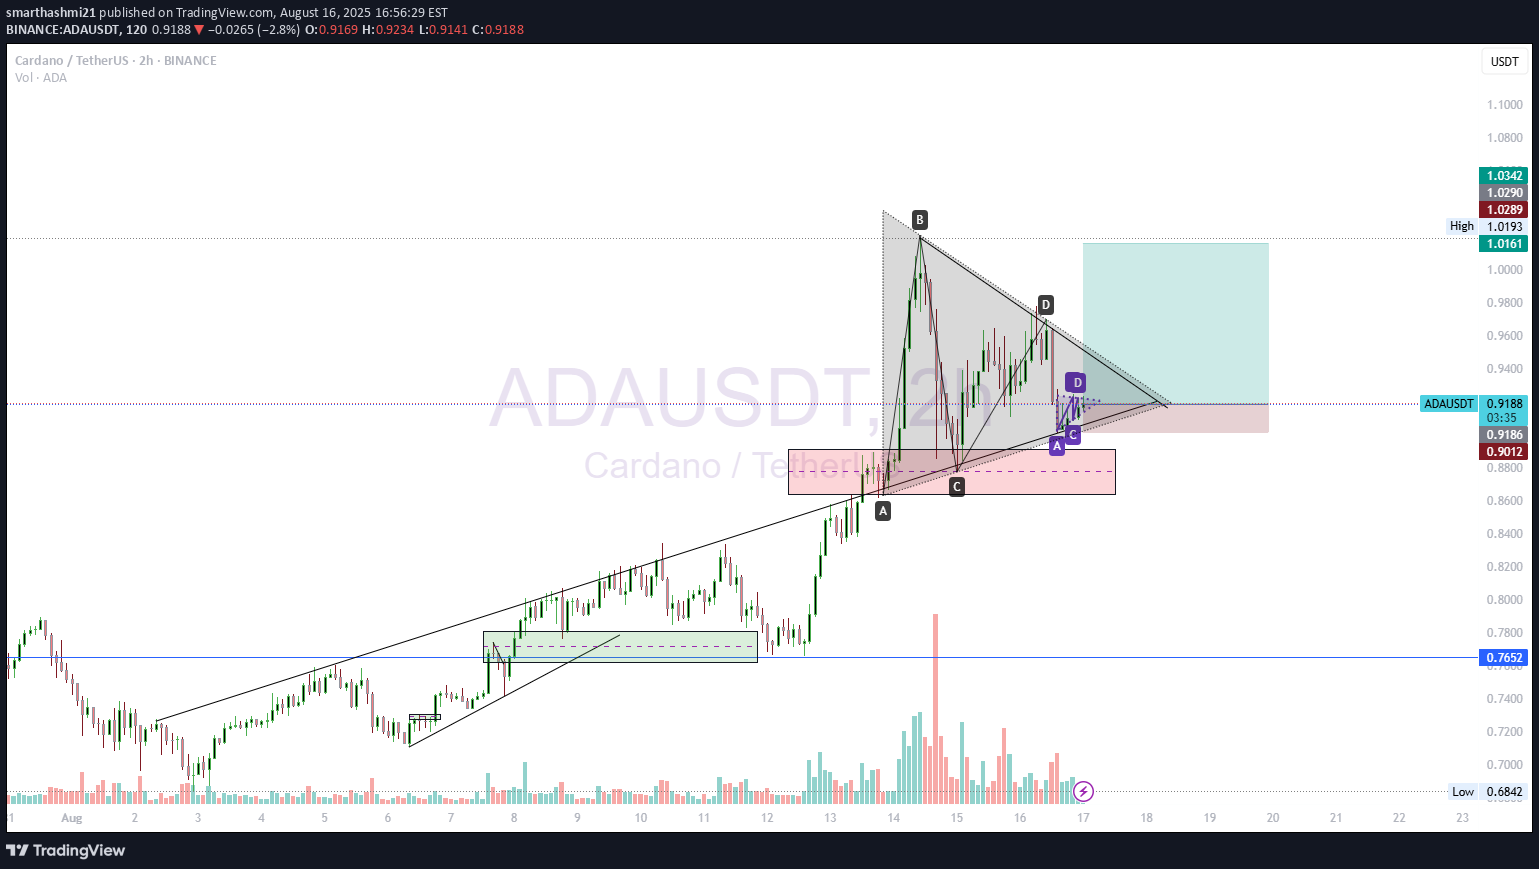
Cardano (ADA) is currently consolidating inside a symmetrical triangle pattern, with a potential breakout in the coming sessions. 🔹 Key Observations: ABCD harmonic structure is forming, aligning with the broader triangle. Strong demand zone around 0.90 – 0.88 acting as support. Volume is gradually decreasing during consolidation → typical before a breakout. Breakout confirmation expected near the triangle apex. 🔹 Trade Idea: Entry: Inside the triangle (0.918–0.920 zone). Stop Loss: Below 0.900 support box. Target: 0.96 – 1.00 (triangle measured move). This setup offers a favorable risk-to-reward ratio with confirmation from both harmonic pattern completion and price structure. ⚠️ As always, breakout confirmation is key — wait for volume spike on the move.
smarthashmi21
DOGEUSDT – Descending Triangle Breakout with ABCD Mapping
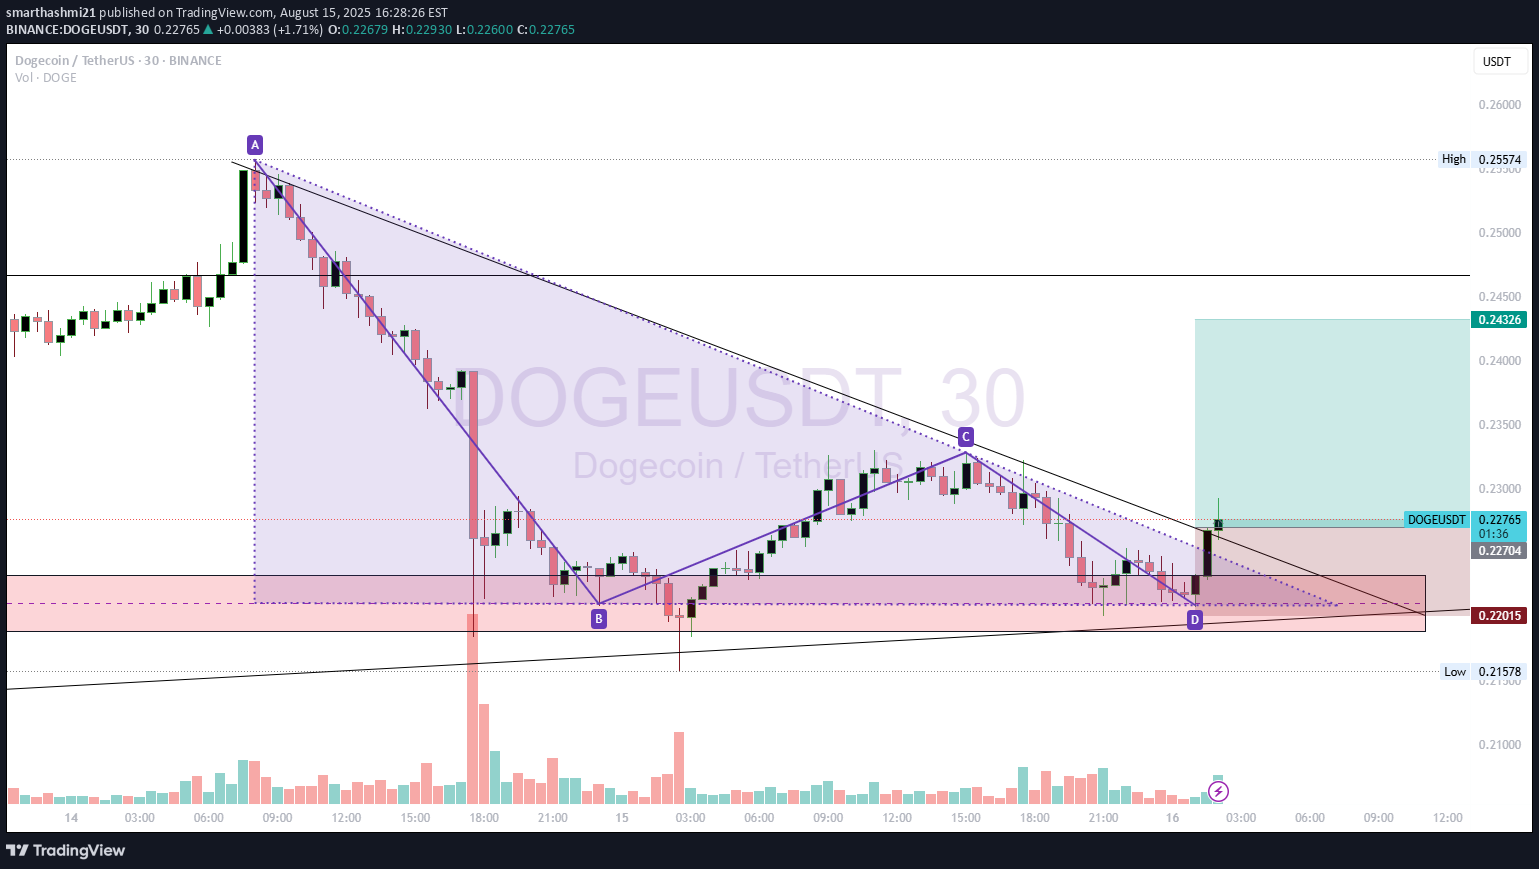
I’ve been tracking DOGEUSDT on the 30m chart using an ABCD point layout to outline a descending triangle pattern. A → C → D: Lower highs consistently respecting the downtrend line. B & D zone (~0.2200): Flat base support forming the triangle floor. Price has now broken above the descending trendline with a noticeable spike in volume, indicating that buyers stepped in aggressively to break the pattern. Why This Matters: Volume was relatively muted during the consolidation phase inside the triangle, which is normal for this type of setup. However, at the breakout candle, volume surged — confirming that the move was not just a false breakout but backed by real market participation. Trade Plan: Entry Zone: Above 0.2270 (confirmed breakout) First Target: 0.2300 Second Target: 0.2430 (measured move from triangle height) Stop Loss: Below 0.2200 (pattern invalidation) Notes: While descending triangles often break downward, this setup shows bullish divergence between price action and volume — suggesting that the market may be preparing for a sustained upside move.
smarthashmi21
BTC USDT Forming Head and shoulder in 5 Min
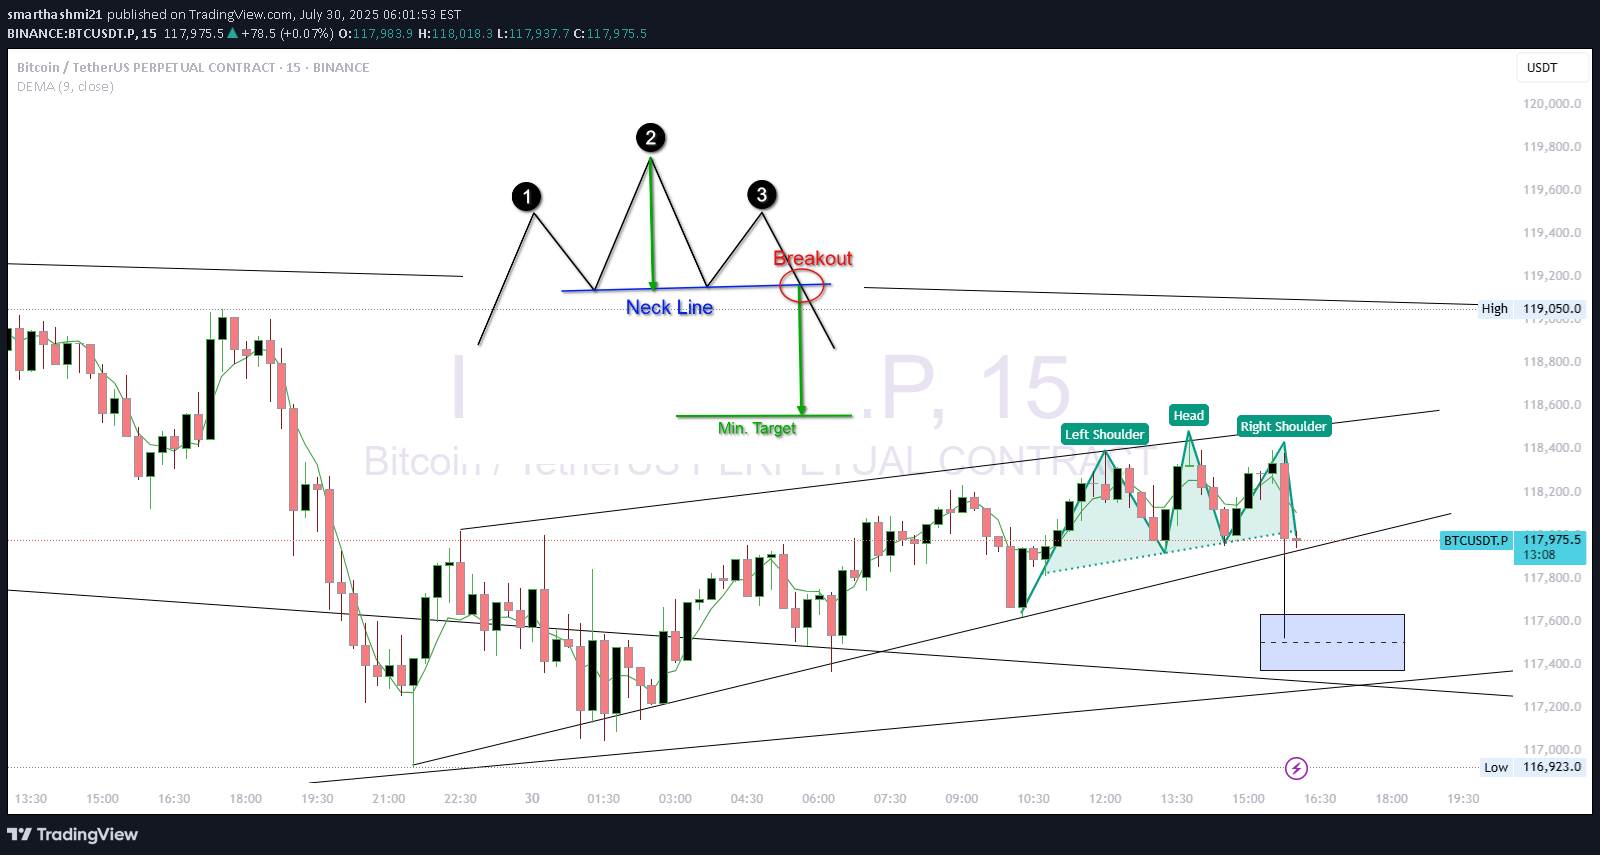
Chart Breakdown 🟢 Pattern: Left Shoulder: 118,450 Head: ~118,600 Right Shoulder: ~118,400 Neckline: Sloping slightly upward, around 118,050 📌 Bearish Breakdown Scenario If BTC breaks below the neckline (~118,000) with volume, the expected drop (measured move) is: Height of pattern: Head (118,600) – Neckline (118,000) = 600 pts Target on breakdown: 118,000 – 600 = ~117,400 🔻 Target: 117,400–117,300 🔒 Invalidation: Price closes above 118,300 with strong volume.
Disclaimer
Any content and materials included in Sahmeto's website and official communication channels are a compilation of personal opinions and analyses and are not binding. They do not constitute any recommendation for buying, selling, entering or exiting the stock market and cryptocurrency market. Also, all news and analyses included in the website and channels are merely republished information from official and unofficial domestic and foreign sources, and it is obvious that users of the said content are responsible for following up and ensuring the authenticity and accuracy of the materials. Therefore, while disclaiming responsibility, it is declared that the responsibility for any decision-making, action, and potential profit and loss in the capital market and cryptocurrency market lies with the trader.