Technical analysis by smarthashmi21 about Symbol DOGE: Buy recommendation (8/15/2025)

smarthashmi21
DOGEUSDT – Descending Triangle Breakout with ABCD Mapping
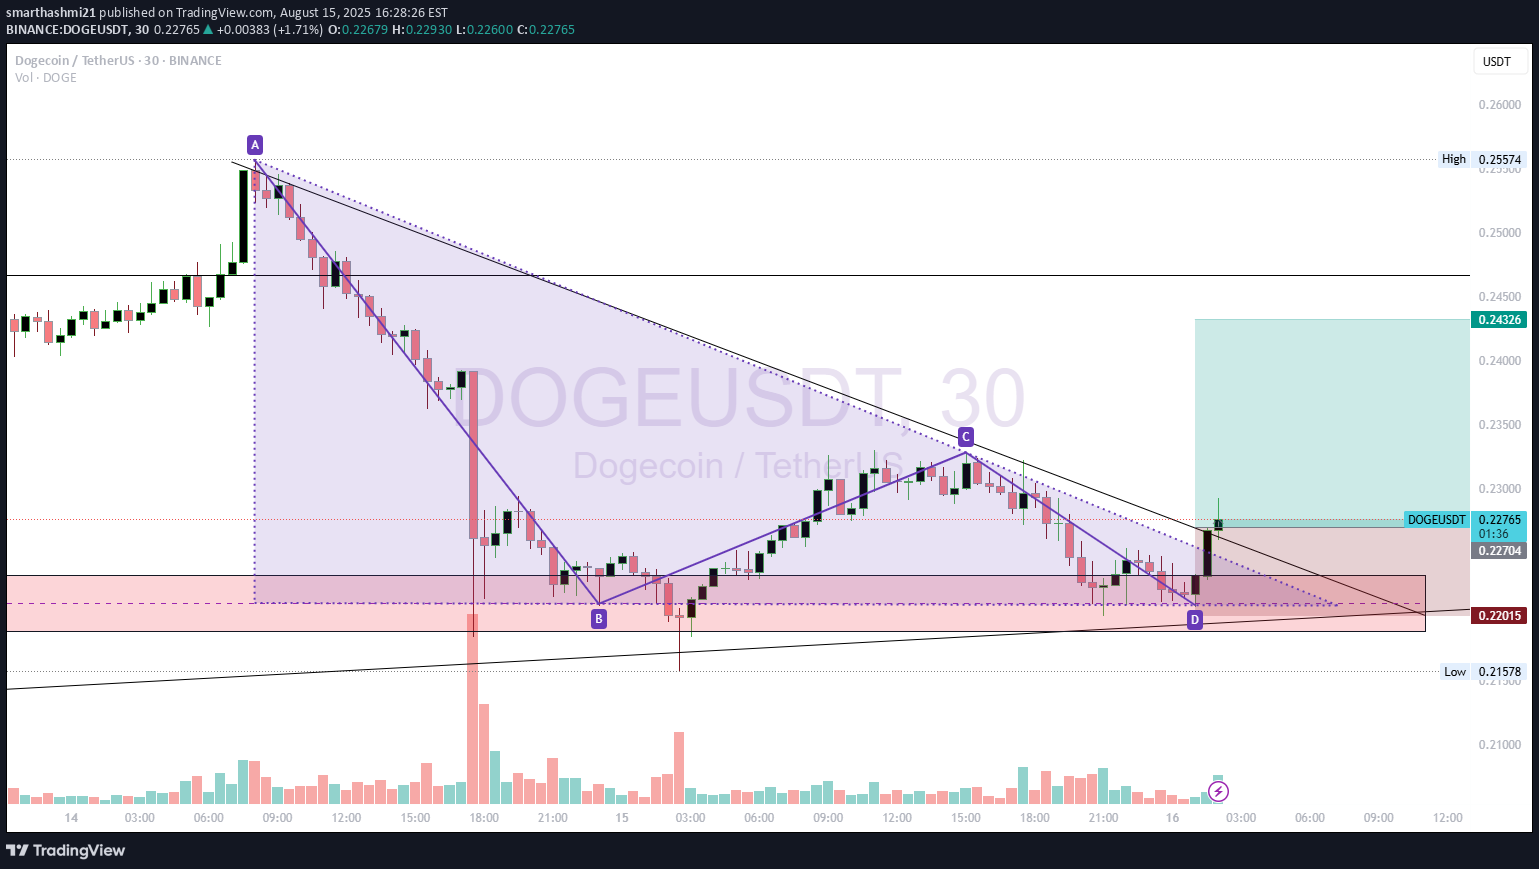
I’ve been tracking DOGEUSDT on the 30m chart using an ABCD point layout to outline a descending triangle pattern. A → C → D: Lower highs consistently respecting the downtrend line. B & D zone (~0.2200): Flat base support forming the triangle floor. Price has now broken above the descending trendline with a noticeable spike in volume, indicating that buyers stepped in aggressively to break the pattern. Why This Matters: Volume was relatively muted during the consolidation phase inside the triangle, which is normal for this type of setup. However, at the breakout candle, volume surged — confirming that the move was not just a false breakout but backed by real market participation. Trade Plan: Entry Zone: Above 0.2270 (confirmed breakout) First Target: 0.2300 Second Target: 0.2430 (measured move from triangle height) Stop Loss: Below 0.2200 (pattern invalidation) Notes: While descending triangles often break downward, this setup shows bullish divergence between price action and volume — suggesting that the market may be preparing for a sustained upside move.