
AIOZ
AIOZ Network
| تریدر | نوع سیگنال | حد سود/ضرر | زمان انتشار | مشاهده پیام |
|---|---|---|---|---|
No results found. | ||||
Price Chart of AIOZ Network
سود 3 Months :
سیگنالهای AIOZ Network
Filter
Sort messages by
Trader Type
Time Frame

Aniiler
شکستن کانال نزولی: آیا قیمت به ۰.۴۲ صعود میکند؟ (تحلیل تکنیکال)
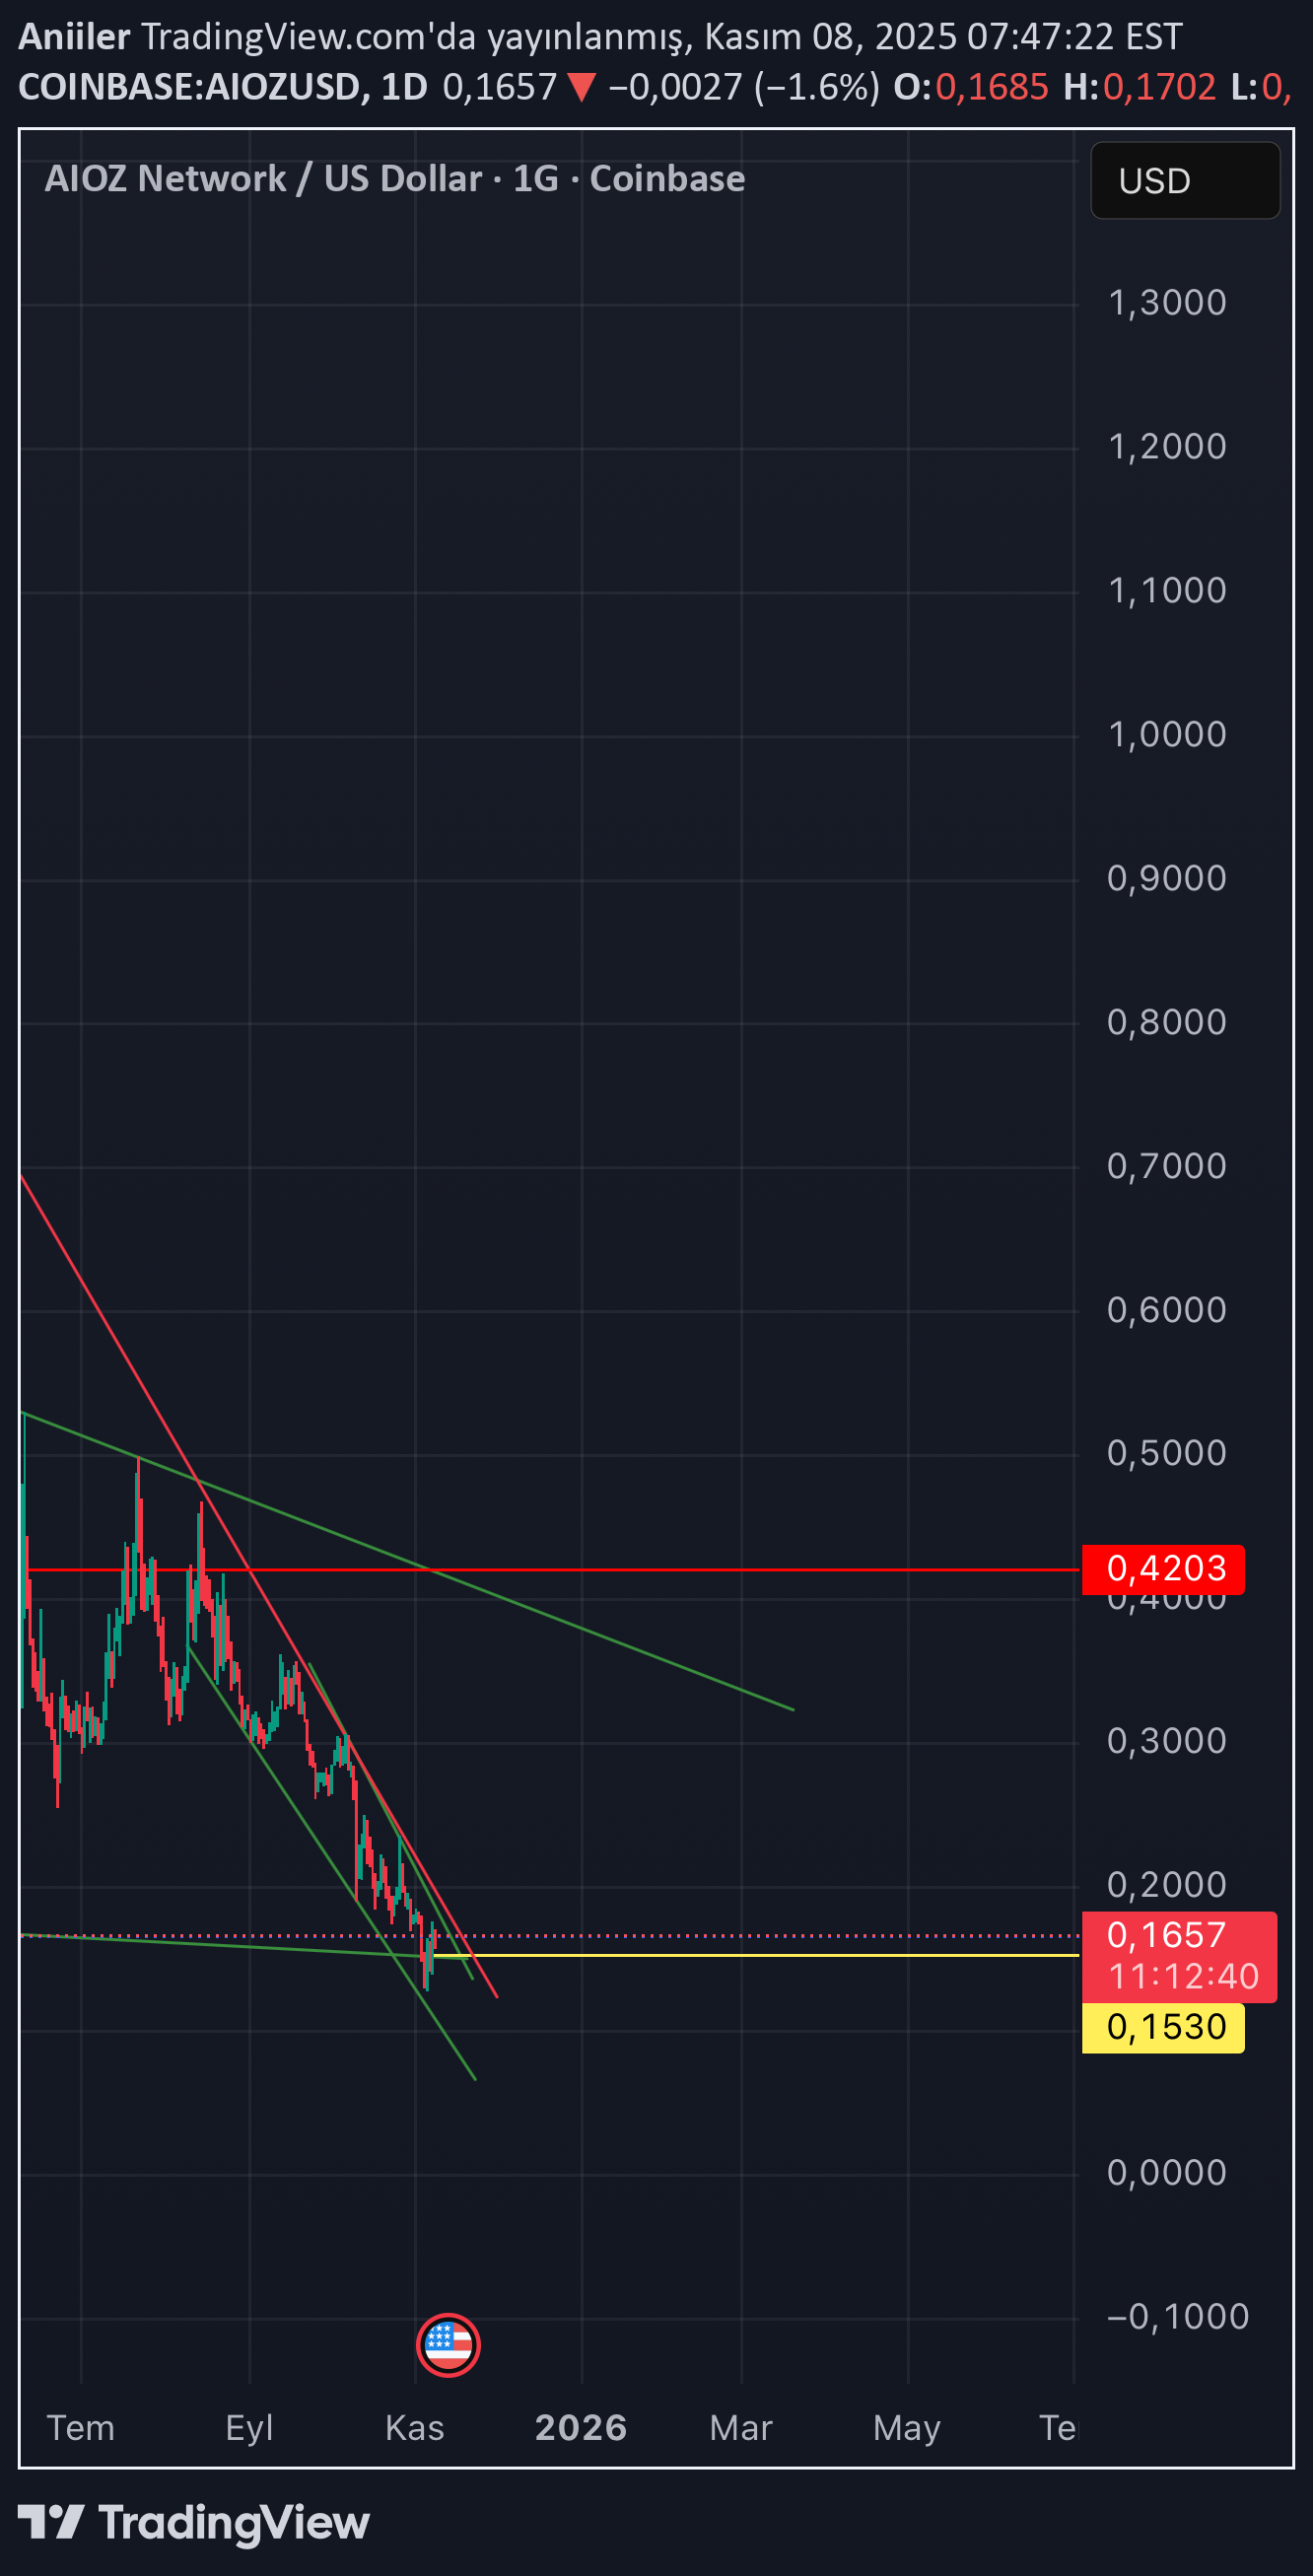
If it can get out of the falling channel, I think there will be a rapid rise to around 0.42. ytd.

benjihyam
سطح خرید بلندمدت AIOZ: آیا زمان انباشت فرا رسیده است؟
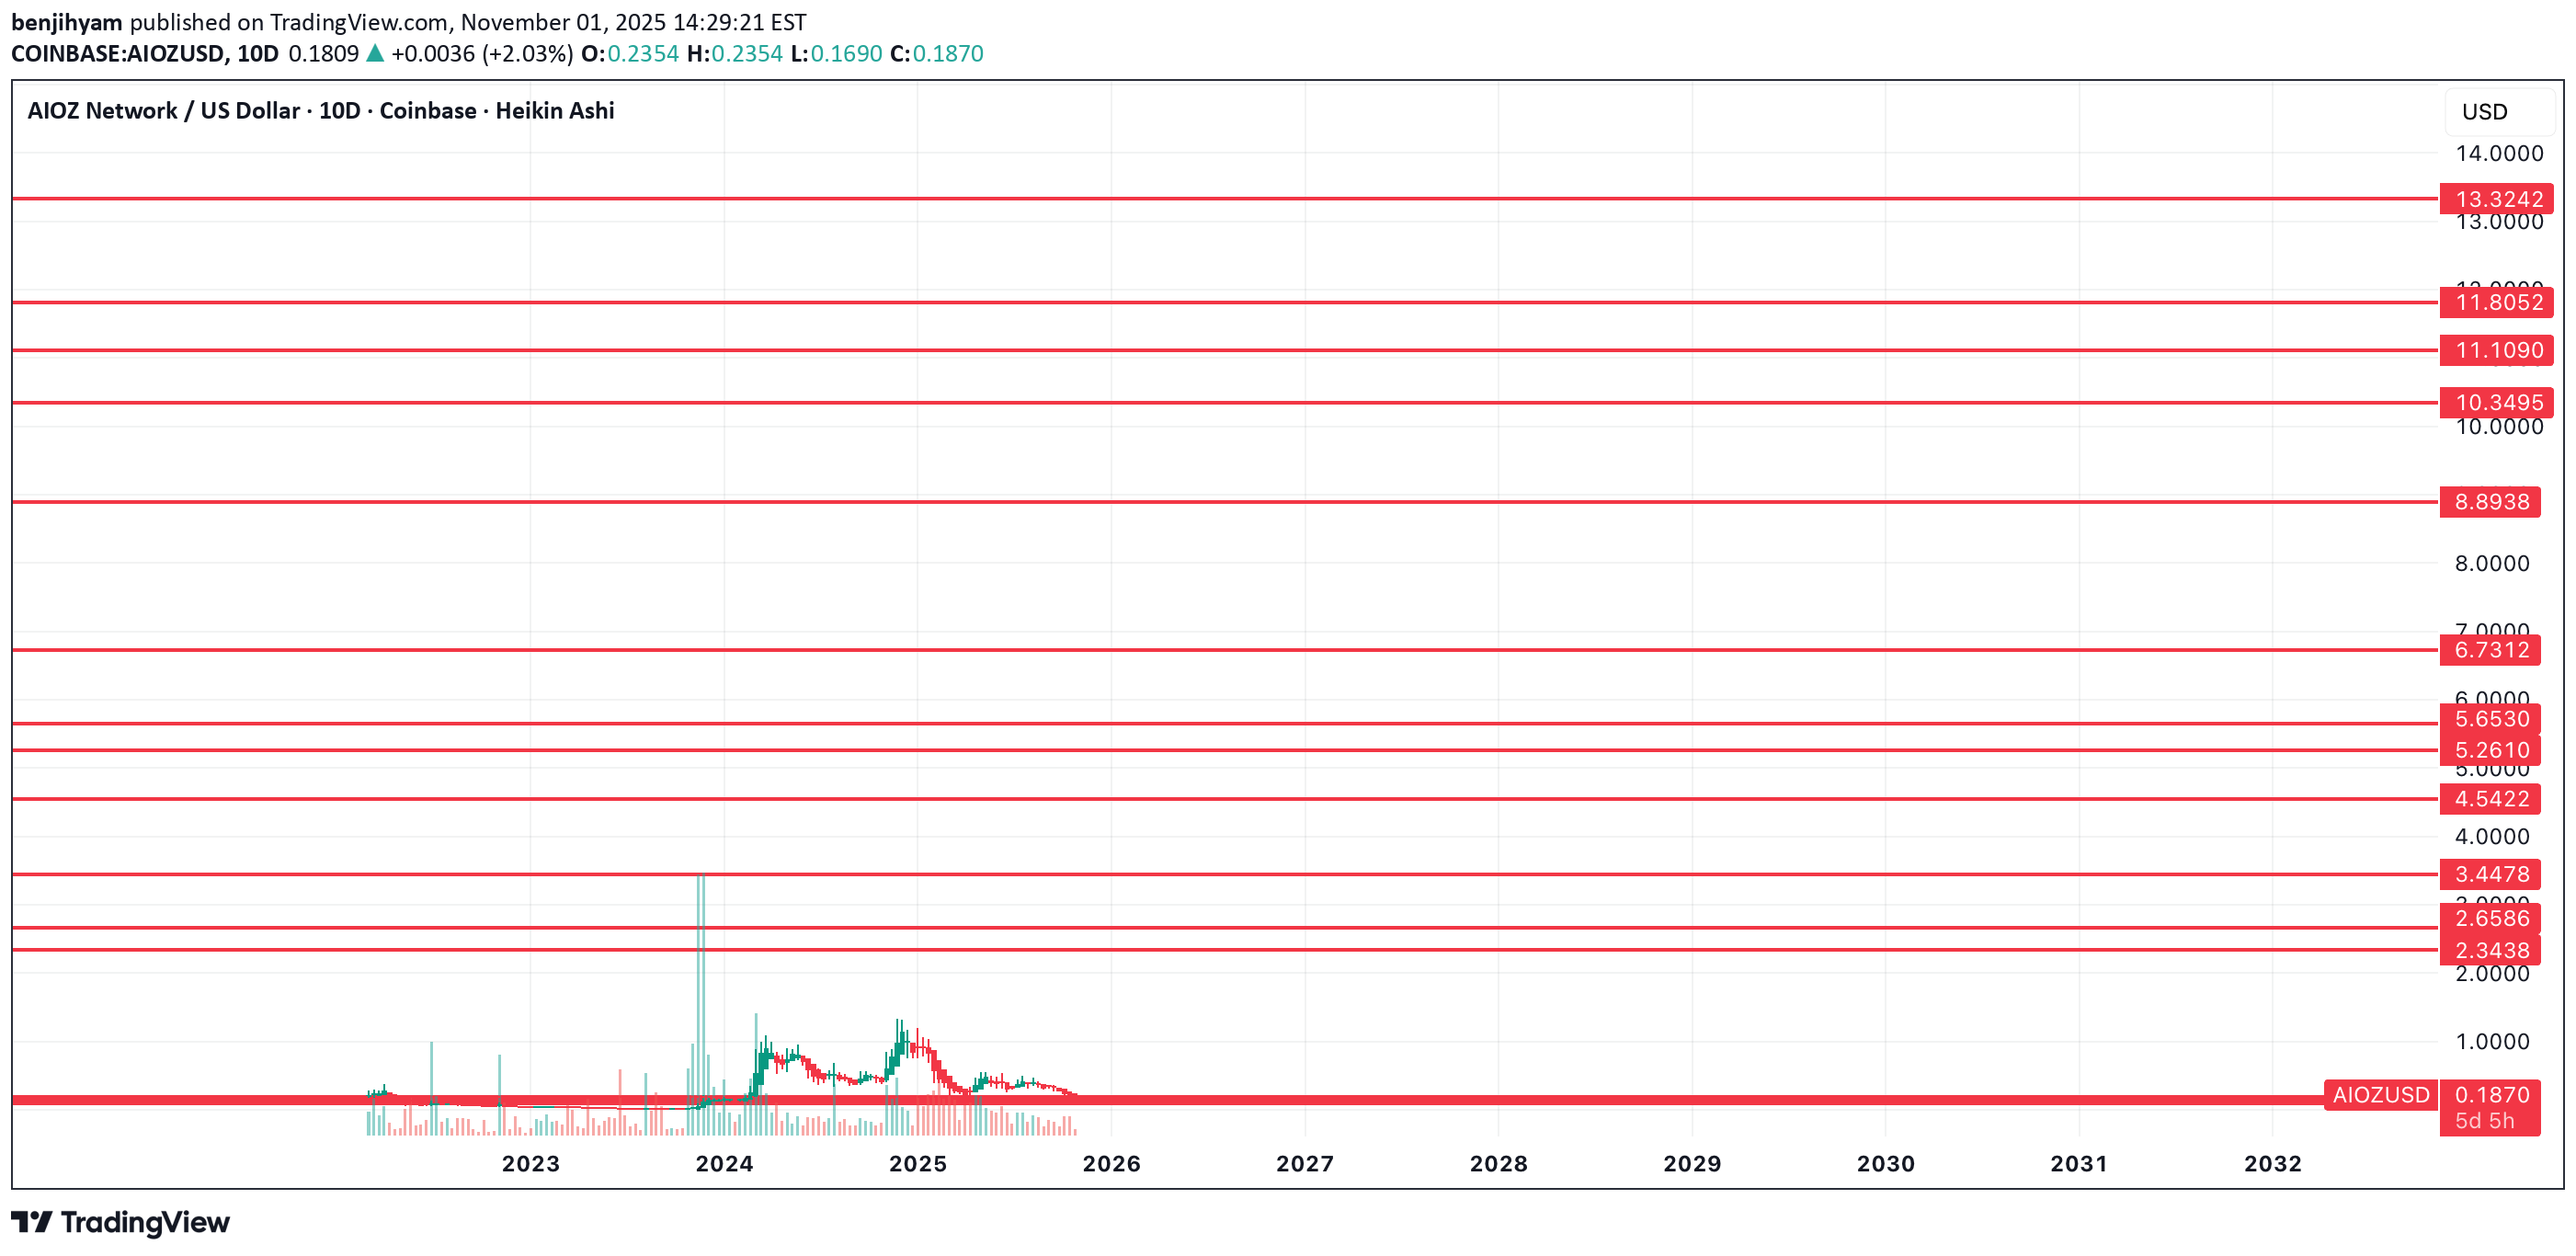
AIOZ is coming into my long term buy area here. I bought some at $.179, and it maybe can see one more move down to $.15 and have some lower supports on the chart incase of an extreme capitulation, but I'm accumulating from here on out as I think this could be a coin that sees over $10. Let's see how it plays out.Good place to start accumulating down at the lower support here.

weslad
Aiozusdt trade opportunity
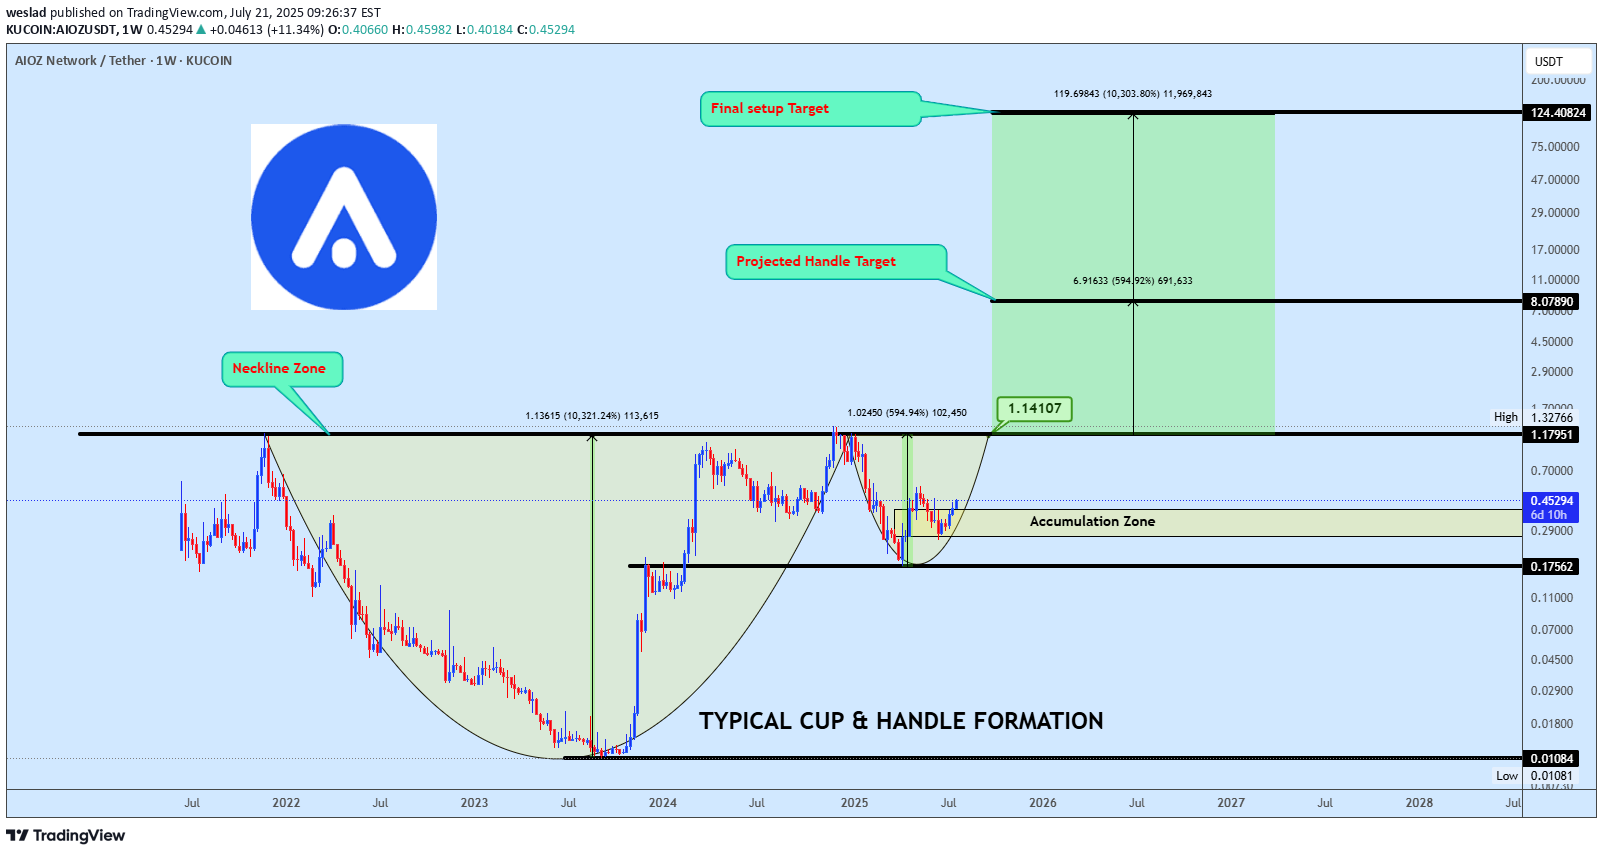
AIOZUSDT is shaping a potential cup and handle pattern, with price nearing the neckline. A confirmed breakout above this level will validate the bullish setup and trigger momentum towards the projected targets.

DBusta999
$aioz

Aioz potential breakout in play. $.3866 first resistance level.

Sugeng_bdc
possible retest ema and pump

possible retest ema and pump target minim 0.6struktur oketook this on my personal mock accI got the original idea from moonin papa tbo indicator but i forgot what's the signal. this is relong which I've taken a trade for this earlier and it ws stopped out profit small.

ProfittoPath
Long Trade Setup – AIOZ/USD (30-Min Chart)!

🟢 🔍 Pattern:Symmetrical triangle breakout (bullish bias after a downtrend pause).✅ Entry Zone:Around $0.4437 (breakout point from triangle consolidation)🔒 Stop-Loss (SL):Below $0.4264 (recent swing low and horizontal support)🎯 Take Profit (TP):TP1: $0.4638 (minor resistance)TP2: $0.4918 (major resistance level)📈 Risk-Reward Ratio:Approx. 1:2+, which is favorable for a long trade.📊 Technical Notes:Price is testing the upper triangle trendline.Yellow circle marks a possible breakout candle.Volume looks moderate but watch for an increase on breakout confirmation.

orionhan
AOIZ/USDT - LONG

-Break out of resistance and retest.- Nice volume off new support.-Overall Trend changing from downtrend to uptrend.

stanleycrypto_1
$AIOZ/USDT Breakout Trade Setup

$AIOZ/USDT – Breakout Trade SetupAIOZ just broke out of its key supply zone after weeks of consolidation!Strong bullish structure trendline support setup.- Target: $1.30- Entry: CMP - SL: $0.35 DYRO, NFA

Yasin_kartal
AIOZ-USDT Ne bekliyoruz?

Short and essential downward signals are more than optimistic

Zorroreny
AIOZ - time for bounce up and reveal next steps
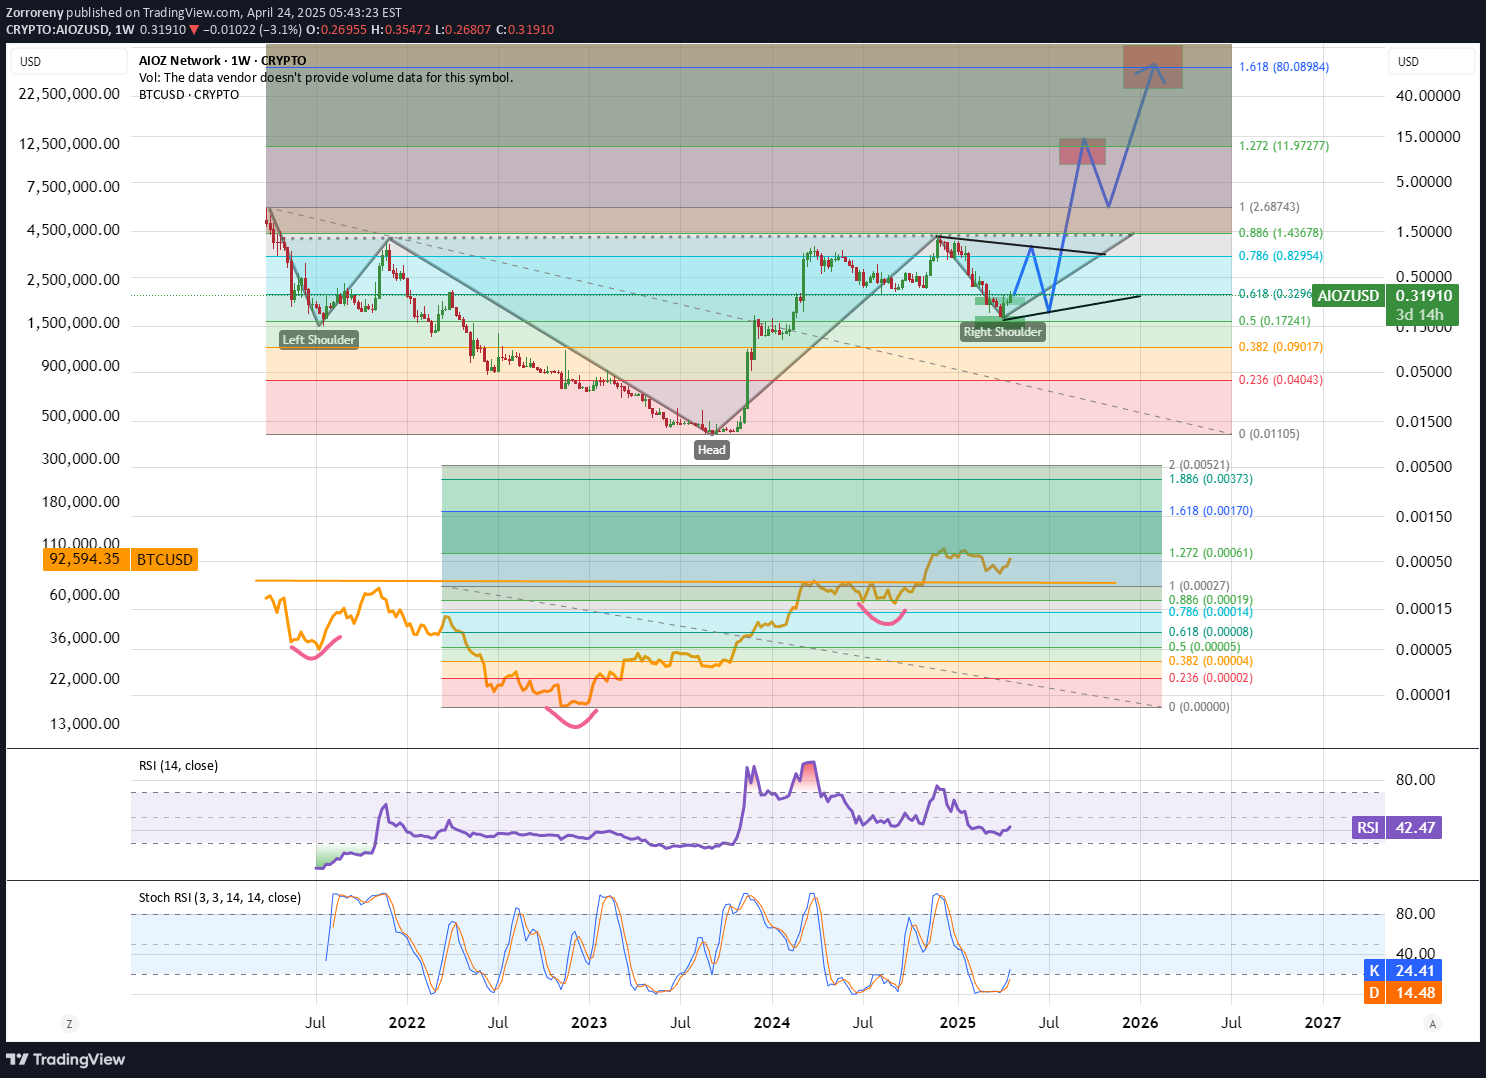
AIOZ did impulse and correction of it. Bounce from the buy zone and I expect now push to 1$ range followed by another deep correction. If we manage to form symmetrical triangle in this range we open path for breakout and potential inverted H&S pattern that would lead toward new ATH; TP ranges being at fibb 1.272 and fibb 1.618 - that would be a similar move that BTC is currently doing. Note 0.18$ is stop loss point as if we loose it we will get dump back to ATL range! As we move up remember to slowly raise stop loss into profit just to be secure.
Disclaimer
Any content and materials included in Sahmeto's website and official communication channels are a compilation of personal opinions and analyses and are not binding. They do not constitute any recommendation for buying, selling, entering or exiting the stock market and cryptocurrency market. Also, all news and analyses included in the website and channels are merely republished information from official and unofficial domestic and foreign sources, and it is obvious that users of the said content are responsible for following up and ensuring the authenticity and accuracy of the materials. Therefore, while disclaiming responsibility, it is declared that the responsibility for any decision-making, action, and potential profit and loss in the capital market and cryptocurrency market lies with the trader.