
SPYX
اس اند پی 500
| تریدر | نوع سیگنال | حد سود/ضرر | زمان انتشار | مشاهده پیام |
|---|---|---|---|---|
 DatTongرتبه: 33 | خرید | حد سود: ۷٬۰۰۰ حد ضرر: ۶٬۷۶۵ | ۱۴۰۴/۸/۶ | |
 julia17رتبه: 105 | فروش | حد سود: تعیین نشده حد ضرر: تعیین نشده | ۱۴۰۴/۸/۸ | |
 The_STAرتبه: 122 | خرید | حد سود: تعیین نشده حد ضرر: تعیین نشده | ۱۴۰۴/۸/۷ | |
 JoeChampionرتبه: 181 | خرید | حد سود: تعیین نشده حد ضرر: تعیین نشده | ۱۴۰۴/۷/۱۸ | |
 isahebdadiرتبه: 789 | خرید | حد سود: ۷٬۰۰۰ حد ضرر: ۶٬۱۴۵ | ۱۴۰۴/۷/۲۶ |
نمودار قیمت اس اند پی 500
سود ۳ ماهه :
سیگنالهای اس اند پی 500
فیلتر
مرتب سازی پیام براساس
نوع پیام
نوع تریدر
فیلتر زمان

نوسانات عجیب SPX تا هالووین: آیا 6800 دوباره لمس میشود؟
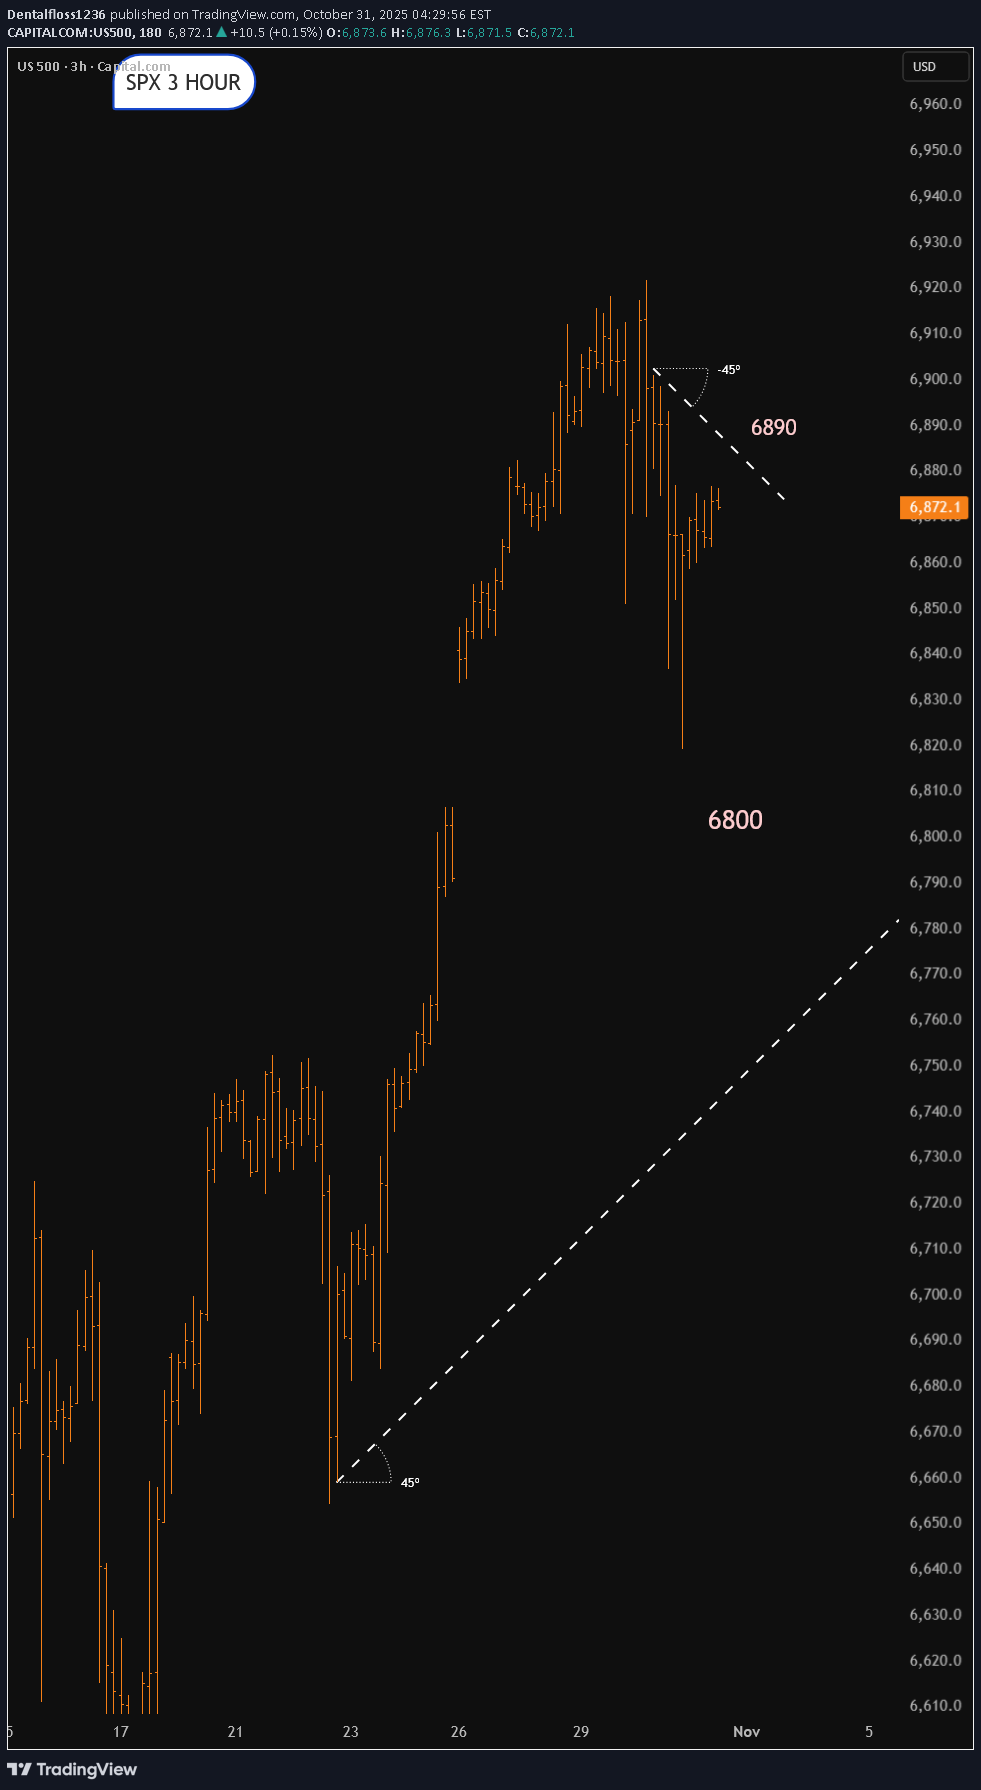
احتمالاً حرکت فراتر از ۶۸۹۰ مورد پذیرش قرار نگیرد. سطح ۶۸۰۰ میتواند مورد آزمایش قرار گیرد. باید دید چه پیش میآید.

شاخص قیمت مصرفکننده (CPI) چیست و چرا برای اقتصاد جهان حیاتی است؟
Introduction: The Pulse of the Global Economy In the complex world of economics, few indicators hold as much influence and significance as the Consumer Price Index (CPI). Whether it’s a policymaker setting interest rates, an investor predicting market movements, or an ordinary consumer noticing rising grocery bills, CPI plays a role in everyone’s financial life. It acts as a mirror reflecting changes in the cost of living and inflation, shaping everything from global monetary policies to household budgets. Simply put, CPI measures how much prices have increased or decreased for a basket of goods and services that consumers typically buy. However, behind this simple concept lies a powerful tool that helps nations assess economic stability, business competitiveness, and the real purchasing power of their citizens. Understanding CPI: The Basics The Consumer Price Index (CPI) is an economic indicator that measures the average change in prices of a fixed basket of goods and services over time. This basket includes everyday items such as food, housing, clothing, healthcare, transportation, and education — essentially capturing the spending habits of urban consumers. CPI as a Measure of Inflation CPI is the most widely used tool to measure inflation — the general increase in prices and fall in the purchasing power of money. When CPI rises steadily, it indicates inflation; when it falls, it suggests deflation. Inflation can be both a sign of growth and a warning signal. Moderate inflation encourages spending and investment, as people prefer to buy now rather than later. But excessive inflation — as seen in countries like Argentina or Turkey in recent years — erodes savings, raises borrowing costs, and destabilizes economies. Conversely, deflation (a sustained drop in prices) might sound appealing but can trigger economic stagnation. Falling prices reduce business revenues and wages, discouraging spending and investment. Thus, tracking CPI helps governments strike a delicate balance between economic growth and price stability. Types of CPI Economists often use different versions of CPI to capture varied aspects of price changes: Headline CPI: This is the broadest measure, including all goods and services in the consumer basket. It reflects the overall inflation rate but can be volatile due to changes in food and energy prices. Core CPI: Excludes food and energy components, as they are prone to short-term fluctuations. Core CPI gives a clearer picture of long-term inflation trends. CPI-W and CPI-U (in the U.S.): CPI-W tracks the spending habits of urban wage earners and clerical workers. CPI-U includes all urban consumers and is considered the official measure of inflation. HICP (Harmonized Index of Consumer Prices): Used by the European Union, this version allows for consistent inflation comparisons across member states. Each variation of CPI serves a specific policy or analytical purpose, allowing economists to monitor inflation more accurately across different sectors and regions. CPI and Global Monetary Policy CPI plays a central role in shaping global monetary policy. Central banks like the Federal Reserve (U.S.), European Central Bank (ECB), Bank of England, and the Reserve Bank of India (RBI) rely on CPI trends to make key decisions about interest rates and money supply. When CPI shows rising inflation, central banks often raise interest rates to cool down spending and borrowing. When CPI indicates deflation or weak inflation, they lower rates to stimulate economic activity. For instance, during the COVID-19 pandemic, global CPI levels dropped as demand collapsed. Central banks responded with historically low interest rates and massive stimulus packages. However, post-pandemic supply chain disruptions and energy shortages sent CPI soaring globally — prompting rapid interest rate hikes in 2022–2023. These fluctuations show how closely CPI data influences global financial stability, currency values, and investment decisions. CPI and Purchasing Power CPI also helps determine changes in purchasing power — how much goods and services a unit of currency can buy. If wages rise slower than CPI, real income effectively decreases, meaning consumers can buy less with the same money. For example: If CPI rises by 6%, but wages increase by only 3%, then real wages have fallen by 3%. This erosion in purchasing power can reduce consumer confidence and spending — key drivers of economic growth. Governments and labor unions often use CPI data to adjust wages, pensions, and social benefits (a process called indexation) to maintain people’s living standards. CPI as a Global Benchmark CPI data is not just a domestic concern — it has international ramifications. Global investors, financial institutions, and multinational corporations all monitor CPI across different countries to assess economic health and currency risks. Here’s how: Exchange Rates: High inflation (rising CPI) typically weakens a nation’s currency because it erodes purchasing power. Investors may move money to countries with lower inflation and higher returns, affecting foreign exchange markets. Investment Flows: CPI trends help guide foreign direct investment (FDI) and portfolio investment decisions. For instance, a stable CPI and moderate inflation attract investors seeking predictable returns. Trade Competitiveness: Countries with lower inflation maintain price stability in exports, making their goods more competitive globally. Conversely, high CPI growth can make exports expensive and hurt trade balances. Thus, CPI serves as a universal barometer for comparing economic conditions across nations. CPI and the Financial Markets The stock market, bond market, and commodity markets react strongly to CPI reports. Traders and investors treat CPI announcements as key economic events because they directly influence interest rate expectations and corporate profitability. Equity Markets: Rising CPI may hurt company profits by increasing input costs. However, certain sectors — like energy, commodities, and consumer staples — often benefit during inflationary periods. Bond Markets: Bonds are highly sensitive to inflation. When CPI rises, bond yields increase because investors demand higher returns to offset the loss of purchasing power. This inversely affects bond prices. Commodity Markets: Commodities such as gold and crude oil often act as inflation hedges. A high CPI can push investors toward tangible assets that retain value when currencies lose purchasing power. Thus, CPI data can trigger short-term volatility and long-term investment strategy shifts across asset classes. Limitations of CPI While CPI is an essential tool, it’s not without flaws. Economists often debate its accuracy and representativeness due to several factors: Substitution Bias: Consumers tend to switch to cheaper alternatives when prices rise, but CPI assumes a fixed basket — overstating inflation. Quality Adjustments: Technological improvements often increase product quality (e.g., smartphones), but CPI may not fully capture this added value. Geographical Variations: Price changes differ between regions. Urban CPI may not accurately reflect rural cost-of-living changes. Lagging Indicator: CPI measures inflation after it has occurred, meaning policymakers are often reacting to past data. Exclusion of Certain Costs: CPI may exclude investment assets like real estate or stocks, even though they significantly affect household wealth. Despite these limitations, CPI remains the most reliable and widely accepted inflation measure because of its consistency and comparability. Case Studies: CPI in Action 1. United States: Inflation and Federal Reserve Policy In 2022, U.S. CPI surged above 9%, the highest in four decades. Rising food, fuel, and housing costs prompted the Federal Reserve to raise interest rates aggressively throughout 2022–2023. This decision cooled inflation but also slowed economic growth and rattled stock markets. It showcased how CPI data can reshape monetary strategy and ripple through global markets. 2. India: Balancing Growth and Inflation India’s CPI basket is heavily weighted toward food and housing. When food prices rise due to poor monsoon or supply shortages, CPI spikes quickly. The RBI uses CPI as its main inflation target, aiming to keep it between 2–6%. By adjusting repo rates based on CPI trends, the RBI manages both growth and price stability. 3. Eurozone: The Battle with Deflation and Energy Prices For years, the Eurozone struggled with low inflation and deflation risks, prompting the ECB to maintain ultra-low interest rates. However, after the Ukraine conflict in 2022, energy-driven CPI spikes forced the ECB to tighten policy sharply. This swing illustrated CPI’s impact on regional economic integration and fiscal coordination. CPI in the Context of Global Challenges Today’s world faces unprecedented inflationary pressures due to factors like: Geopolitical conflicts (e.g., Russia–Ukraine) Supply chain disruptions Energy market volatility Climate change impacting agriculture Post-pandemic demand surges As a result, global CPI data has become a critical early warning system for potential recessions, stagflation, or monetary tightening cycles. International institutions such as the IMF and World Bank rely on CPI trends to forecast global growth and recommend policy adjustments. Future of CPI: Adapting to a Changing Economy As consumption habits evolve, CPI calculations must also adapt. The rise of digital goods, subscription services, and AI-driven economies is reshaping how statisticians define the “consumer basket.” Future CPI methodologies may include: Real-time price tracking using big data and AI Regional CPI dashboards for urban and rural contrasts Inclusion of environmental costs and green inflation (the impact of climate policies on prices) Better adjustments for technological improvements Such innovations will make CPI a more accurate, dynamic, and inclusive measure of global inflation. Conclusion: The Global Significance of CPI The Consumer Price Index is more than just a number; it is the heartbeat of the world economy. It influences how central banks set interest rates, how investors allocate capital, how governments plan budgets, and how families manage their daily expenses. Understanding CPI is crucial not only for economists but for anyone navigating an interconnected global economy. Whether inflation is surging or stabilizing, CPI tells the story of how value, consumption, and confidence move together in shaping our economic future. In a world of shifting trade patterns, volatile energy markets, and evolving digital economies, CPI remains the compass that helps policymakers, businesses, and citizens alike find direction amid economic uncertainty.
Trade Nation
درآمدهای S&P 500: آیا بازار به سمت نوسان بزرگ حرکت میکند؟
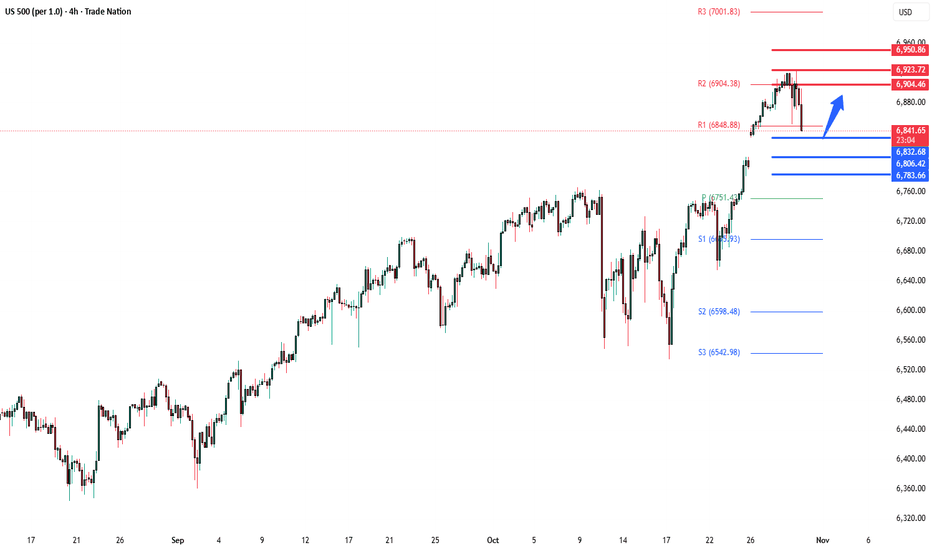
شاخص S&P 500 با (۰.۰۰۴%-)، تقریباً بدون تغییر به کار خود پایان داد. این در حالی بود که پاول انتظارات برای کاهش بیشتر نرخ بهره فدرال رزرو در ماه دسامبر را تعدیل کرد، اما مذاکرات تجاری مثبت بین ترامپ و شی و رسیدن ارزشگذاری انویدیا به نقطه عطف ۵ تریلیون دلاری، به احساسات بازار جان بخشید. بازده اوراق خزانهداری ۱۰ ساله افزایش شدیدی یافت (۱۰.۱+ واحد مبنا)، زیرا بانک مرکزی ژاپن (BoJ) سیاست خود را ثابت نگه داشت و رشد سهام فناوری، شاخص نزدک (۰.۵۵%+) و گروه Mag-7 (۱.۰۳%+) را به بالاترین سطوح جدیدی هدایت کرد. معاملات آتی سهام ایالات متحده در آستانه رویدادهای کلیدی امروز اندکی افزایش یافتهاند: گزارش درآمد اپل و آمازون که جهتگیری نزدک را مشخص میکند، و تصمیم سیاست پولی بانک مرکزی اروپا (ECB) که در آن انتظار میرود نرخها در سطح ۲% بدون تغییر بمانند. توجه عمومی گسترده نیز به نتایج شرکتهای الی لیلی، مرک و گیلئاد در حوزه داروسازی، و همچنین گزارشهای درآمدی شرکتهای بخش انرژی و صنعتی معطوف بود. سطوح کلیدی حمایت و مقاومت: سطح مقاومت ۱: ۶۹۰۴ سطح مقاومت ۲: ۶۹۲۳ سطح مقاومت ۳: ۶۹۵۰ سطح حمایت ۱: ۶۸۳۲ سطح حمایت ۲: ۶۸۰۶ سطح حمایت ۳: ۶۷۸۳ این ارتباط صرفاً برای اهداف اطلاعاتی است و نباید به عنوان نوعی توصیه برای یک اقدام خاص یا به عنوان مشاوره سرمایهگذاری تلقی شود. هدف از آن، ارائه پیشنهاد یا درخواستی برای خرید یا فروش هیچ ابزار مالی یا تأیید رسمی هیچ معاملهای نیست. نظرات، برآوردها و مفروضاتی که در اینجا بیان شدهاند، مربوط به تاریخ این ارتباط هستند و ممکن است بدون اطلاع قبلی تغییر کنند. این ارتباط بر اساس اطلاعاتی، از جمله قیمتهای بازار، دادهها و سایر اطلاعاتی که قابل اتکا تلقی میشوند، تهیه شده است؛ با این حال، Trade Nation کامل بودن یا دقت آن را تضمین نمیکند. تمام قیمتهای بازار و دادههای بازار موجود در این ارتباط یا پیوستشده به آن، صرفاً جنبه نمایشی دارند و بدون اطلاع قبلی در معرض تغییر هستند.

رازهای فصل گزارش سود: چگونه مثل حرفهایها هر فصل را مدیریت کنیم؟
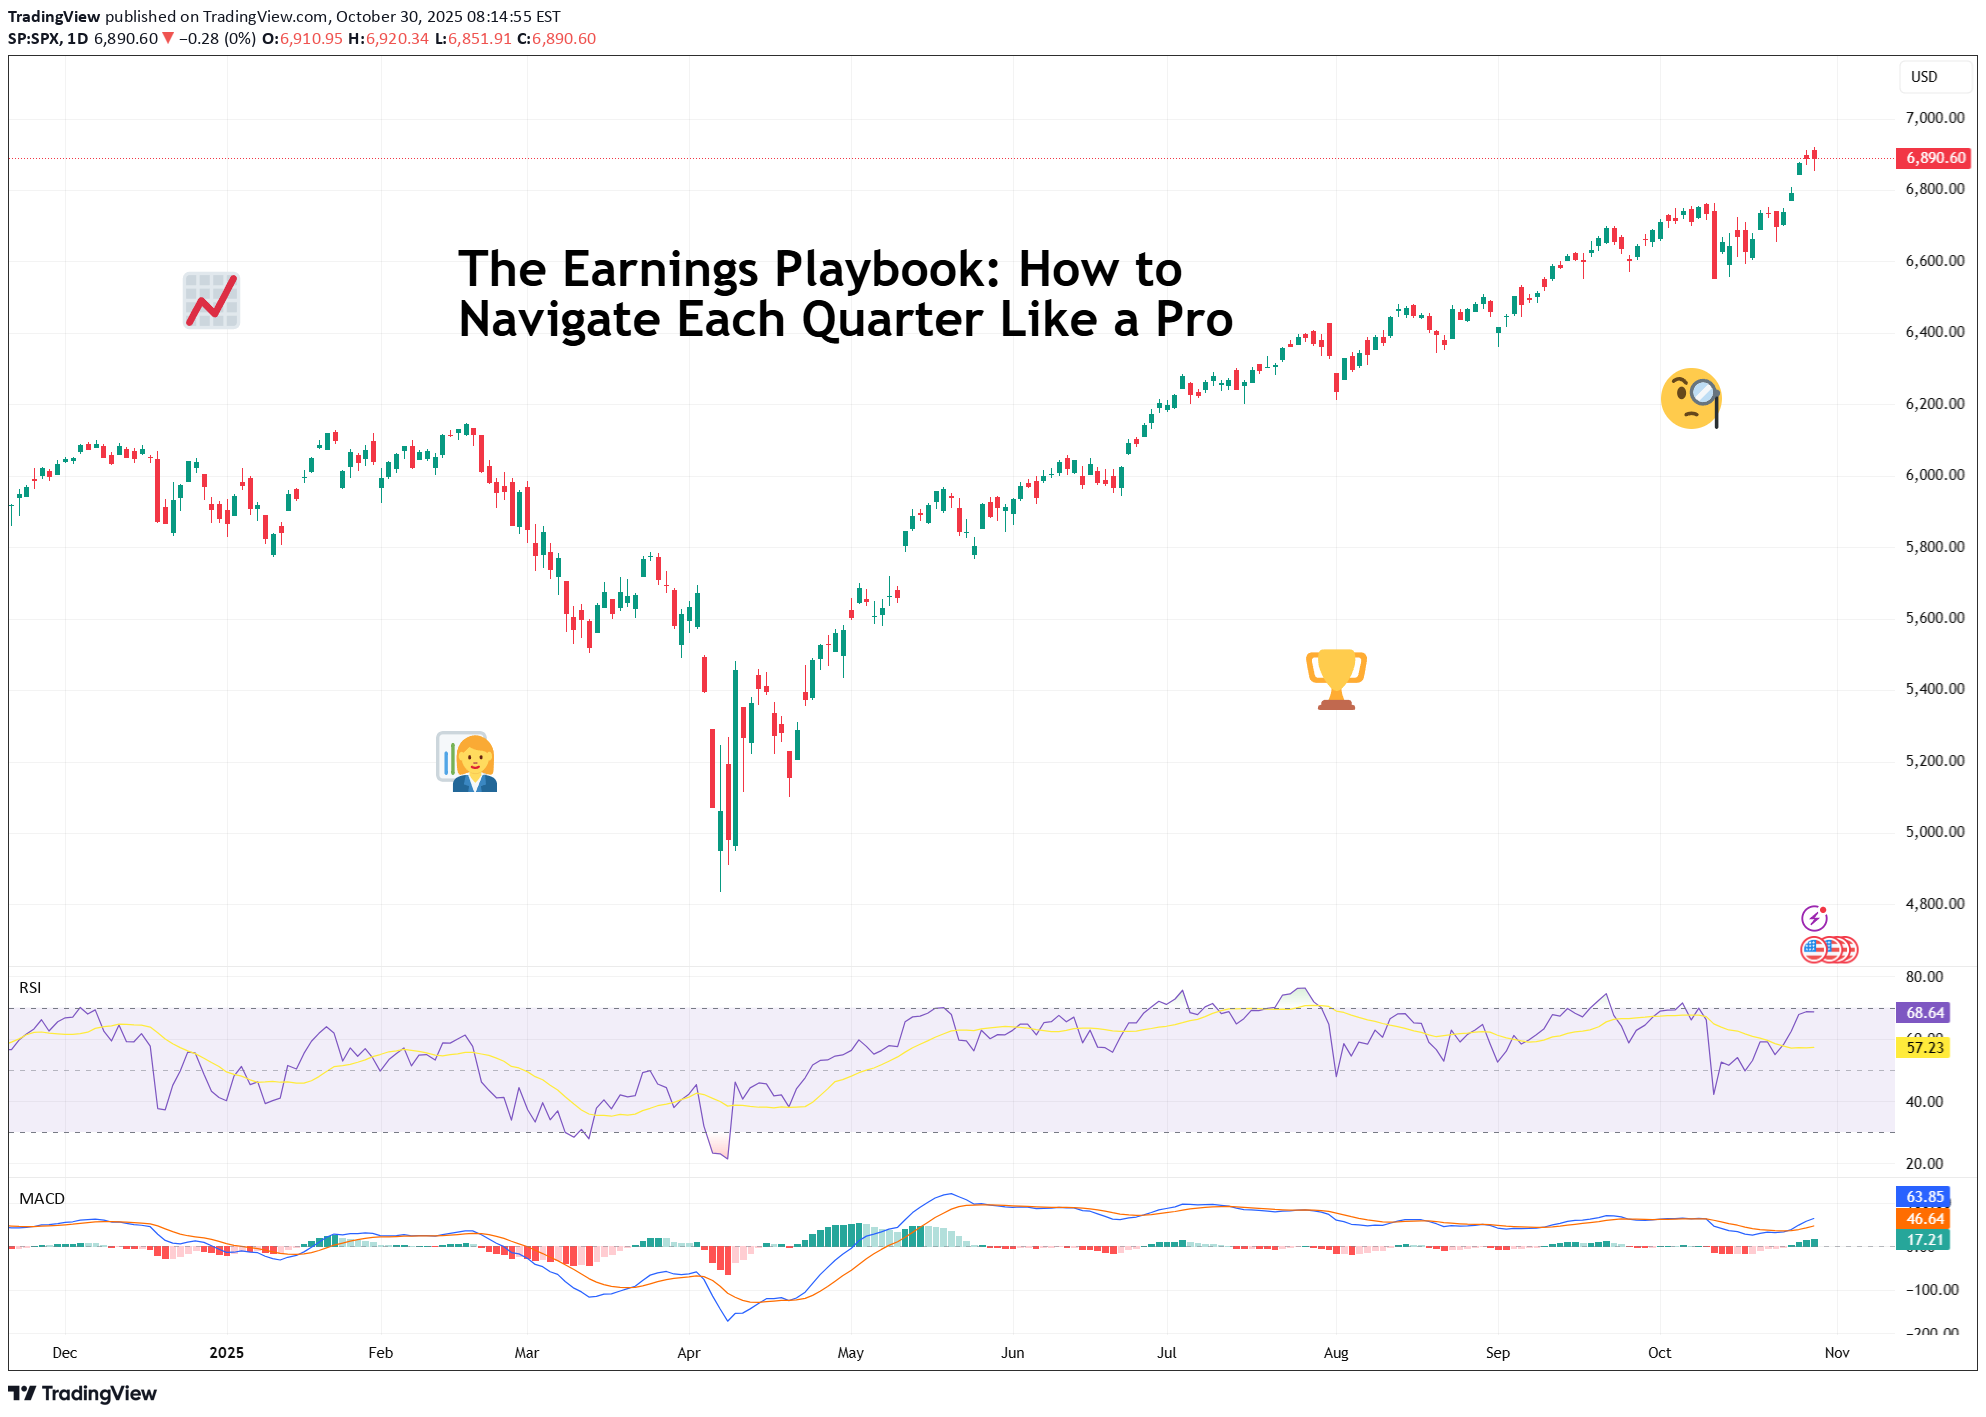
معامله گران در تب و تاب فصل درآمد هستند و سرخوشی هر گوشه بازار را فرا گرفته است. نمودارها منقبض می شوند، معامله گران به مدت پنج دقیقه در مورد فدرال رزرو صحبت نمی کنند ( هر چند نه این هفته ) و انجمن های آنلاین به رژه جلسات watch-me-trade تبدیل می شوند. زمانی که شرکتها کتابها را باز میکنند و آنچه را که واقعاً در پشت صحنه اتفاق میافتد فاش میکنند، آنقدر شکوهمند است. برای سرمایه گذاران حرفه ای، بهشت data است. برای معاملهگران خردهفروشی، کاردیویی احساسی است. سهام میتواند با یک پیشبینی خوشبینانه 20 درصد افزایش یابد - یا قبل از خنک شدن قهوه شما به شدت کاهش یابد. ترفند فقط زنده ماندن از آن نیست. برای پیمایش آن مانند pro است. 💼 فصول را بشناسید (و نوسانات خلقی) فصل درآمد four بار در سال - ژانویه، آوریل، جولای و اکتبر - می آید و هر کدام طعم خاص خود را دارند. Q1 (آوریل): این سه ماهه خماری است. فروش تعطیلات با کاهش هزینه های سال جدید روبرو می شود. معامله گران انتظارات را دوباره تنظیم می کنند و واقعیت با جاه طلبی برخورد می کند. Q2 (ژوئیه): معاینه اواسط سال. مدیران اجرایی درباره «تحرک» لاف می زنند، تحلیلگران شروع به تراشیدن مدادهای red خود می کنند. بازارها متلاطم می شوند. Q3 (اکتبر): آزمون اعتبار. بازنگری های راهنمایی و لحن محتاطانه غالب است. اگر سال خوب بود، دورهای پیروزی از اینجا شروع می شود. Q4 (ژانویه): جدول امتیازات آشکار می شود. همه برنده ها و باخت های سالانه خود را محاسبه می کنند و معامله گران شروع به شرط بندی روی اینکه چه کسی حرکت سال آینده را حمل می کند، می کند. هر چرخه ریتم مشابهی دارد: هیاهو، واکنش، هضم و حدس و گمان. به آن مانند یک نمایشنامه چهار پرده فکر کنید. 📊 به شکاف فکر کنید هر زمان که خود را در سودآوری درآمد قرار دادید باید به یک نکته توجه کنید: اعداد واقعی کمتر از روایت اهمیت دارند. ( به تو نگاه می کنم، اوراکل ORCL ) یک شرکت میتواند درآمد خود را شکست دهد، سود خود را از دست بدهد، و همچنان رشد کند - اگر مدیر عامل شرکت در سه ماهه آینده یک story قانعکننده بفروشد. برعکس، میتواند درآمدهای بیسابقهای را ثبت کند، زیرا تحلیلگران حتی بیشتر از این میخواستند. pros می دانند که فراتر از تیتر نگاه کنند EPS. آنها به راهنمایی، حاشیه ها و عملکرد بخش می پردازند. آیا درآمد به دلیل تقاضای واقعی رشد می کند یا فقط حسابداری خلاقانه؟ آیا حاشیه ها در حال بهبود هستند یا شرکت بی سر و صدا R&D را کاهش داده است؟ بازارها آنچه را که اتفاق افتاده است قیمت گذاری نمی کنند - آن چیزی که در آینده رخ می دهد قیمت گذاری می کنند. این به ویژه برای سهام های رشدی مانند t صادق است شرکت های فناوری . 🎯 حریف زانو را تعقیب نکنید هر فصل درآمدی سهم خود را از واکنشهای بیش از حد فوری دارد - نوعی هرج و مرج "افزایش 10٪ در باز، 8٪ کاهش تا ناهار". آن وقت است که معامله گران باتجربه کنار می نشینند و اجازه می دهند نوسانات کارهای سنگین را انجام دهد. پول هوشمند از خریدن به جنون یا کوتاهی در ناامیدی جلوگیری می کند. در عوض، آنها منتظر دومین move میمانند - زمانی که گرد و غبار نشست، الگوریتمها آرام میشوند و انسانها به میز کار خود باز میگردند. 🧠 کتاب بازی خود را بسازید برای معامله فصل درآمد مانند یک حرفه ای، به یک برنامه نیاز دارید. در اینجا نحوه آماده سازی کهنه سربازان آمده است: زود شروع کن بررسی کنید تقویم درآمد و نام های پرتأثیر را در نمونه کارها یا لیست تماشای خود علامت بزنید. تنظیم را مطالعه کنید به نحوه عملکرد سهام در سمت سود نگاه کنید. یک تجمع بزرگ پیش از گزارش می تواند به معنای بالا بودن انتظارات باشد. روی راهنمایی تمرکز کنید. نرخ سود یک خبر قدیمی است - نظرات آینده بازارها را حرکت می دهد. از اندازه موقعیت استفاده کنید. هرگز farm را روی یک گزارش شرط بندی نکنید. حتی بهترین تنظیمات هم میتوانند به سمتی بروند. ماکرو را فراموش نکنید. کاهش نرخ، چاپ تورم یا یک توییت سرگردان از رئیس جمهور ایالات متحده می تواند بهترین نرخ سود را تحت الشعاع قرار دهد. 🕹️ تصویر بزرگ: درآمد به عنوان GPS بازار فصل سود، بررسی سلامت بازار است، زیرا به شما میگوید کدام بخشها در حال رونق هستند، کدامها در حال لنگیدن هستند، و مدیران اجرایی چه احساسی نسبت به آینده دارند (به این زبان دقت کنید: «بادهای مخالف» و «نوسانها» روشهای مؤدبانهای برای گفتن کماندن بالا هستند). روی هم رفته، روند سود روایت گسترده تری را شکل می دهد - از انتظارات نرخ بهره گرفته تا چرخش بخش. به عبارت دیگر، فصل سود جایی است که معاملات کوتاه مدت با سرمایه گذاری بلندمدت ملاقات می کند. اکنون بروید و برای دسته بعدی درآمد آماده شوید - بیگ تک روی عرشه است این هفته با اپل AAPL و آمازون AMZN گزارش امروز به سمت شما : استراتژی شما در این فصل درآمد چیست؟ خرید hype یا منتظر خرید شیب؟ نظرات خود را در نظرات به اشتراک بگذارید!

VIPindicators
سیگنال خرید قوی: S&P 500 (SPX) کانال صعودی را شکست! فرصت ورود به بازار رسید.
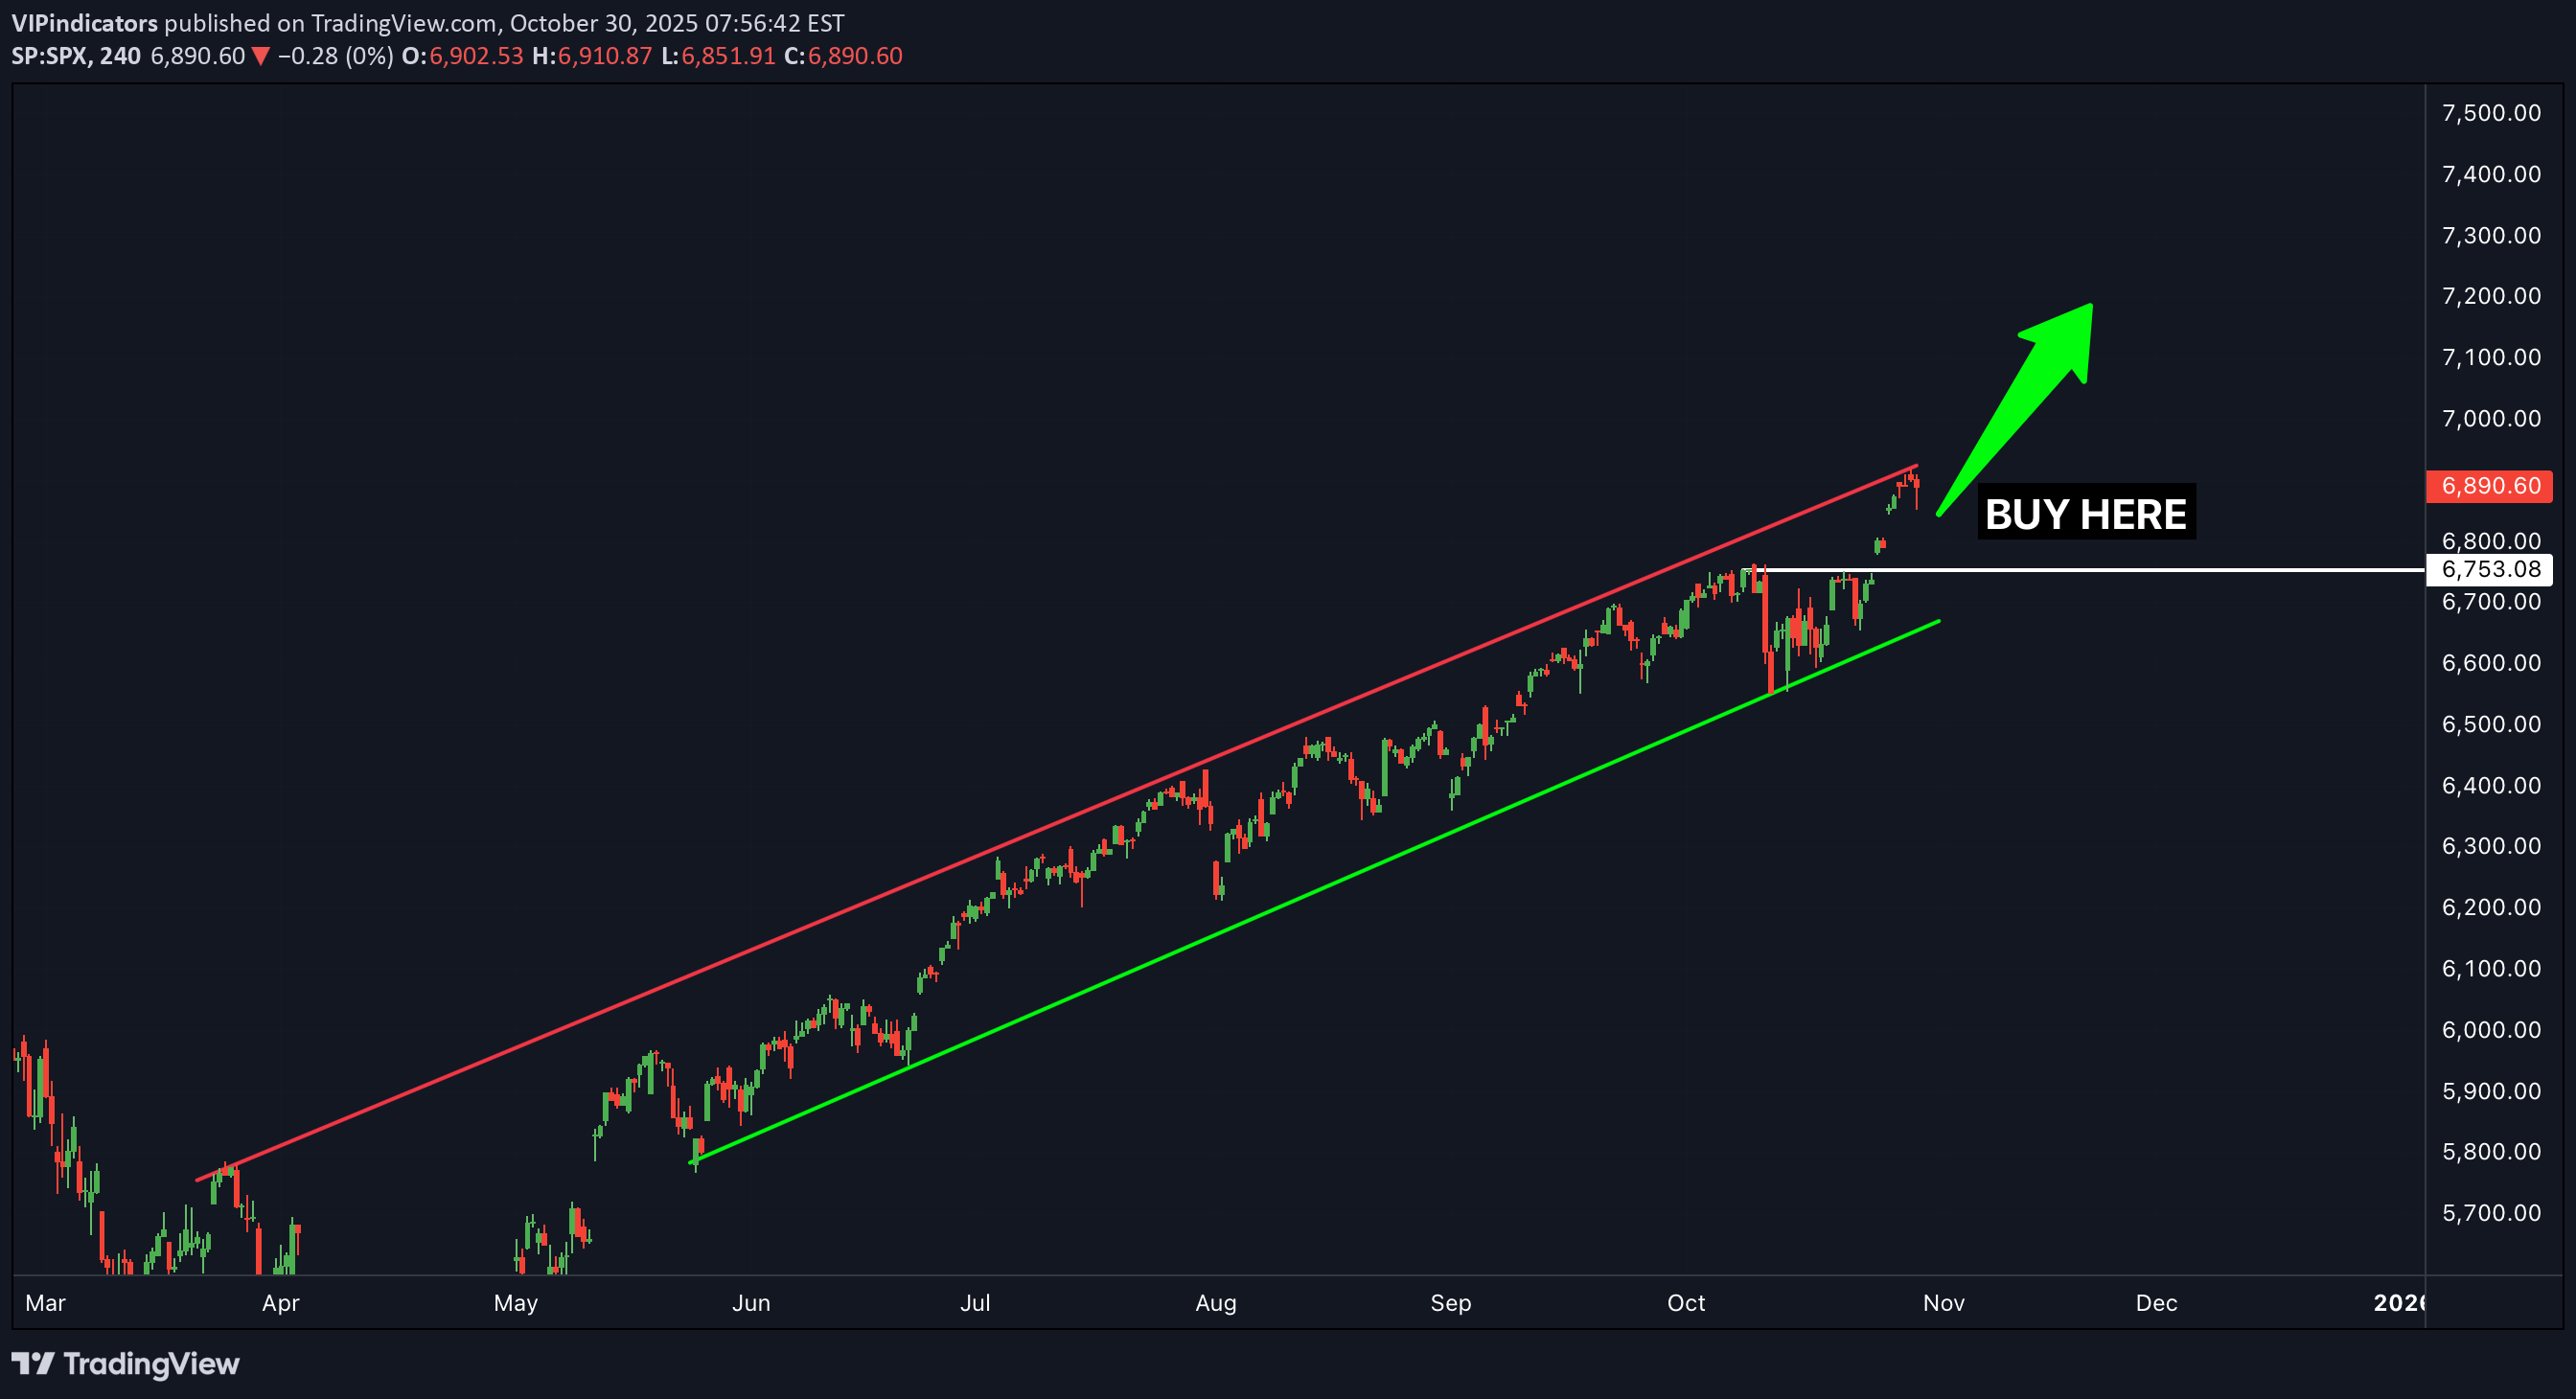
SPX برای چندین هفته در یک کانال صعودی گیر کرده است و بین هر دو سطح حمایت و مقاومت در حال چرخش بوده است. اخیراً از منطقه مقاومت قدرتمندی که آن را نگه داشته بود شکسته است ... که به این معنی است که اکنون بسیار احتمال دارد که به سمت صعود ادامه دهد.

NoFOMO_
آیا سقوط بزرگ در راه است؟ هشدار کاهش ۷ تا ۱۲ درصدی بازارها!
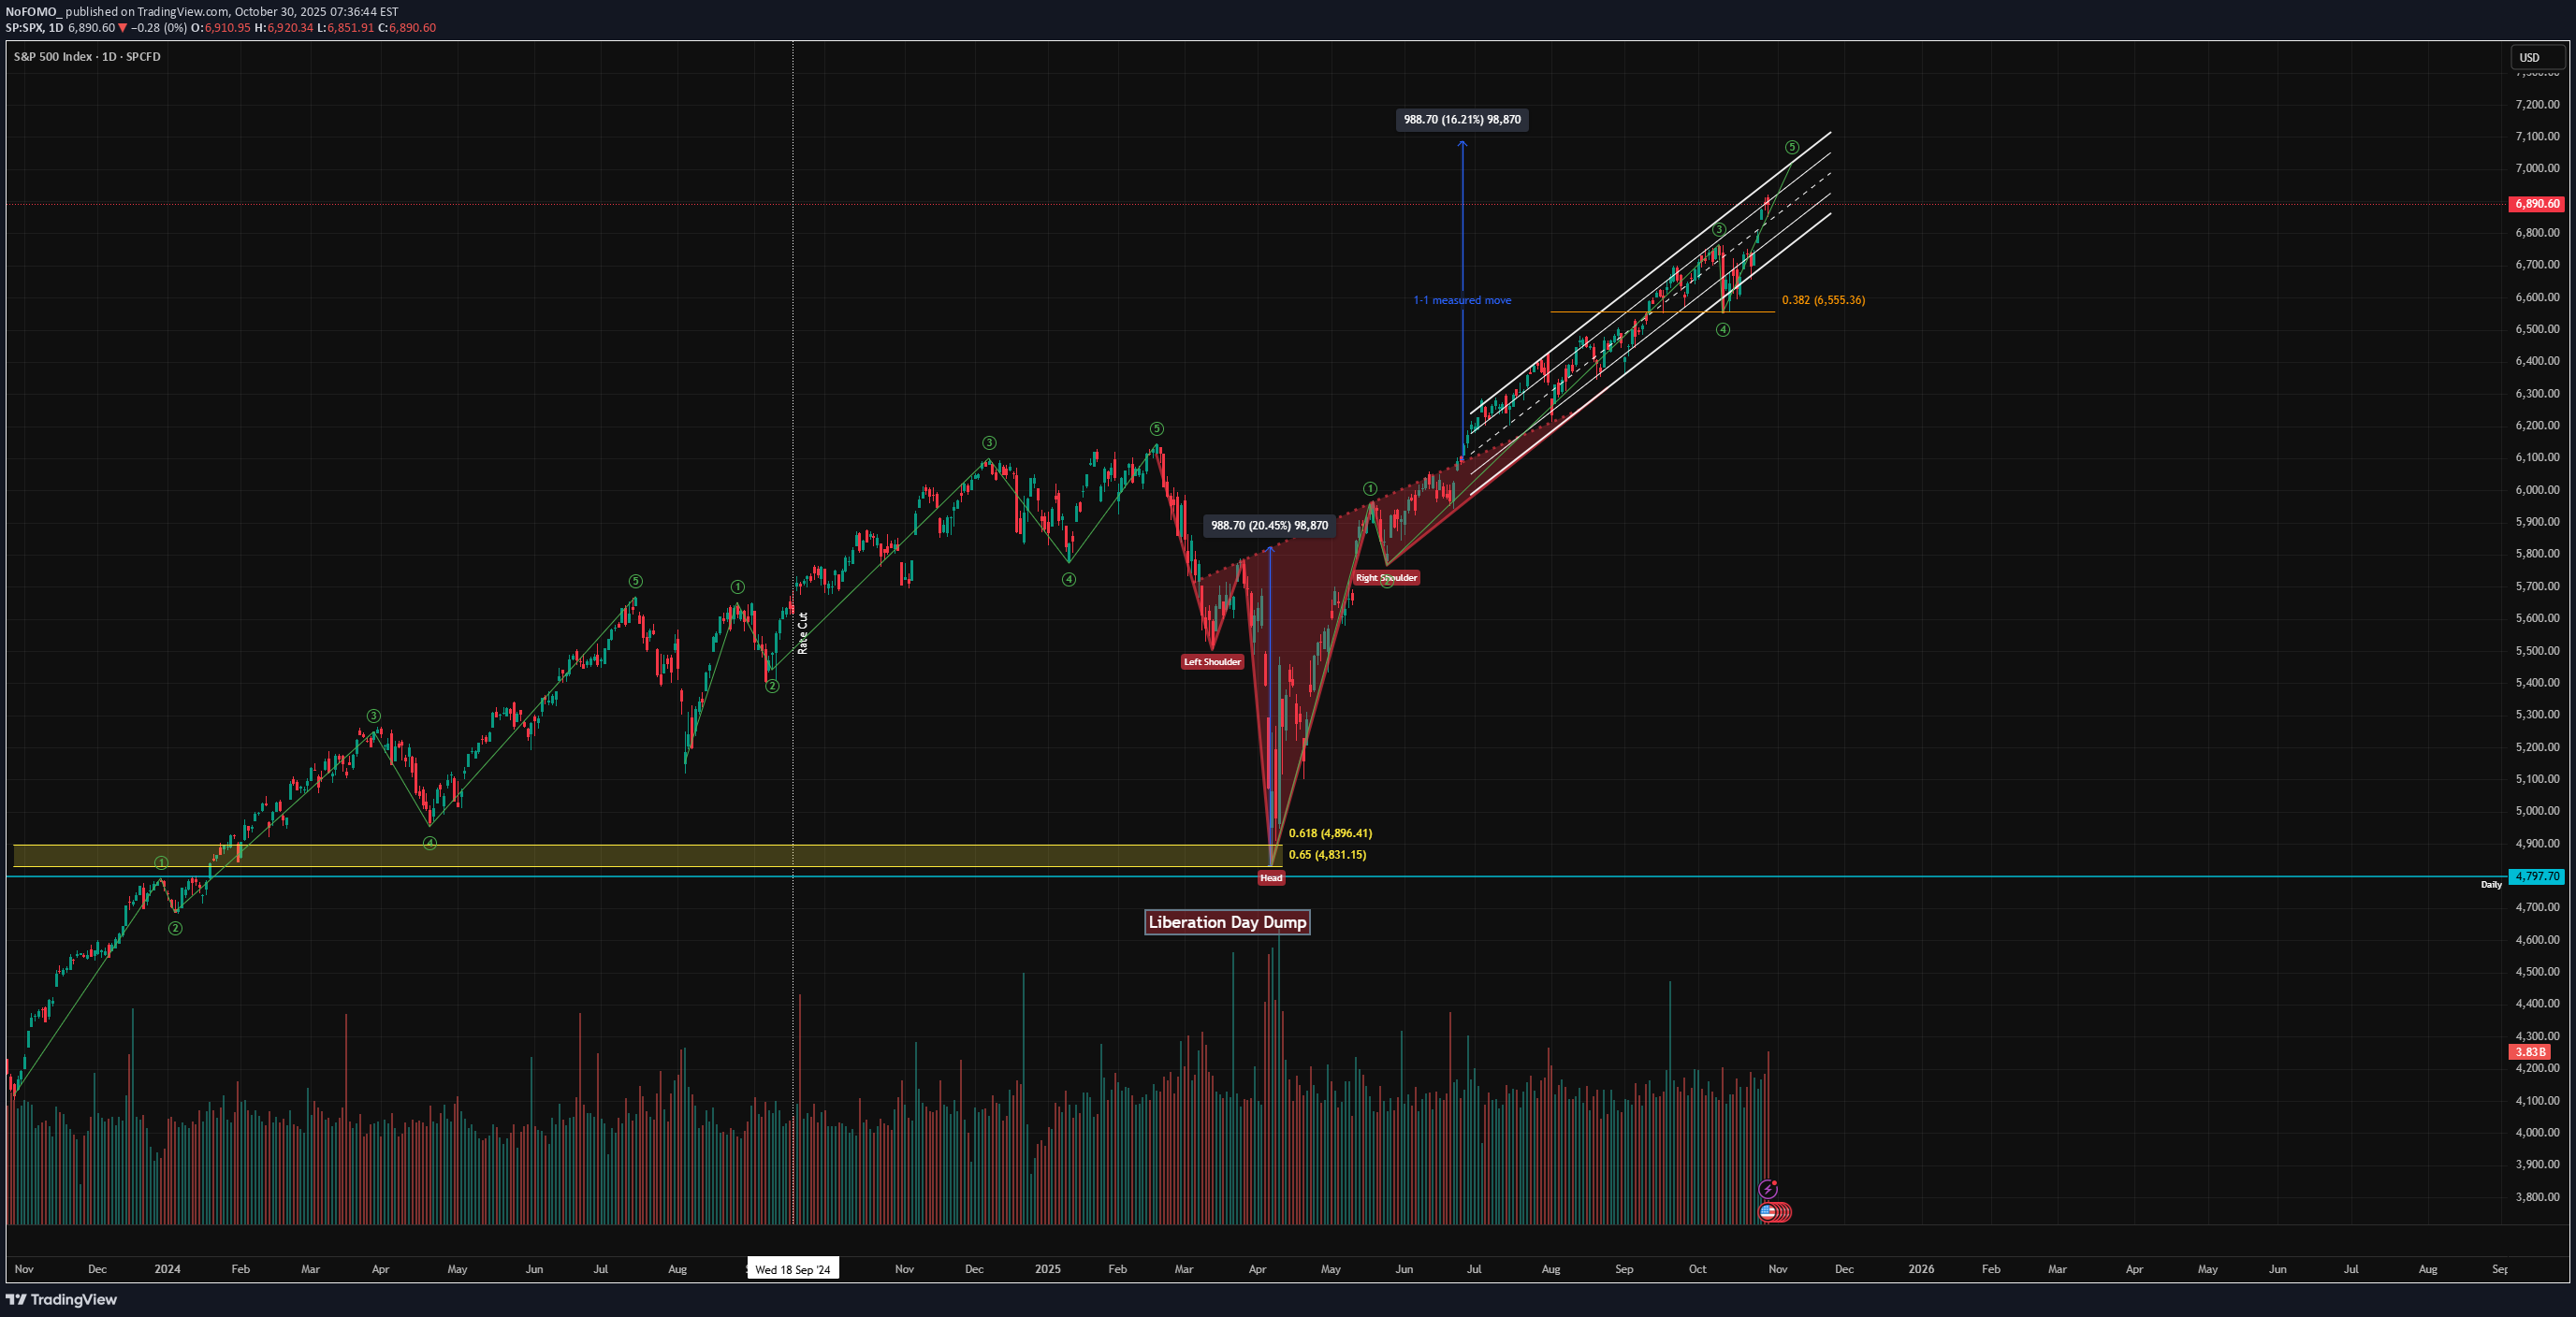
افزایش move از زمان تخلیه روز آزادی حماسی بوده است. من در آن زمان به بازارهای پایین زنگ زدم. من مدت زیادی AppLovin، AMD، Reddit، Arm، Alab، REMX، در میان بسیاری از نامهای دیگر بودم که بسیار بهتر از بازار بودند. من قبل از اینکه اتفاق بیفتد در مورد تخلیه قریب الوقوع به شما هشدار دادم و سپس با تسلیم بازار و رسیدن به نسبت طلایی، موضعی را در سمت طولانی اتخاذ کردم. اکنون وقت آن است که کوچکنمایی کنید و به شما یادآوری کنیم که این کار برای همیشه خراب شد. تفسیر من از نمودار این است که move به پایان نزدیک می شود، خطر سقوط قوی move (7-12٪ کاهش) به طور قابل توجهی در حال افزایش است و طمع بسیاری از افراد را جذب کرد. الگوی معکوس سر و شانه تقریبا کامل شده است، ما در این کانال در حال چرخش هستیم و در این روزها/هفته های آینده شروع به مقابله با مقاومت کرد. من هدف صعودی 7000-7250 داشتم و تقریباً به آن رسیده ایم. نزول ها در حال افزایش هستند، بنابراین گاوها ممکن است زمان بیشتری برای کسب سود داشته باشند، اما من متقاعد نشده ام که دستاوردها ارزش ریسک کردن را در این مرحله داشته باشند. من اینجا شروع به برداشتن چیپس از روی میز کرد. مشاوره مالی نیست، بهترین کار را برای شما انجام دهید.
julia17
هشدار فوری: الگوی خفاش و مگافون در US500 شکل گرفت؛ سقوط به ۶۲۴۰!
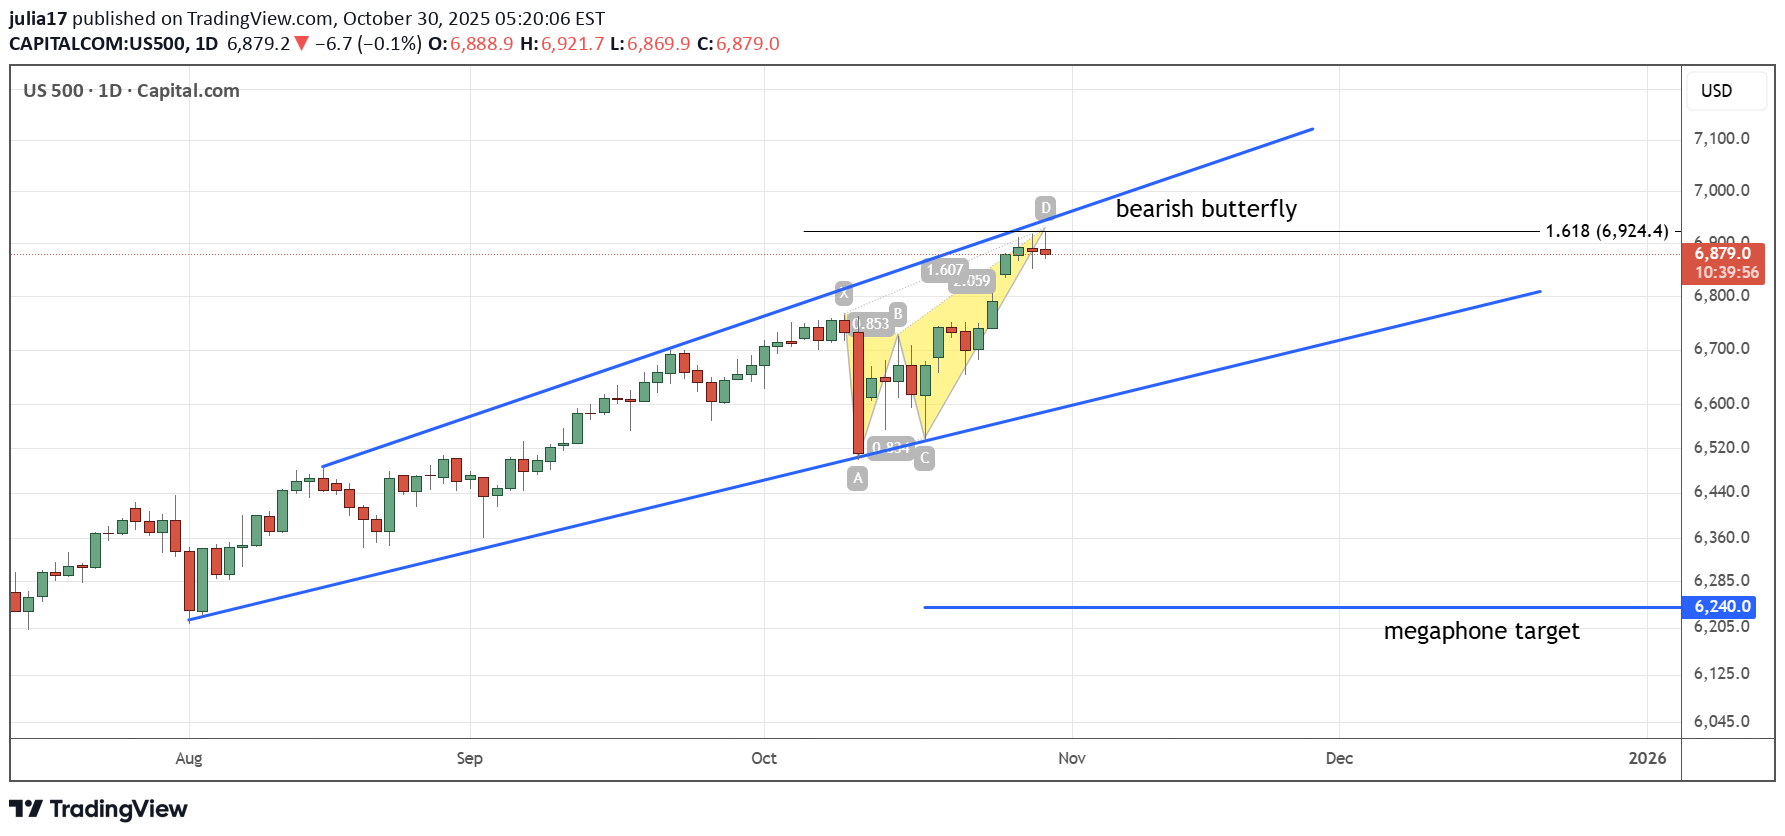
US500 الگوی برگشتی نزولی (شامل الگوی پروانه و الگوی مگافون) را با هدف ۶۲۴۰ تشکیل داده است.

ovvnyou
پیشبینی شوکهکننده بازار: آیا سقوط کریپتو در راه است؟
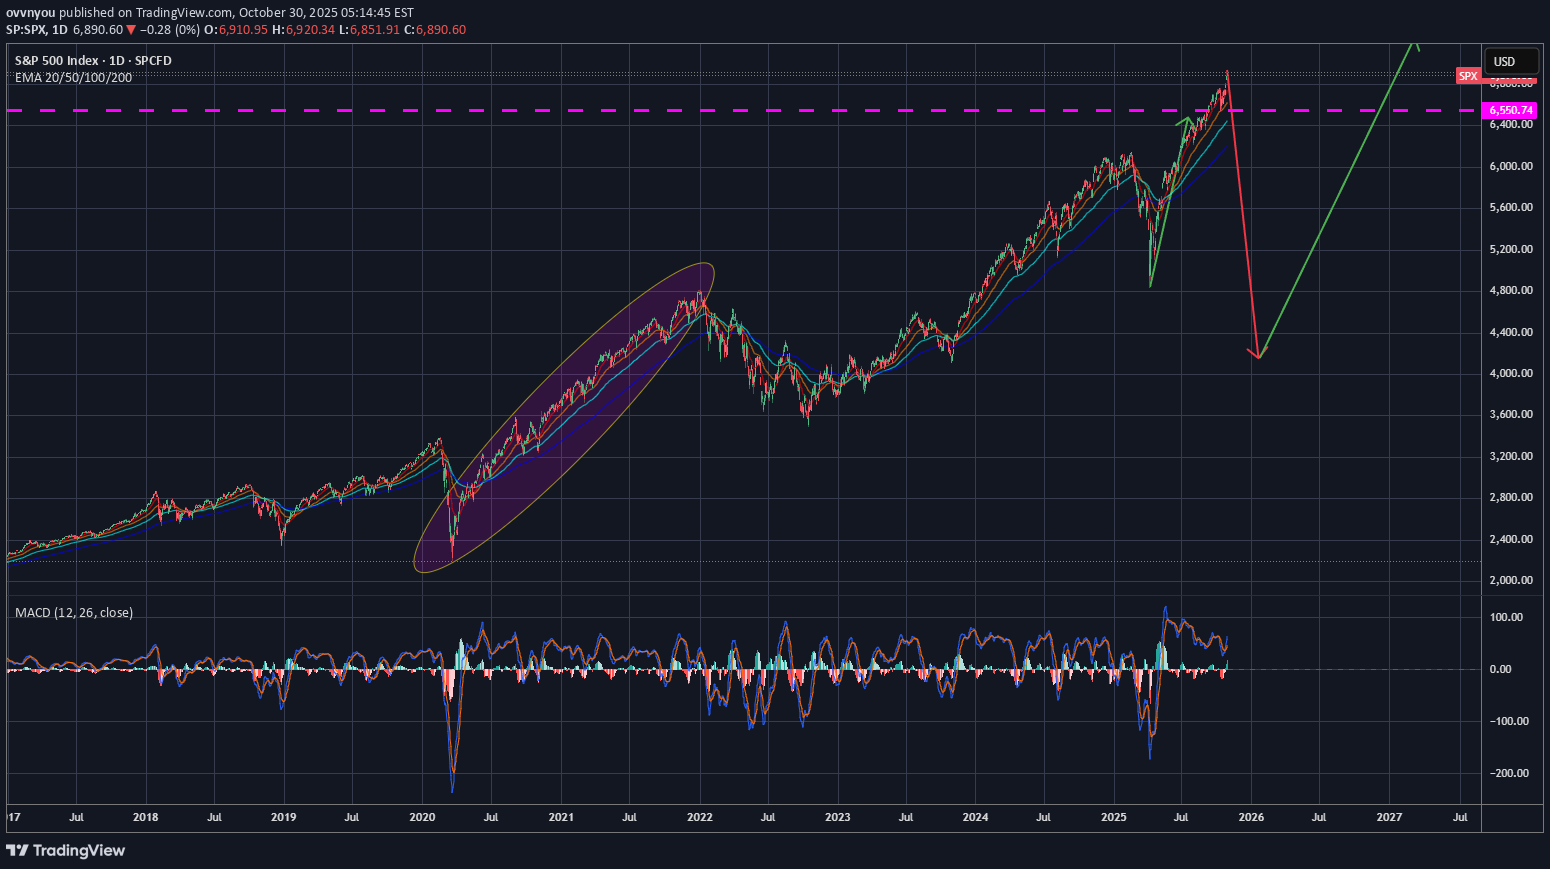
پیشبینیها را به زمانهای آتی منتقل کنید. سرد شدن (کاهش رونق) بازار جهانی پیشبینی میشود. ارزهای دیجیتال باید بیشترین و سریعترین آسیب را ببینند. اکثریت انتظار ادامه روند صعودی (رالی)، شبیه به دوران پس از کووید را دارند... به نظر من، این امر موجب غافلگیری شد.

caueblanes
تحلیل شاخص US500: فرصت خرید در سطح حمایت کلیدی!
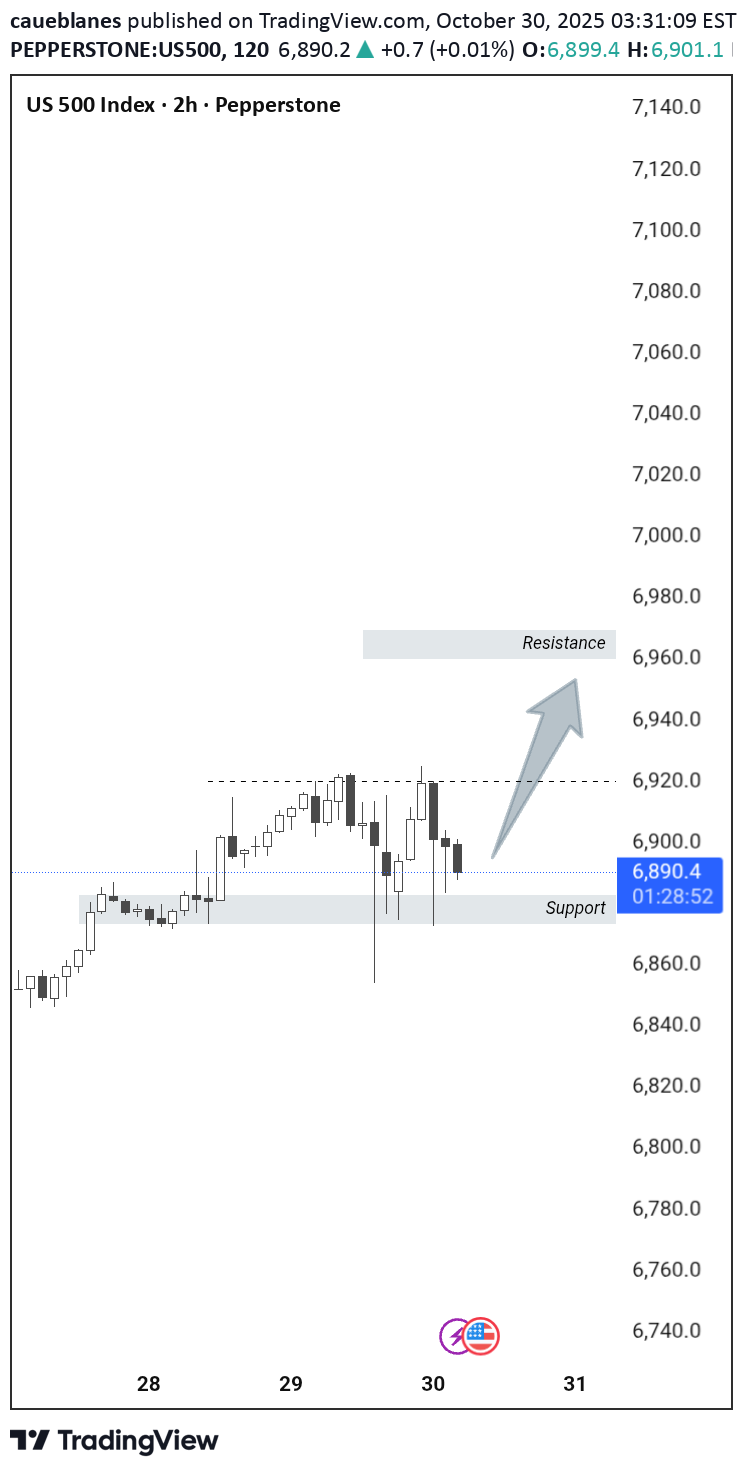
یواس۵۰۰ – فرصت در ناحیه حمایت. قیمت بین ۶,۸۸۰ و ۶,۹۲۰ در حال تحکیم است. ناحیه حمایت یک واکنش خرید نشان میدهد که میتواند شتاب جدیدی را به سمت مقاومت در ۶۹۶۰ ایجاد کند.
Swissquote
فدرال رزرو: آیا خوشبینی بازار سهام توجیه دارد یا پایان سرخوشی نزدیک است؟
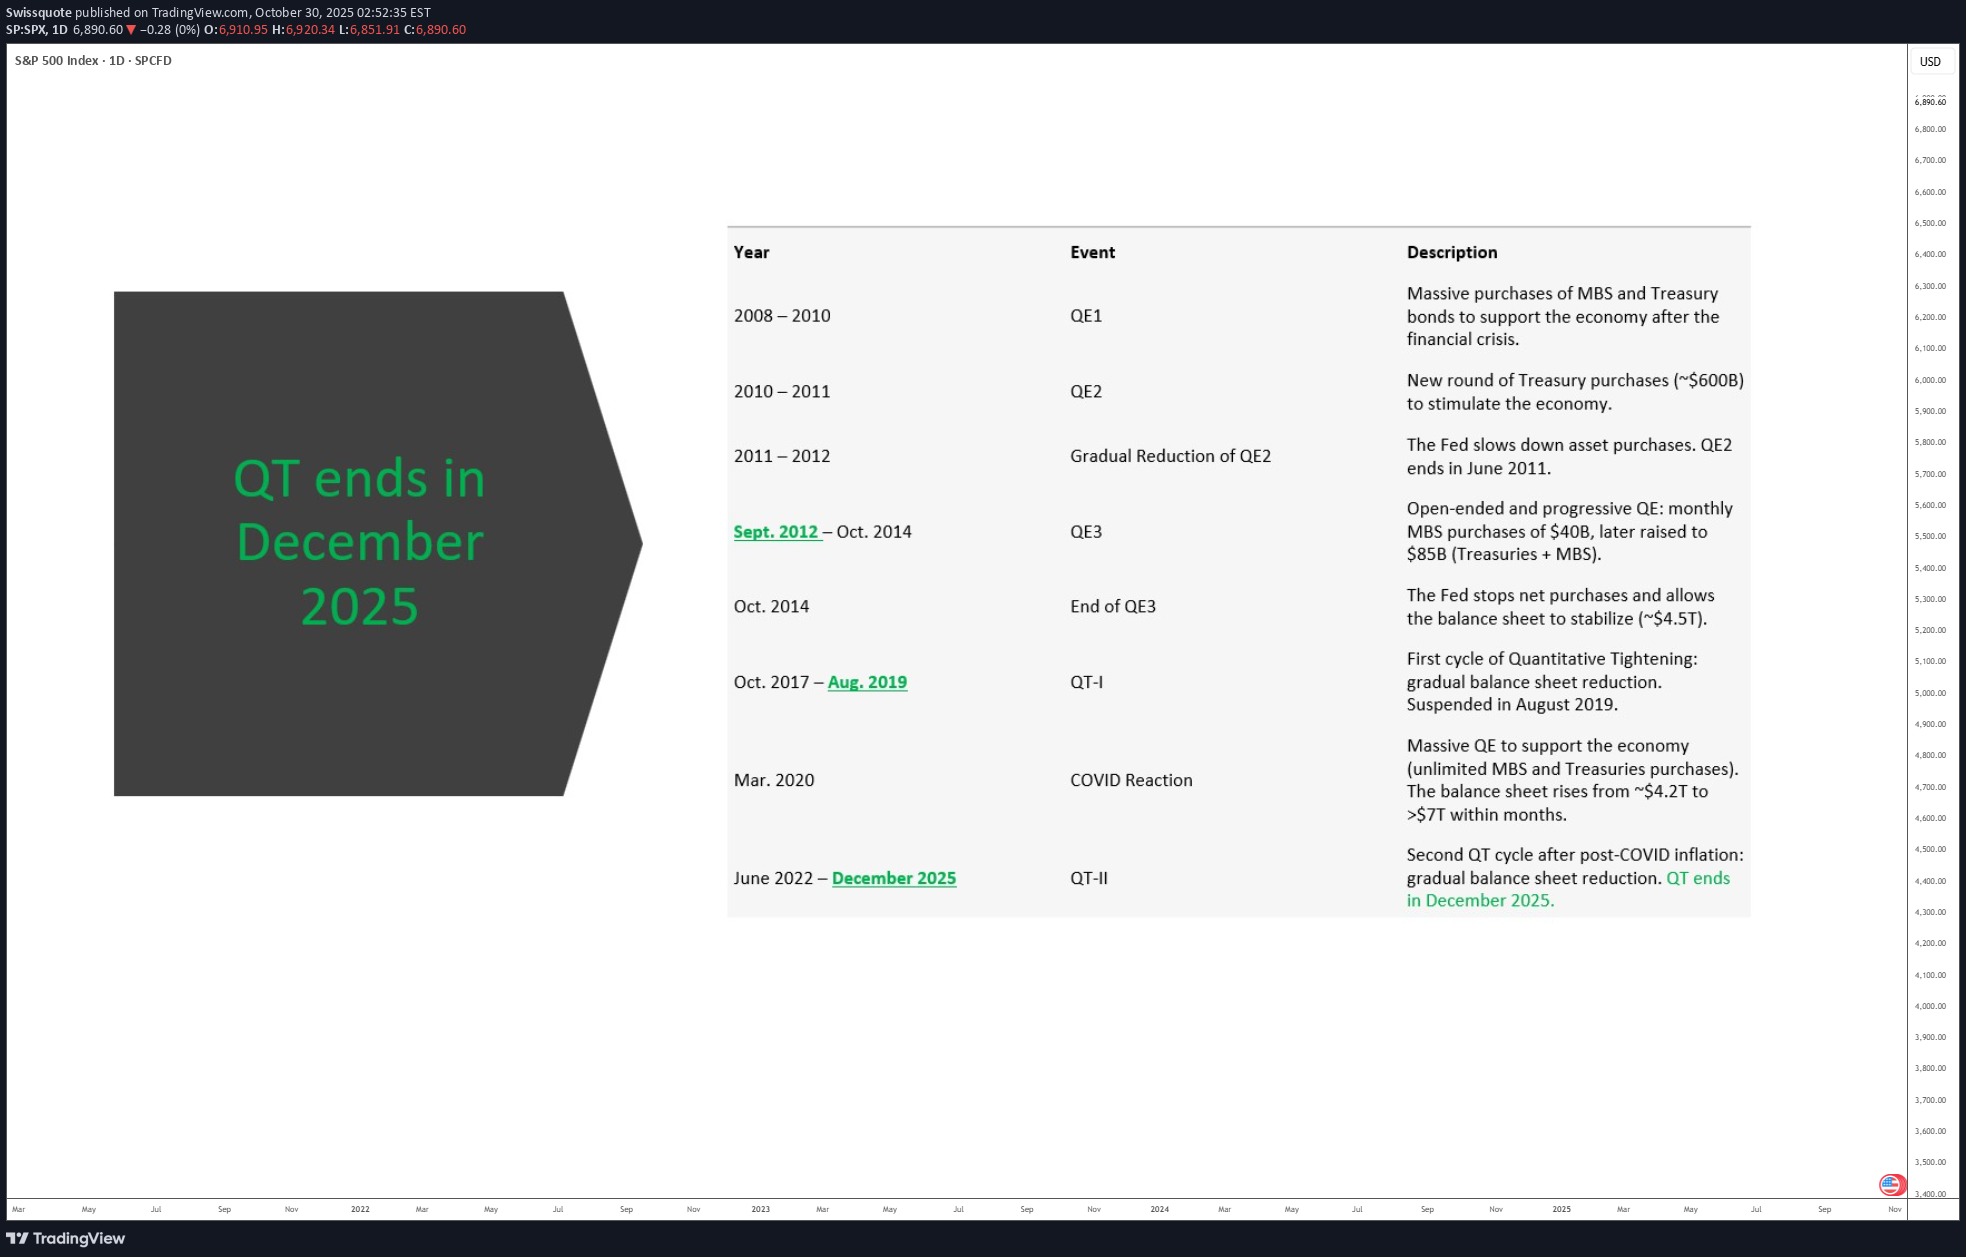
Driven by an euphoric phase, the S&P 500 has approached 7,000 points, nearing its 2000 valuation record, with six consecutive months of gains without retracement. The key question for investors is now clear: has the Federal Reserve provided enough justification for this confidence, or does Jerome Powell’s caution mark the beginning of the end of this euphoric phase? 1) A Fed slowing the pace without complacency On Wednesday, October 29, the Fed announced another 25-basis-point rate cut, bringing the federal funds rate into the 3.75%–4.00% range. This is the second consecutive reduction, aimed at countering the labor market slowdown. However, the FOMC vote revealed strong internal divisions: one member wanted a deeper cut, another preferred no change. This reflects the delicate balance between supporting employment and avoiding renewed inflationary pressure. Another key signal: the Fed decided to pause its balance sheet reduction (quantitative tightening) starting December 1st, in order to preserve financial system liquidity, as credit markets show early signs of stress. Powell clarified that this pause does not imply a lasting return to an expansionary stance. Finally, Powell cooled expectations for another rate cut in December, stating that “nothing is guaranteed.” Money markets now price roughly a 70% chance of a hold in December, down from nearly 90% odds of a cut before the meeting. 2) Between monetary realism and market excess The Fed is not ruling out further easing, but it refuses to fuel a bullish rally in the S&P 500 that is now considered excessive relative to fundamentals. Current valuations rely heavily on expectations of continued rate cuts. If that narrative weakens, the likelihood of a technical correction in the S&P 500 rises. At this stage, however, the index has not yet signaled a reversal. DISCLAIMER: This content is intended for individuals who are familiar with financial markets and instruments and is for information purposes only. The presented idea (including market commentary, market data and observations) is not a work product of any research department of Swissquote or its affiliates. This material is intended to highlight market action and does not constitute investment, legal or tax advice. If you are a retail investor or lack experience in trading complex financial products, it is advisable to seek professional advice from licensed advisor before making any financial decisions. This content is not intended to manipulate the market or encourage any specific financial behavior. Swissquote makes no representation or warranty as to the quality, completeness, accuracy, comprehensiveness or non-infringement of such content. The views expressed are those of the consultant and are provided for educational purposes only. Any information provided relating to a product or market should not be construed as recommending an investment strategy or transaction. Past performance is not a guarantee of future results. Swissquote and its employees and representatives shall in no event be held liable for any damages or losses arising directly or indirectly from decisions made on the basis of this content. The use of any third-party brands or trademarks is for information only and does not imply endorsement by Swissquote, or that the trademark owner has authorised Swissquote to promote its products or services. Swissquote is the marketing brand for the activities of Swissquote Bank Ltd (Switzerland) regulated by FINMA, Swissquote Capital Markets Limited regulated by CySEC (Cyprus), Swissquote Bank Europe SA (Luxembourg) regulated by the CSSF, Swissquote Ltd (UK) regulated by the FCA, Swissquote Financial Services (Malta) Ltd regulated by the Malta Financial Services Authority, Swissquote MEA Ltd. (UAE) regulated by the Dubai Financial Services Authority, Swissquote Pte Ltd (Singapore) regulated by the Monetary Authority of Singapore, Swissquote Asia Limited (Hong Kong) licensed by the Hong Kong Securities and Futures Commission (SFC) and Swissquote South Africa (Pty) Ltd supervised by the FSCA. Products and services of Swissquote are only intended for those permitted to receive them under local law. All investments carry a degree of risk. The risk of loss in trading or holding financial instruments can be substantial. The value of financial instruments, including but not limited to stocks, bonds, cryptocurrencies, and other assets, can fluctuate both upwards and downwards. There is a significant risk of financial loss when buying, selling, holding, staking, or investing in these instruments. SQBE makes no recommendations regarding any specific investment, transaction, or the use of any particular investment strategy. CFDs are complex instruments and come with a high risk of losing money rapidly due to leverage. The vast majority of retail client accounts suffer capital losses when trading in CFDs. You should consider whether you understand how CFDs work and whether you can afford to take the high risk of losing your money. Digital Assets are unregulated in most countries and consumer protection rules may not apply. As highly volatile speculative investments, Digital Assets are not suitable for investors without a high-risk tolerance. Make sure you understand each Digital Asset before you trade. Cryptocurrencies are not considered legal tender in some jurisdictions and are subject to regulatory uncertainties. The use of Internet-based systems can involve high risks, including, but not limited to, fraud, cyber-attacks, network and communication failures, as well as identity theft and phishing attacks related to crypto-assets.
سلب مسئولیت
هر محتوا و مطالب مندرج در سایت و کانالهای رسمی ارتباطی سهمتو، جمعبندی نظرات و تحلیلهای شخصی و غیر تعهد آور بوده و هیچگونه توصیهای مبنی بر خرید، فروش، ورود و یا خروج از بازارهای مالی نمی باشد. همچنین کلیه اخبار و تحلیلهای مندرج در سایت و کانالها، صرفا بازنشر اطلاعات از منابع رسمی و غیر رسمی داخلی و خارجی است و بدیهی است استفاده کنندگان محتوای مذکور، مسئول پیگیری و حصول اطمینان از اصالت و درستی مطالب هستند. از این رو ضمن سلب مسئولیت اعلام میدارد مسئولیت هرنوع تصمیم گیری و اقدام و سود و زیان احتمالی در بازار سرمایه و ارز دیجیتال، با شخص معامله گر است.