
tradecitypro
@t_tradecitypro

ما هو الشيء الذي ننصحك بشراءه من المواد الغذائية؟
سابق في الشراء
پیام های تریدر
مرشح
tradecitypro
تحلیل STX: مقاومت کلیدی کجاست؟ خرسها در کنترل قیمت!
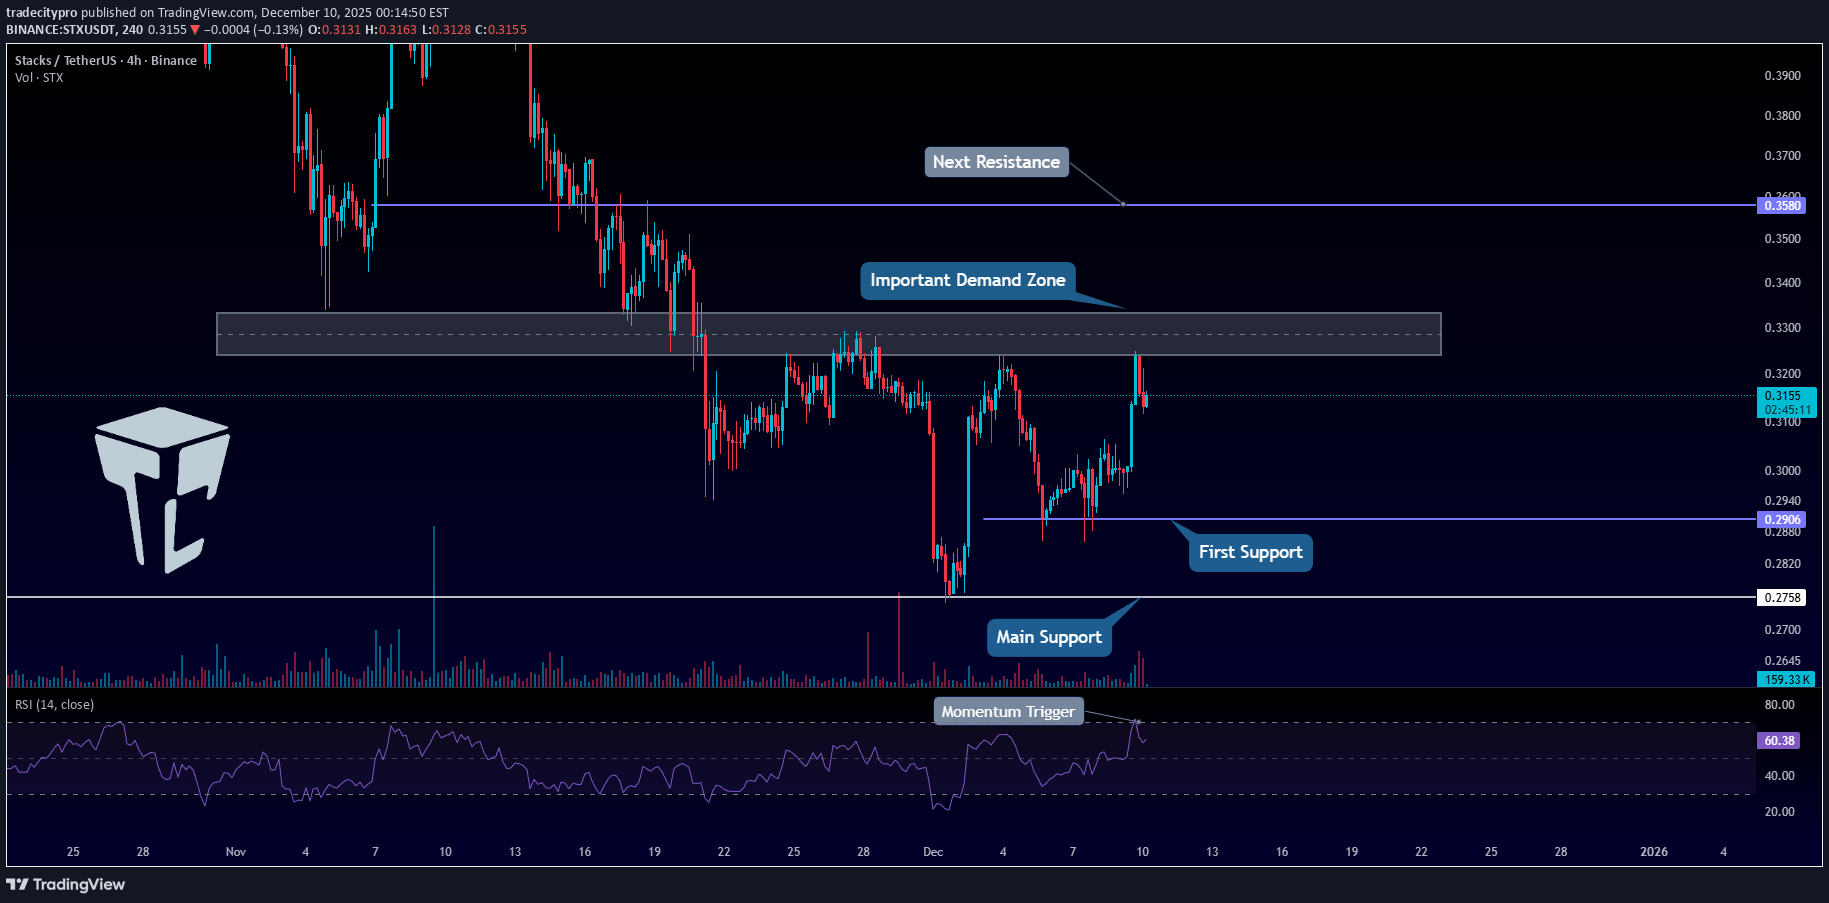
👋 مرحبًا بک فی TradeCity Pro! فی هذا التحلیل، أرید مراجعة STX، أحد مشاریع النظام البیئی Bitcoin، والذی یحتل حالیًا المرتبة 87 على CoinMarketCap بقیمة سوقیة تبلغ 573 ملیون دولار. ⏳ الإطار الزمنی 4 ساعات کما ترون، على الإطار الزمنی 4 ساعات، یتعامل STX مع منطقة مقاومة لامسها عدة مرات من قبل، والآن وصل إلى هذه المنطقة مرة أخرى. ✔️ بعد الوصول إلى هذا المستوى، تزاید حجم الشموع red الرافضة من هذه المنطقة، مما یدل على ضعف المشترین وقوة البائعین عند هذا المستوى. 📊 إذا استمرت أحجام البیع فی الارتفاع، فمن المحتمل أن یتحرک السعر نحو مناطق الدعم 0.2906 و 0.2758. 💡 لذا، یمکننا فتح صفقة بیع إما بعد کسر الهیکل فی أطر زمنیة أقل أو عن طریق کسر هاتین المنطقتین 0.2906 و 0.2758. 💥 بالنسبة لصفقة طویلة، سیکون کسر النطاق هو أول محفز طویل وأول تأکید لتحول العملة إلى الاتجاه الصعودی. 🎲 مناطق المقاومة المهمة التالیة هی 0.3580 و 0.4359، وکسر هذه المستویات سیعطینا التأکیدات الرئیسیة للاتجاه الصاعد. 🎯 من ناحیة أخرى، إذا دخل مؤشر القوة النسبیة منطقة التشبع فی الشراء، فیمکننا تأکید دخول الزخم الصعودی إلى السوق، مما یزید من احتمالیة کسر منطقة المقاومة. 📝 الخواطر النهائیة حافظ على هدوئک، وتداول بحکمة، ودعنا نغتنم أفضل الفرص المتاحة فی السوق! یعکس هذا التحلیل آرائنا ولیس نصیحة مالیة. شارک أفکارک فی التعلیقات، ولا تنس مشارکة هذا التحلیل مع أصدقائک! ❤️
tradecitypro
TradeCityPro | Bitcoin Daily Analysis #245
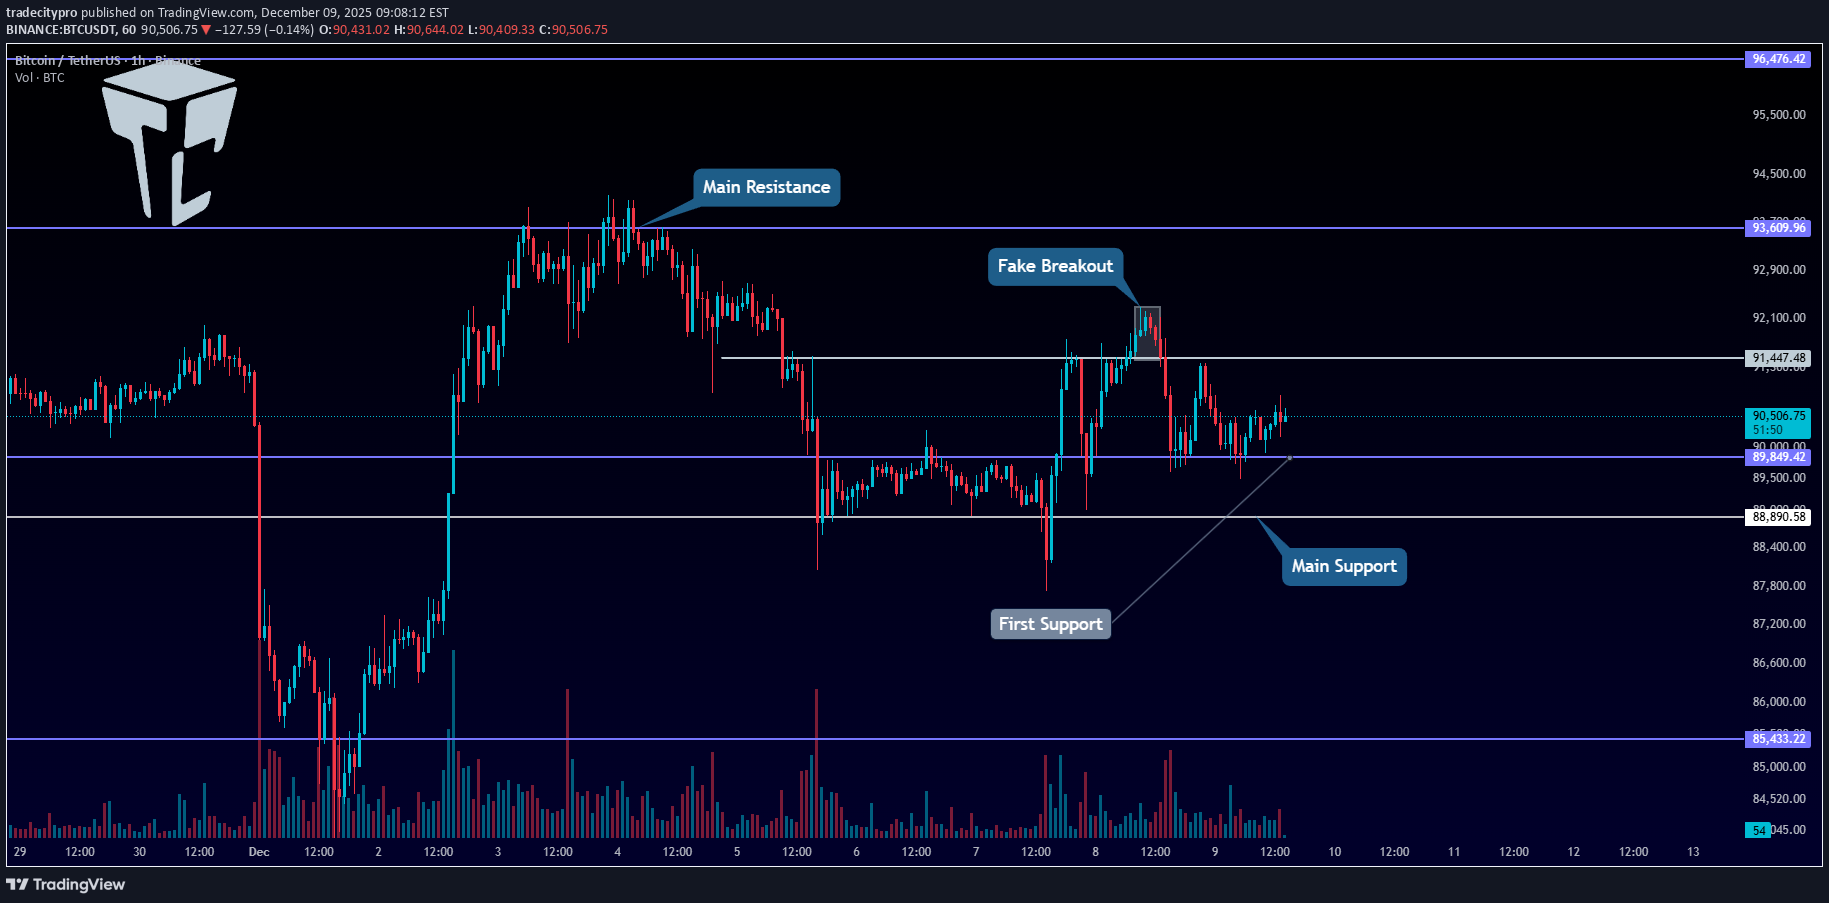
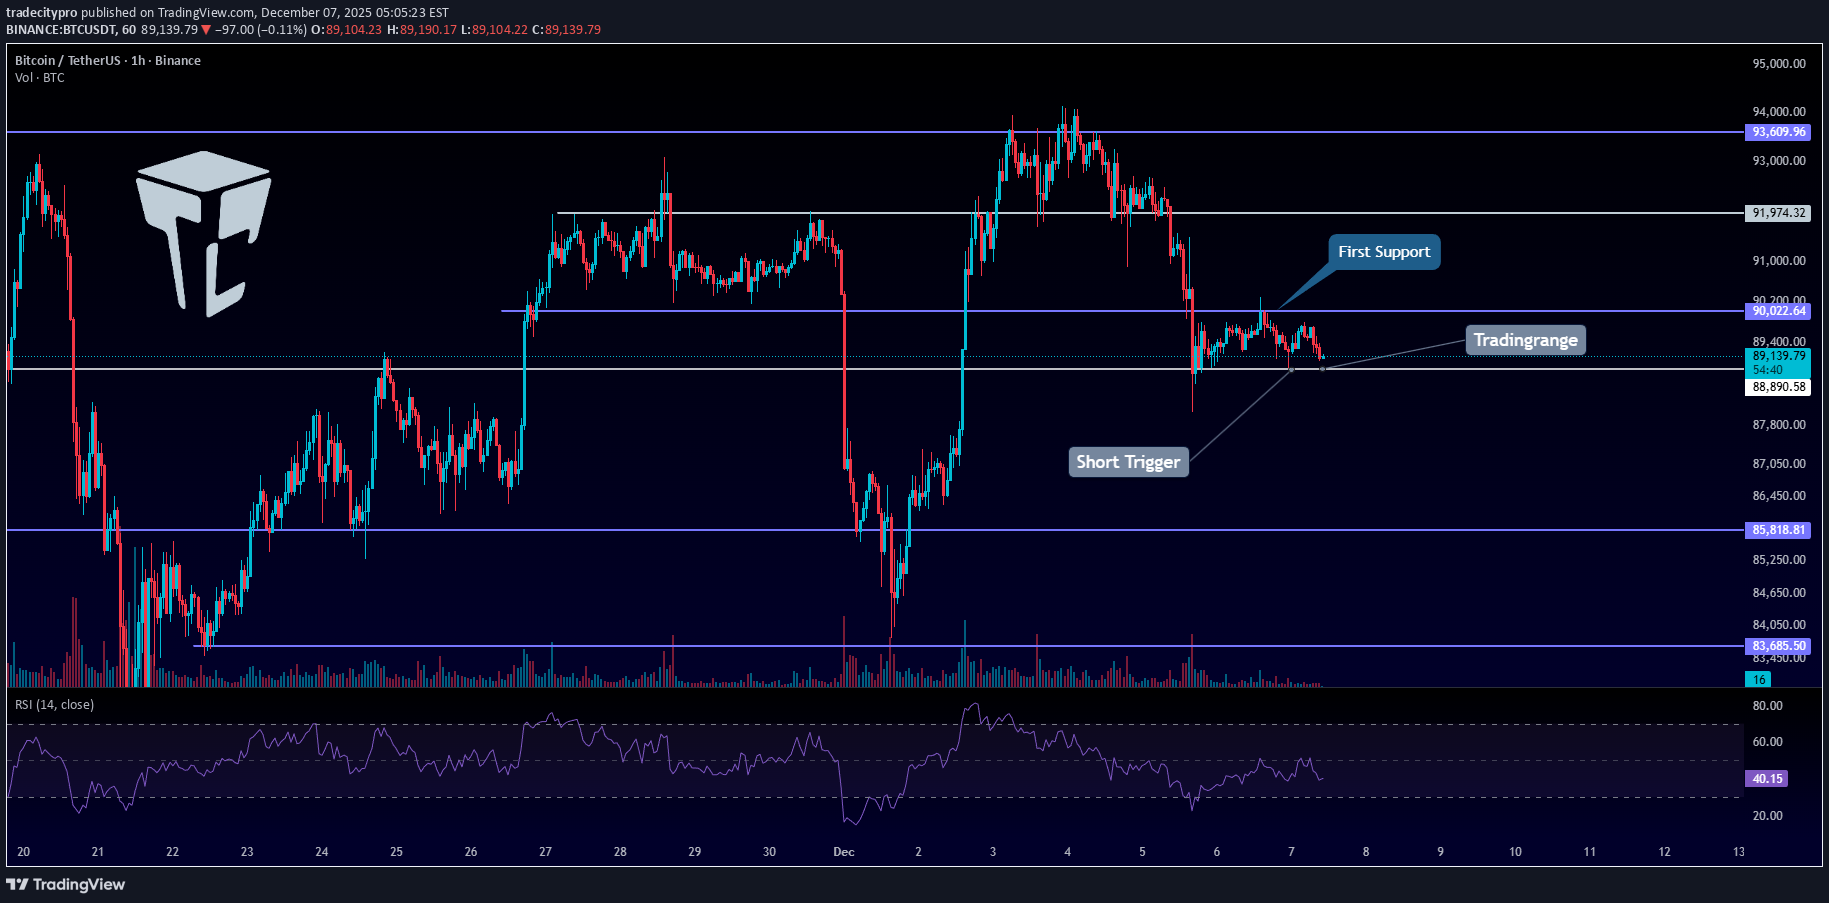
👋 مرحبًا بک فی TradeCity Pro! دعنا move ننتقل إلى التحلیل Bitcoin. بعد move المزیف الذی کان لدینا بالأمس، دخل الیوم Bitcoin إلى مربع النطاق. ⏳ إطار زمنی مدته ساعة واحدة بالأمس فی Bitcoin کان لدینا زناد عند منطقة 91447 یمکننا استخدامه کزناد طویل. 🎯 قبل ذلک، کان لدینا أیضًا مشغل على Bitcoin عند 89849 والذی تم تفعیله، ومع کسر 91447 تم تنشیط المشغل الثانی أیضًا. 🎲 بعد تنشیط هذا المشغل، نظرًا لضعف الاتجاه الذی کان لدینا على Bitcoin، لم یتمکن السعر من الاستقرار فوق 91447، ومع تزییف ذلک move، انخفض مرة أخرى إلى 89849. ⛏ منطقة 89849 هی منطقة دعم مهمة للبیتکوین، والدعم التالی لدینا عند Bitcoin هو 88890. ✔️ مع الأخذ فی الاعتبار أن Bitcoin قام بتزییف کلا من القاع 89849 والقمة 91447 مرة واحدة، یمکننا القول حالیًا أنه لا یوجد اتجاه محدد فی السوق، ویمکننا فتح مراکز بیع وشراء. 📊 بالنسبة لصفقة طویلة، یمکننا مرة أخرى الدخول بکسر 91447 وفتح مرکزنا. ✔️ فی حالة انخفاض السوق، لدینا محفزان قصیران: الأول هو 89849 والثانی هو 88890، وبکسر أی منهما یمکن أن نحصل على الزناد لفترة قصیرة. ❌ تنویه ❌ تداول العقود الآجلة أمر محفوف بالمخاطر وخطیر للغایة. إذا لم تکن خبیرًا، فقد لا تکون هذه المحفزات مناسبة لک. یجب علیک أولاً أن تتعلم إدارة المخاطر ورأس المال. یمکنک أیضًا استخدام المحتوى التعلیمی من هذه القناة. أخیرًا، تعکس هذه المحفزات آرائی الشخصیة حول حرکة السعر، وقد یعارض السوق هذا التحلیل تمامًا. لذلک، قم بإجراء البحث الخاص بک قبل فتح أی منصب.
tradecitypro
TradeCityPro | GRT Testing Key Support in Wide Range Structure
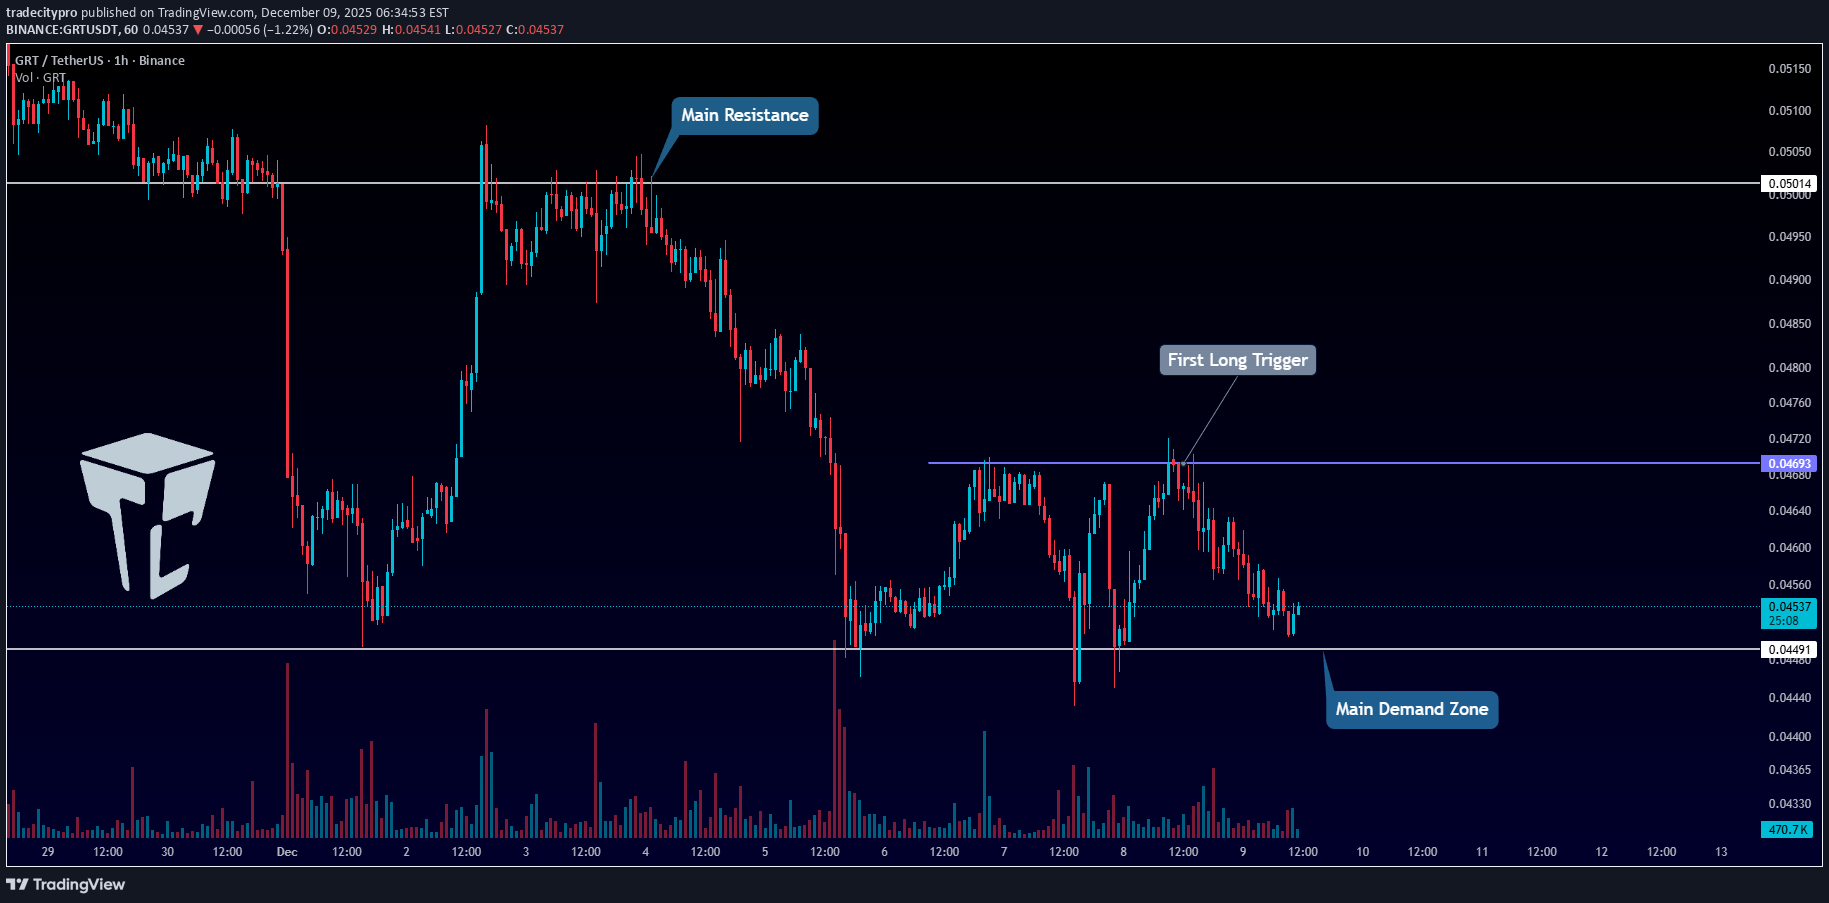
👋 مرحبًا بک فی TradeCity Pro! فی هذا التحلیل أرید مراجعة العملة GRT لک. أحد مشاریع النظام البیئی DeFi وSolana الذی تبلغ قیمته السوقیة 481 ملیون دولار یحتل المرتبة 95 على CoinMarketCap. ⏳ إطار زمنی مدته ساعة واحدة فی الإطار الزمنی لمدة ساعة واحدة، تم تشکیل مربع نطاق بین المنطقتین 0.04491 و0.4693، وکان السعر یتقلب بین هاتین المنطقتین لعدة أیام. 💥تمثل المنطقة 0.04491 دعمًا مهمًا جدًا لهذه العملة، وکسرها أو الدعم منها یمکن أن یبدأ الموجة movement التالیة على GRT. 🎯 نظرًا لأنه فی الأطر الزمنیة الأعلى مثل الیومیة والأسبوعیة یکون اتجاهه هبوطیًا، فمع کسر 0.04491 یمکن أن یستمر هذا الاتجاه ویمکننا فتح مرکز بیع معه. ⚡️ إذا تم دعم السعر من هذه المنطقة وتحرک نحو القمة 0.4693 فیمکننا فتح صفقة شراء بکسر 0.4693. ⚖️ هذا الزناد هو الزناد الأول لفترة طویلة ویعتبر زنادا محفوفا بالمخاطر. أفضل الانتظار للحصول على المزید من التأکیدات على تحول هذه العملة إلى الاتجاه الصعودی. 📊 فی الوقت الحالی، سیکون المحفز الرئیسی لـ GRT للتحول الصعودی هو کسر مستوى المقاومة الرئیسی عند 0.05014. ❌ تنویه ❌ تداول العقود الآجلة أمر محفوف بالمخاطر وخطیر للغایة. إذا لم تکن خبیرًا، فقد لا تکون هذه المحفزات مناسبة لک. یجب علیک أولاً أن تتعلم إدارة المخاطر ورأس المال. یمکنک أیضًا استخدام المحتوى التعلیمی من هذه القناة. أخیرًا، تعکس هذه المحفزات آرائی الشخصیة حول حرکة السعر، وقد یعارض السوق هذا التحلیل تمامًا. لذلک، قم بإجراء البحث الخاص بک قبل فتح أی منصب.
tradecitypro
TradeCityPro | Bitcoin Daily Analysis #244
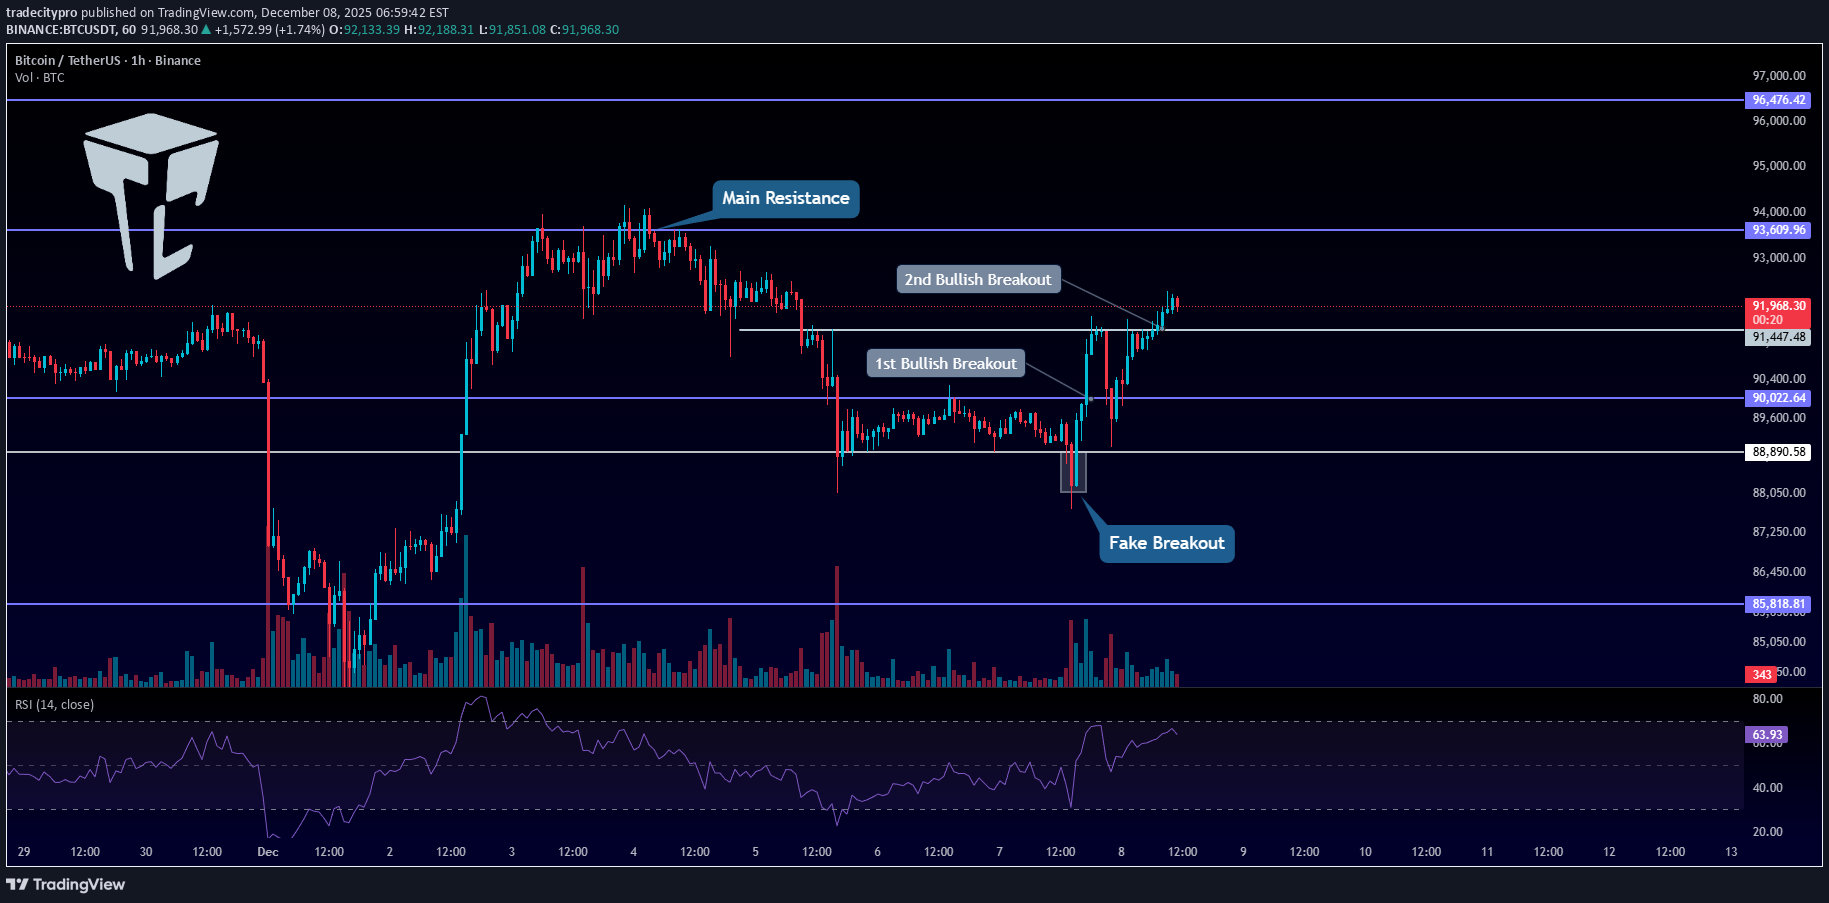
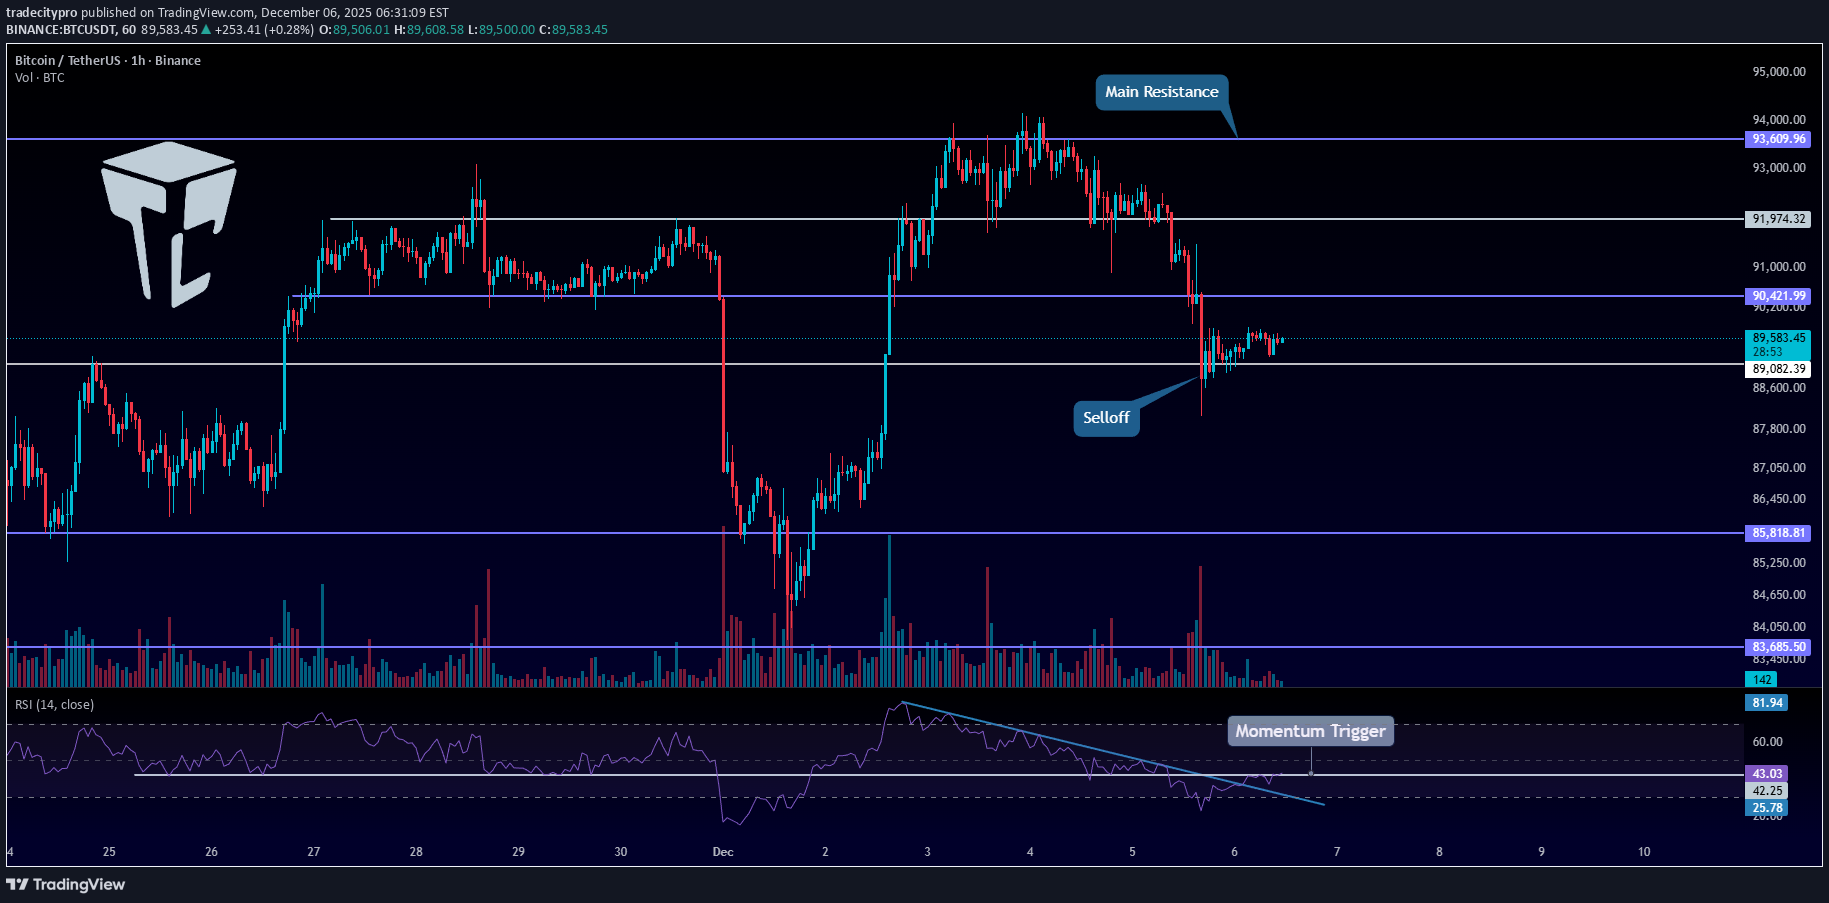
👋 مرحبًا بک فی TradeCity Pro! دعنا move ننتقل إلى Bitcoin التحلیل؛ مع بدایة الأسبوع الجدید، اتخذ السوق اتجاهًا جدیدًا. ⏳ إطار زمنی مدته ساعة واحدة بالأمس، بالنسبة للبیتکوین، کان لدینا مستویین مهمین للغایة کان السعر یتذبذب بینهما. ⭐ منطقة المقاومة 90022 والدعم 88890 هی المناطق التی یمکن أن یمنحنا فیها کسر أی منهما مرکزًا. 💥 أول مرکز تمکنا من فتحه بالأمس کان مرکز بیع، والذی بعد کسر 88890 حقق مستوى move حادًا سیصل إلى هدفنا أیضًا، ولکن بعد ذلک بدأ السعر فی حرکة صعودیة، وبعد أن تحول الاتجاه الهبوطی السابق move إلى اختراق وهمی، دخل فیه الکثیر من الزخم الصعودی. 💧 بعد هذه الحرکة، تم تنشیط الزناد 90022 أیضًا، وانتقل Bitcoin للأعلى إلى منطقة 91447. 🧩 بشکل عام، أمس کان یومًا متقلبًا للغایة، لأنه بعد الوصول إلى 91447، صحح Bitcoin إلى ما یقرب من 88890، ثم صعد مرة أخرى. 🎲 لکن الیوم Bitcoin کان یعانی من منطقة 91447، والتی تمکن من کسرها حتى الآن، ومع قلیل من الزخم والانحدار الطفیف، یتحرک نحو الأعلى. ⚡️ یمکننا أن نرى ضعف هذا الاتجاه داخل مؤشر القوة النسبیة؛ یُظهر شکل الشموع أیضًا الکثیر من الضعف فی الاتجاه، لکن الحجم لا یزال لا یحتوی على انحراف قوی مع الاتجاه الصعودی. ✔️ إذا استمر هذا الضعف فإن احتمالیة الکسر الوهمی لمستوى 91447 وبدء اتجاه هابط جدید move تزید کثیراً. 🔔 ولکن إذا حافظ Bitcoin على زخمه واستمر move، فإن المنطقة التالیة التی یمکن أن یتفاعل معها السعر ستکون 93609. ❌ تنویه ❌ تداول العقود الآجلة أمر محفوف بالمخاطر وخطیر للغایة. إذا لم تکن خبیرًا، فقد لا تکون هذه المحفزات مناسبة لک. یجب علیک أولاً أن تتعلم إدارة المخاطر ورأس المال. یمکنک أیضًا استخدام المحتوى التعلیمی من هذه القناة. أخیرًا، تعکس هذه المحفزات آرائی الشخصیة حول حرکة السعر، وقد یعارض السوق هذا التحلیل تمامًا. لذلک، قم بإجراء البحث الخاص بک قبل فتح أی منصب.
tradecitypro
TradeCityPro | XRP Compressing at Key Support Ahead of Breakout
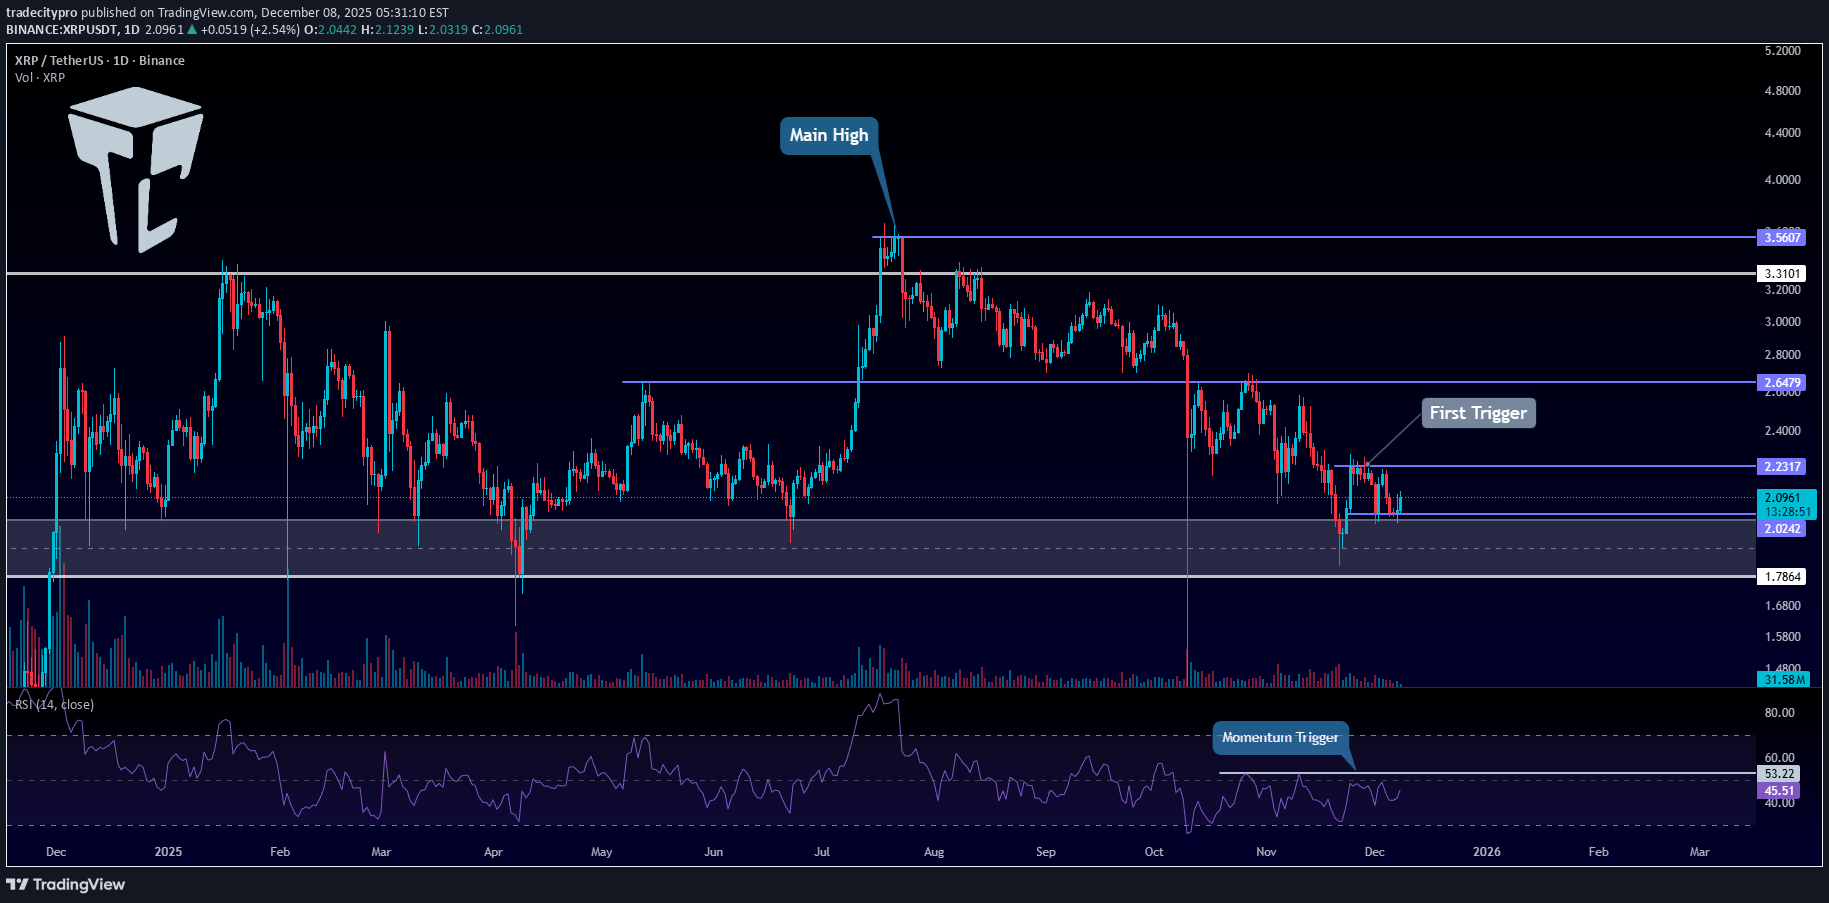
👋 مرحبًا بک فی TradeCity Pro! فی هذا التحلیل، أرید مراجعة عملة XRP، وهی واحدة من أقدم العملات المشفرة، والتی تحتل حالیًا المرتبة الرابعة على CoinMarketCap بقیمة سوقیة تبلغ 127 ملیار دولار. 🗓 الإطار الزمنی الیومی على الإطار الزمنی الیومی، یقع XRP فی منطقة دعم مهمة جدًا ودخل فی مرحلة الضغط (الضغط) خلال الأیام القلیلة الماضیة. ⭐القاع من هذا الضغط هو 2.0242، والأعلى هو 2.2317. ✔️ إذا انکسر هذا الضغط على أی من الجانبین، فیمکن أن یبدأ السعر موجة دافعة جدیدة. 🎯 لذا، إذا تم کسر 2.0242 أو 2.2317، فیمکننا فتح مرکز. 🎲ولکن هناک نقطة مهمة: کسر 2.0242 هو مجرد حافز أول لدخول منطقة الدعم major. ⚡️ کسر هذا الدعم لن یکون سهلاً، فقد حاول السعر کسره عدة مرات وفشل. 💥 ولهذا السبب، فإن الدخول البیعی الأکثر أمانًا سیکون انتظار کسر أرضیة الدعم عند 1.7864. ↗️ بالنسبة لصفقة شراء، إذا تم اختراق منطقة 2.2317 بحجم متزاید قوی، یمکننا الدخول فی صفقة شراء. ⚖️ لکی یتحول XRP إلى الاتجاه الصعودی، من المهم جدًا أن یستقر مؤشر القوة النسبیة فوق 53.22. 💡 سیکون الاختراق فوق مستوى مؤشر القوة النسبیة هذا هو أول تأکید للزخم لانعکاس الاتجاه الصعودی. 📝 الخواطر النهائیة حافظ على هدوئک، وتداول بحکمة، ودعنا نغتنم أفضل الفرص المتاحة فی السوق! یعکس هذا التحلیل آرائنا ولیس نصیحة مالیة. شارک أفکارک فی التعلیقات، ولا تنس مشارکة هذا التحلیل مع أصدقائک! ❤️
tradecitypro
تحلیل بیت کوین امروز: آیا منتظر انفجار قیمتی در آخر هفته هستیم؟
👋 مرحبًا بک فی TradeCity Pro! دعنا move ننتقل إلى تحلیل Bitcoin الیوم. لا یزال السوق یتراوح فی نطاقه لأنه عطلة نهایة الأسبوع، ولکن الیوم هناک فرصة قویة لـ movement. ⏳ إطار زمنی مدته ساعة واحدة بعد الانخفاض إلى منطقة 88,890، شکل السوق هیکل نطاق أمس، ویستعد Bitcoin الآن للنطاق move التالی. ✔️ کان حجم تداول عملة البیتکوین منخفضًا جدًا یوم أمس (السبت)، واستمر هذا الحجم المنخفض الیوم أیضًا. 💡 ومع ذلک، نظرًا لأننا شهدنا مؤخرًا تقلبات فی جلسة نیویورک أیام الأحد، فقد نشهد الیوم أیضًا movement. 💥 مع تراجع مؤشر القوة النسبیة إلى مستوى 50 وفشله فی الاستقرار فوقه، یمکن أن یدخل الزخم الهبوطی إلى السوق. 🧩 إذا دخل مؤشر القوة النسبیة منطقة ذروة البیع، فإن هذا الزخم الهبوطی سیزداد أکثر. 🎲 إذا تم کسر 88,890، فإن فتح صفقة بیع أمر منطقی، وقد یقل السعر move نحو 85,818. ⚖️ لکن الیوم، یمکن للسوق أیضًا أن یمنحنا إعدادًا طویلًا. إذا تم کسر مستوى 90,022، فیمکننا البحث عن مرکز طویل. 🎯 مستویات المقاومة التالیة لـ Bitcoin هی 91,974 و 93,609. ✨ الملاحظة الأکثر أهمیة لکلا المشغلین هی VOLUME. یجب أن یکون الاختراق مدعومًا بزیادة الحجم. 📊 إذا ظل الحجم منخفضًا ولم یتحسن، فإن احتمالیة الاختراقات الوهمیة تزید بشکل کبیر. 🔭 ولکن إذا حدث الاختراق مع ارتفاع حجم التداول، فیمکن أن یستمر الاتجاه بسلاسة. ❌ تنویه ❌ تداول العقود الآجلة أمر محفوف بالمخاطر وخطیر للغایة. إذا لم تکن خبیرًا، فقد لا تکون هذه المحفزات مناسبة لک. یجب علیک أولاً أن تتعلم إدارة المخاطر ورأس المال. یمکنک أیضًا استخدام المحتوى التعلیمی من هذه القناة. أخیرًا، تعکس هذه المحفزات آرائی الشخصیة حول حرکة السعر، وقد یعارض السوق هذا التحلیل تمامًا. لذلک، قم بإجراء البحث الخاص بک قبل فتح أی منصب.
tradecitypro
HBAR در کانون بحران: آیا حمایت حیاتی شکسته میشود یا خرسها باز میگردند؟
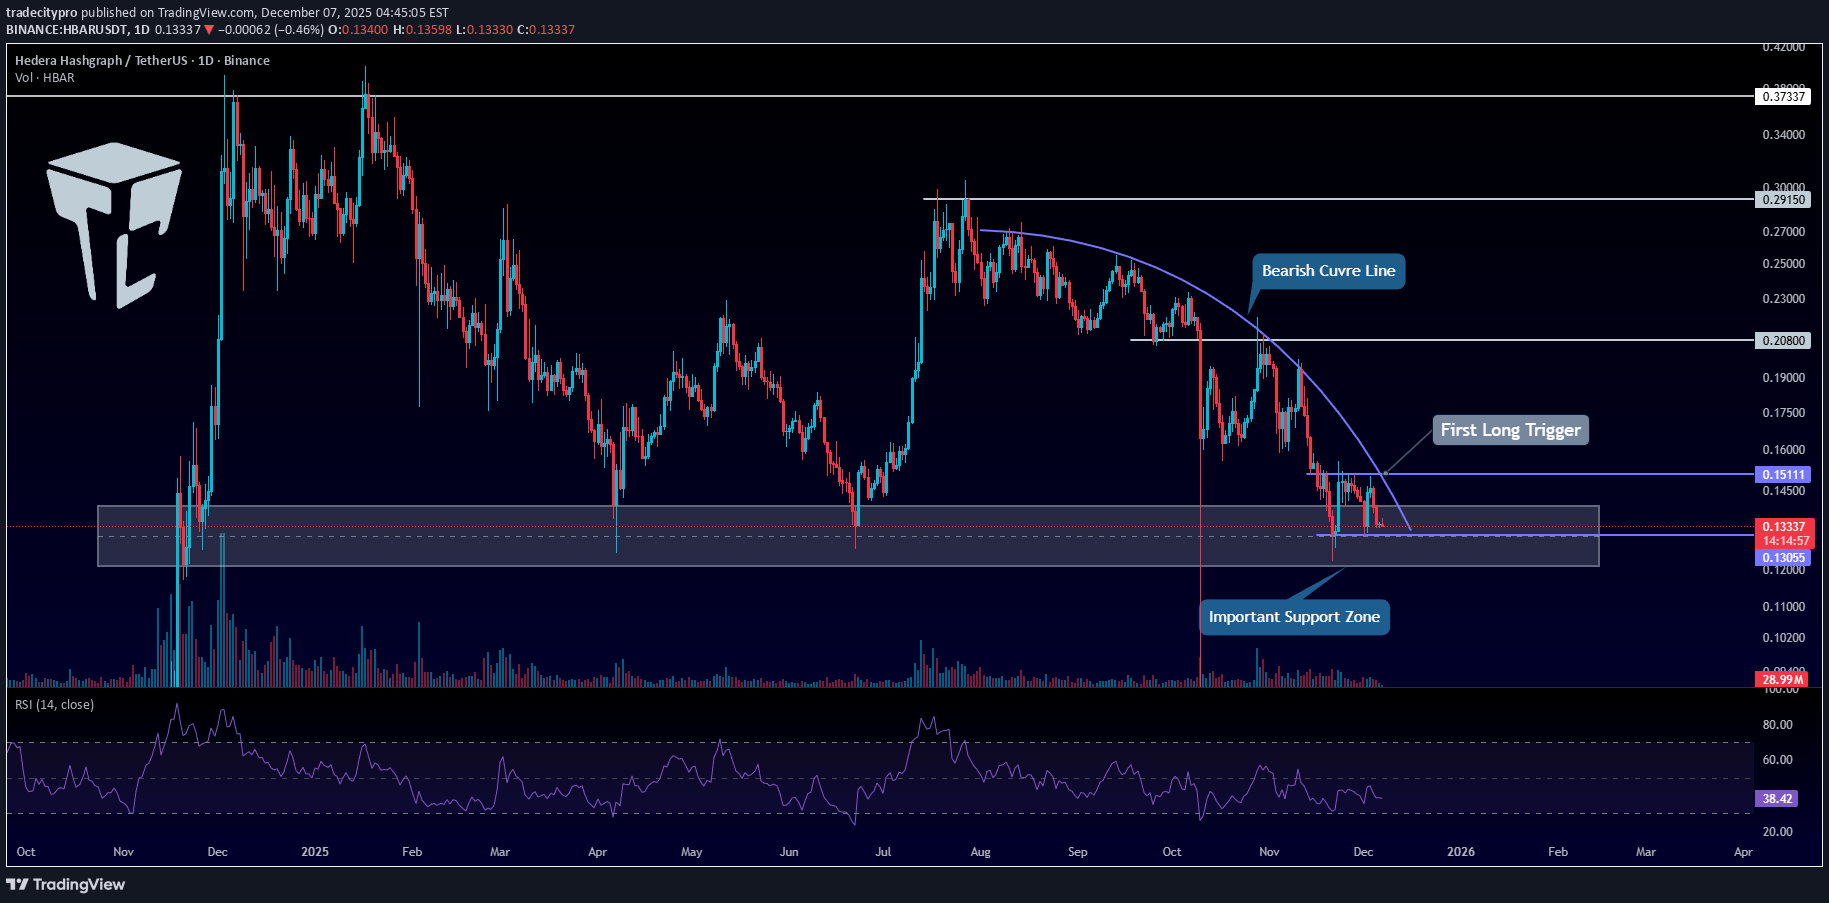
👋 مرحبًا بک فی TradeCityPro! فی هذا التحلیل، أرید مراجعة HBAR، وهو أحد المشاریع التی ترکز على RWA، والذی یحتل حالیًا المرتبة 21 على CoinMarketCap بقیمة سوقیة تبلغ 5.71 ملیار دولار. 🗓 الإطار الزمنی الیومی على الإطار الزمنی الیومی، تقع هذه العملة فی منطقة دعم مهمة جدًا. ✔️ یوجد أیضًا خط اتجاه هابط منحنی مرئی على HBAR، والذی بدأ یتشکل من القمة 0.2915. 🎲 فی کل مرة یلامس فیها السعر خط الاتجاه هذا، یزداد الزخم الهبوطی. 🎯 فی الوقت الحالی، السعر داخل منطقة الدعم هذه، وبالنظر إلى ضغط البیع القوی فی السوق، فإن احتمالیة کسر هذه المنطقة مرتفعة. 💥 اتخذ مؤشر القوة النسبیة أیضًا اتجاهًا هابطًا بعد الرفض من 0.2915، لیقضی معظم الوقت دون مستوى 50، مما یشیر إلى زخم هبوطی یسیطر على السوق. 💧 إذا دخل مؤشر القوة النسبیة منطقة ذروة البیع، فسوف یتکثف هذا الزخم الهبوطی بشکل أکبر، مما یزید من احتمالیة انهیار الدعم. سیکون کسر 0.13055 بمثابة محفز بیع قوی للغایة. 📊 بالنسبة لصفقات الشراء، بعد کسر خط الاتجاه الهابط، یمکننا الدخول باستخدام الزناد 0.15111. ⚡️ الإشارات مثل زیادة حجم التداول واستقرار مؤشر القوة النسبیة فوق 50 ستکون act بمثابة تأکیدات قویة على الانعکاس الصعودی. 📝 الخواطر النهائیة حافظ على هدوئک، وتداول بحکمة، ودعنا نغتنم أفضل الفرص المتاحة فی السوق! یعکس هذا التحلیل آرائنا ولیس نصیحة مالیة. شارک أفکارک فی التعلیقات، ولا تنس مشارکة هذا التحلیل مع أصدقائک! ❤️
tradecitypro
تحلیل روزانه بیت کوین (۲۴۲): آیا حرکت صعودی باز میگردد؟ منتظر چه سیگنالی باشیم؟
👋 مرحبًا بک فی TradeCityPro! دعنا move ننتقل إلى التحلیل Bitcoin. الیوم هو السبت، وبعد هبوط الأمس، یتأرجح السوق ویرتاح. ⌛️ إطار زمنی مدته ساعة واحدة شهدنا بالأمس إشارات واضحة على التصحیح والزخم الهبوطی فی عملة البیتکوین، ومع شمعة البیع انخفض السعر إلى مستوى 89,082. 🔭 بعد الوصول إلى هذه المنطقة توقف التصحیح، ویتحرک Bitcoin الآن بشکل جانبی بالقرب من مستوى 89,082. 💥 بالنسبة لمؤشر القوة النسبیة (RSI)، کان لدینا خط اتجاه هابط یحترمه مؤشر القوة النسبیة (RSI) جیدًا. ✨ الآن بعد أن تم کسر خط الاتجاه هذا، یقوم مؤشر القوة النسبیة باختبار مستوى المقاومة 42.25. ⚡️ إذا کسر مؤشر القوة النسبیة فوق هذا المستوى، سنحصل على أول إشارة للزخم الصعودی یعود إلى Bitcoin. 🎲 إذا حصلنا على هذا التأکید من مؤشر القوة النسبیة، فیمکننا بعد ذلک البحث عن مشغل شراء على الرسم البیانی Bitcoin نفسه. 🧩 بمجرد کسر BTC للهیکل قصیر المدى الذی یشکله بحلول ذلک الوقت، یمکننا فتح مرکز طویل. 🎯 ومع ذلک، بما أن الیوم هو السبت، فأنا شخصیًا أفضل الانتظار وتجنب فتح أی صفقات حتى بدایة الأسبوع الجدید. 💡 ومع ذلک، سأبقى خلف الرسم البیانی، وإذا تحقق السیناریو الصعودی، فسوف أفتح صفقة شراء. 📊 بالنسبة لصفقة بیع، یمکننا الدخول عند کسر 89,082، ولکن بصراحة، العدید من العملات البدیلة المقترنة بـ BTC لدیها مشغلات بیع أفضل بکثیر فی الوقت الحالی. ❌ تنویه ❌ تداول العقود الآجلة أمر محفوف بالمخاطر وخطیر للغایة. إذا لم تکن خبیرًا، فقد لا تکون هذه المحفزات مناسبة لک. یجب علیک أولاً أن تتعلم إدارة المخاطر ورأس المال. یمکنک أیضًا استخدام المحتوى التعلیمی من هذه القناة. أخیرًا، تعکس هذه المحفزات آرائی الشخصیة حول حرکة السعر، وقد یعارض السوق هذا التحلیل تمامًا. لذلک، قم بإجراء البحث الخاص بک قبل فتح أی منصب.
tradecitypro
تحلیل بیت کوین امروز: آیا سقوط بزرگ بعدی آغاز میشود؟ (تحلیل ۲۴۱)
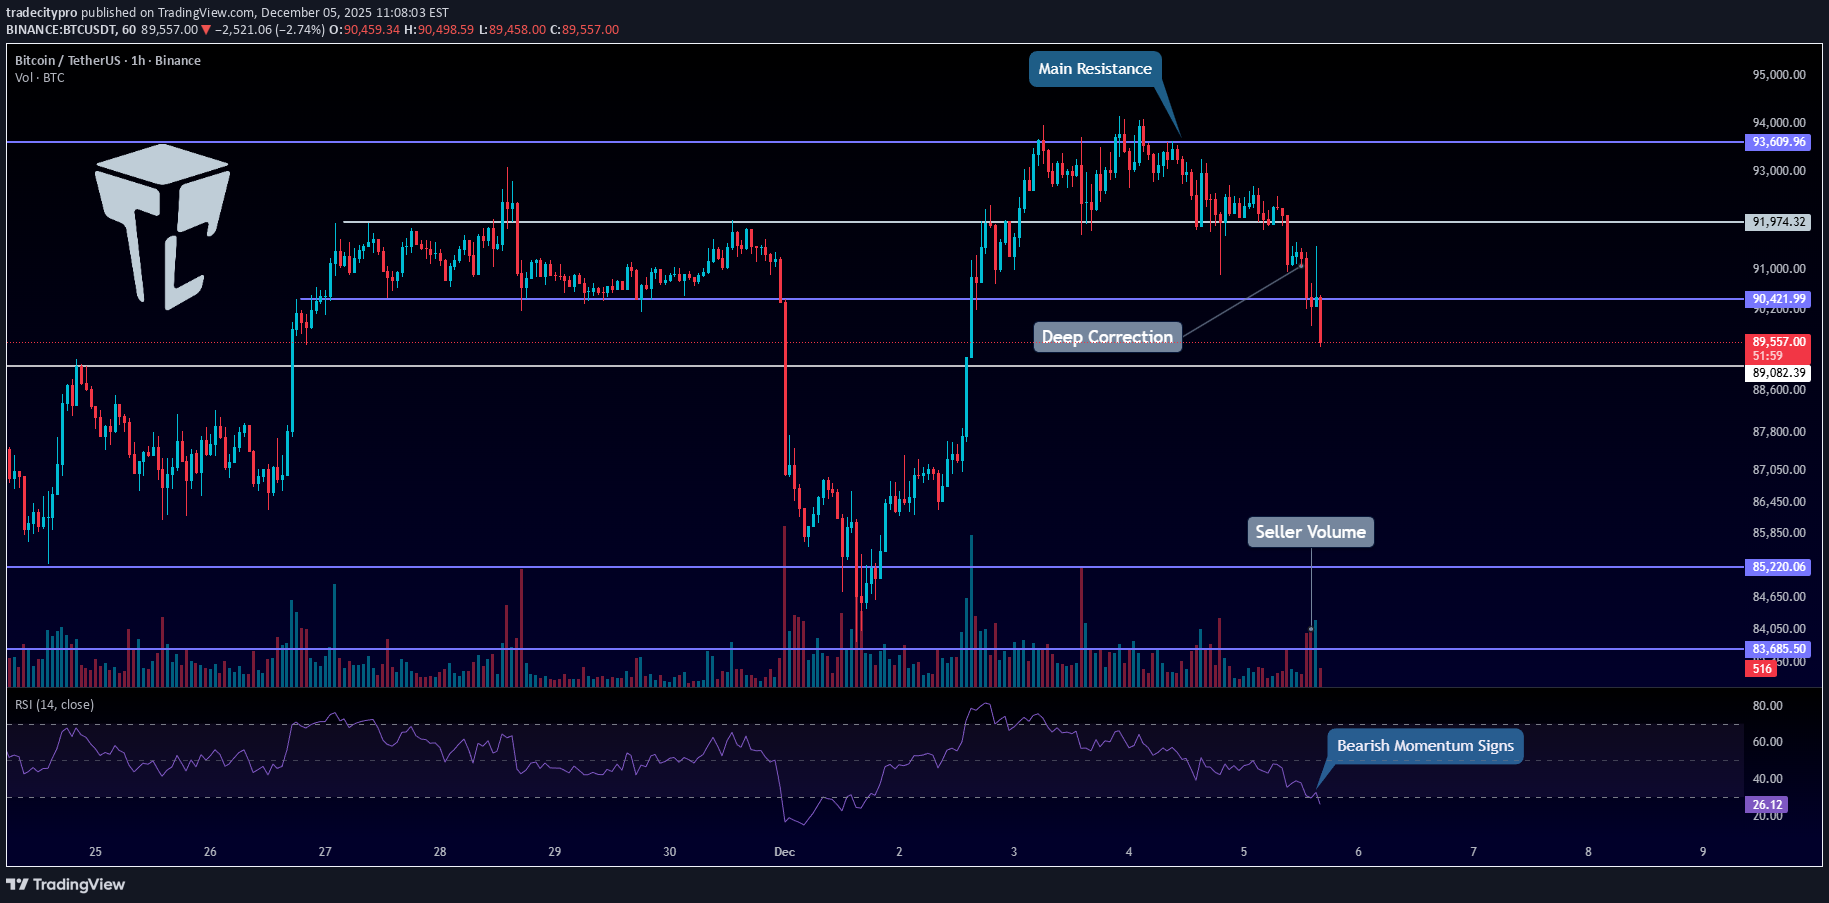
👋 مرحبًا بک فی TradeCity Pro! دعنا move ننتقل إلى تحلیل Bitcoin الیوم. السوق حالیا فی مرحلة التصحیح الهبوطی. ⏳ إطار زمنی مدته ساعة واحدة بالأمس، قام Bitcoin بالتصحیح هبوطًا إلى 91,974، وکما ذکرت، فإن الزخم الصعودی الذی کان یتمتع به السوق قد انتهى. 🔔 الآن أصبح التصحیح أعمق وانخفض السعر إلى 90,421. ✔️ تظهر الشمعة الأخیرة التی رأیناها هیمنة قویة للبائعین، ومع حجم البیع المرتفع، من الممکن أن تکون بدایة اتجاه هبوطی جدید move. 💥مؤشر القوة النسبیة بعد إعادة ضبطه بالأمس، انخفض الآن إلى مستوى 30، مع احتمالیة الاختراق تحته والدخول إلى منطقة ذروة البیع. 💫 إذا حدث ذلک، فی ظل ضغط البیع القوی والشموع القویة red، فإن احتمالیة الهبوط نحو المستویات الأدنى ستزداد بشکل ملحوظ. 🧩 منطقة واحدة لم یتفاعل معها السعر بشکل صحیح هی 89,082. 🎲 کان هذا المستوى مهمًا جدًا للبیتکوین، لکن السعر لم یحترمه کثیرًا مؤخرًا. ⭐ إذا فشل السعر مرة أخرى فی التفاعل مع هذا المستوى عند مستوى move الهبوطی التالی، فیمکننا أن نستنتج أن هذا الدعم قد ضعف. ⚖️ ومع ذلک، فی رأیی، إذا کان المشترون سیتدخلون، فإن هذا المستوى لیس مرشحًا سیئًا لرد الفعل. 🔭 إذا حصل Bitcoin على دعم عند 89,082 وتحرک صعودًا، فسوف یکون form قاعًا أعلى مقارنة بـ 85,220، مما یزید من احتمالیة تشکیل هیکل صعودی. ☘️ ولکن إذا تم کسر مستوى 89,082، فسیبدأ الاتجاه الهبوطی move نحو 85,220، وقد یشیر ذلک إلى بدایة الموجة الهبوطیة التالیة major على الإطار الزمنی الیومی. ❌ تنویه ❌ تداول العقود الآجلة أمر محفوف بالمخاطر وخطیر للغایة. إذا لم تکن خبیرًا، فقد لا تکون هذه المحفزات مناسبة لک. یجب علیک أولاً أن تتعلم إدارة المخاطر ورأس المال. یمکنک أیضًا استخدام المحتوى التعلیمی من هذه القناة. أخیرًا، تعکس هذه المحفزات آرائی الشخصیة حول حرکة السعر، وقد یعارض السوق هذا التحلیل تمامًا. لذلک، قم بإجراء البحث الخاص بک قبل فتح أی منصب.
tradecitypro
تحلیل کلیدی MNT: آیا این آلتکوین آماده شکست صعودی است؟ (سطوح ورود و خروج)
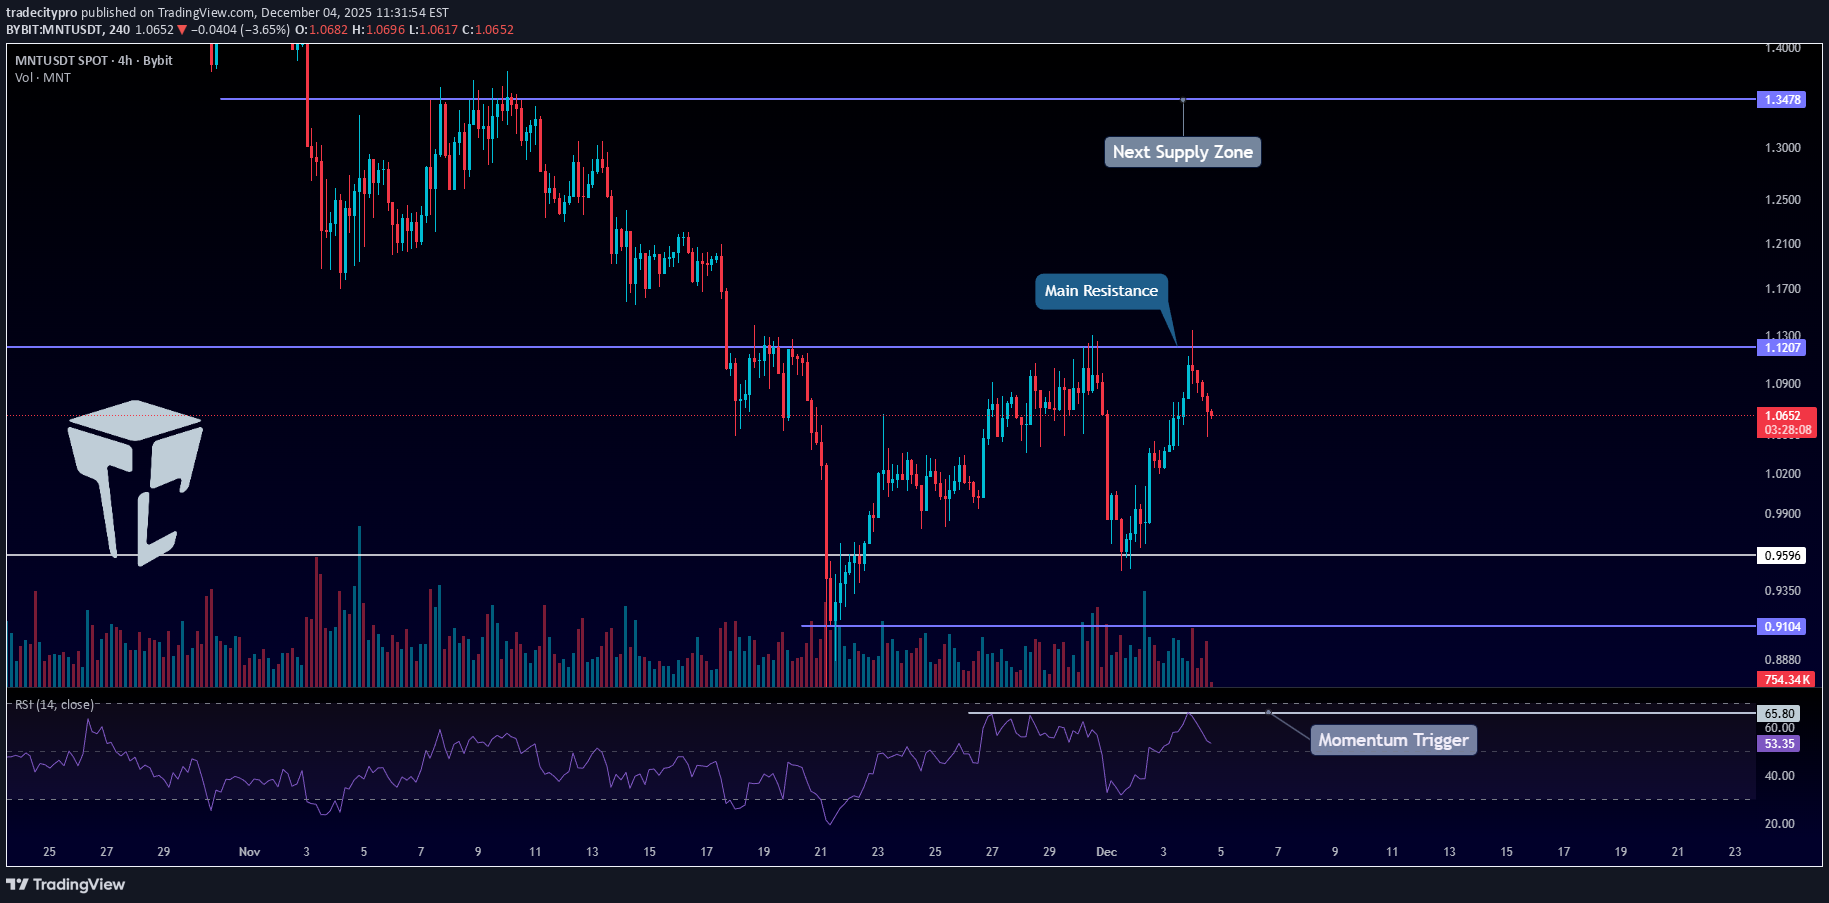
👋 مرحبًا بک فی TradeCityPro! فی هذا التحلیل، أرغب فی مراجعة MNT، وهو مشروع من الطبقة الثانیة Ethereum بقیمة سوقیة تبلغ 3.4 ملیار دولار، ویحتل حالیًا المرتبة 31 على CoinMarketCap. ⏳ الإطار الزمنی 4 ساعات على الإطار الزمنی لمدة 4 ساعات، کانت هذه العملة فی اتجاه هبوطی، وبعد أن وصلت إلى 0.9596، دخلت مرحلة النطاق. ✔️ حالیًا، تشکل مربع النطاق بین 0.9596 و 1.1207، ویتفاعل السعر مع قمة المربع عند 1.1207. 💥على مؤشر القوة النسبیة، لدینا مستوى مقاومة مهم جدًا عند 65.80. 🔔 کسر هذا المستوى على مؤشر القوة النسبیة من شأنه أن یؤکد دخول الزخم الصاعد، وفی هذه الحالة یمکننا فتح صفقة شراء بعد کسر مستوى 1.1207. ✨ کسر مستوى 1.1207 سیکون التأکید الأول للاتجاه الصاعد لـ MNT، ومن الممکن أن تبدأ العملة موجة صعودیة. 🧩 هذا الصعود movement قد یستمر نحو 1.3478. ⚖️ ومع ذلک، إذا تم رفض السعر عند 1.1207 وعاد نحو 0.9596، فیمکننا فتح صفقة بیع بعد کسر مستوى الدعم 0.9596. 📝 الخواطر النهائیة حافظ على هدوئک، وتداول بحکمة، ودعنا نغتنم أفضل الفرص المتاحة فی السوق! یعکس هذا التحلیل آرائنا ولیس نصیحة مالیة. شارک أفکارک فی التعلیقات، ولا تنس مشارکة هذا التحلیل مع أصدقائک! ❤️
إخلاء المسؤولية
أي محتوى ومواد مدرجة في موقع Sahmeto وقنوات الاتصال الرسمية هي عبارة عن تجميع للآراء والتحليلات الشخصية وغير ملزمة. لا تشكل أي توصية للشراء أو البيع أو الدخول أو الخروج من سوق الأوراق المالية وسوق العملات المشفرة. كما أن جميع الأخبار والتحليلات المدرجة في الموقع والقنوات هي مجرد معلومات منشورة من مصادر رسمية وغير رسمية محلية وأجنبية، ومن الواضح أن مستخدمي المحتوى المذكور مسؤولون عن متابعة وضمان أصالة ودقة المواد. لذلك، مع إخلاء المسؤولية، يُعلن أن المسؤولية عن أي اتخاذ قرار وإجراء وأي ربح وخسارة محتملة في سوق رأس المال وسوق العملات المشفرة تقع على عاتق المتداول.