
sunya
@t_sunya

ما هو الشيء الذي ننصحك بشراءه من المواد الغذائية؟
سابق في الشراء
پیام های تریدر
مرشح
sunya
تحلیل تکنیکال فوقحرفهای S&P 500: نقشه راه هفته | فرصتهای میلیون دلاری!
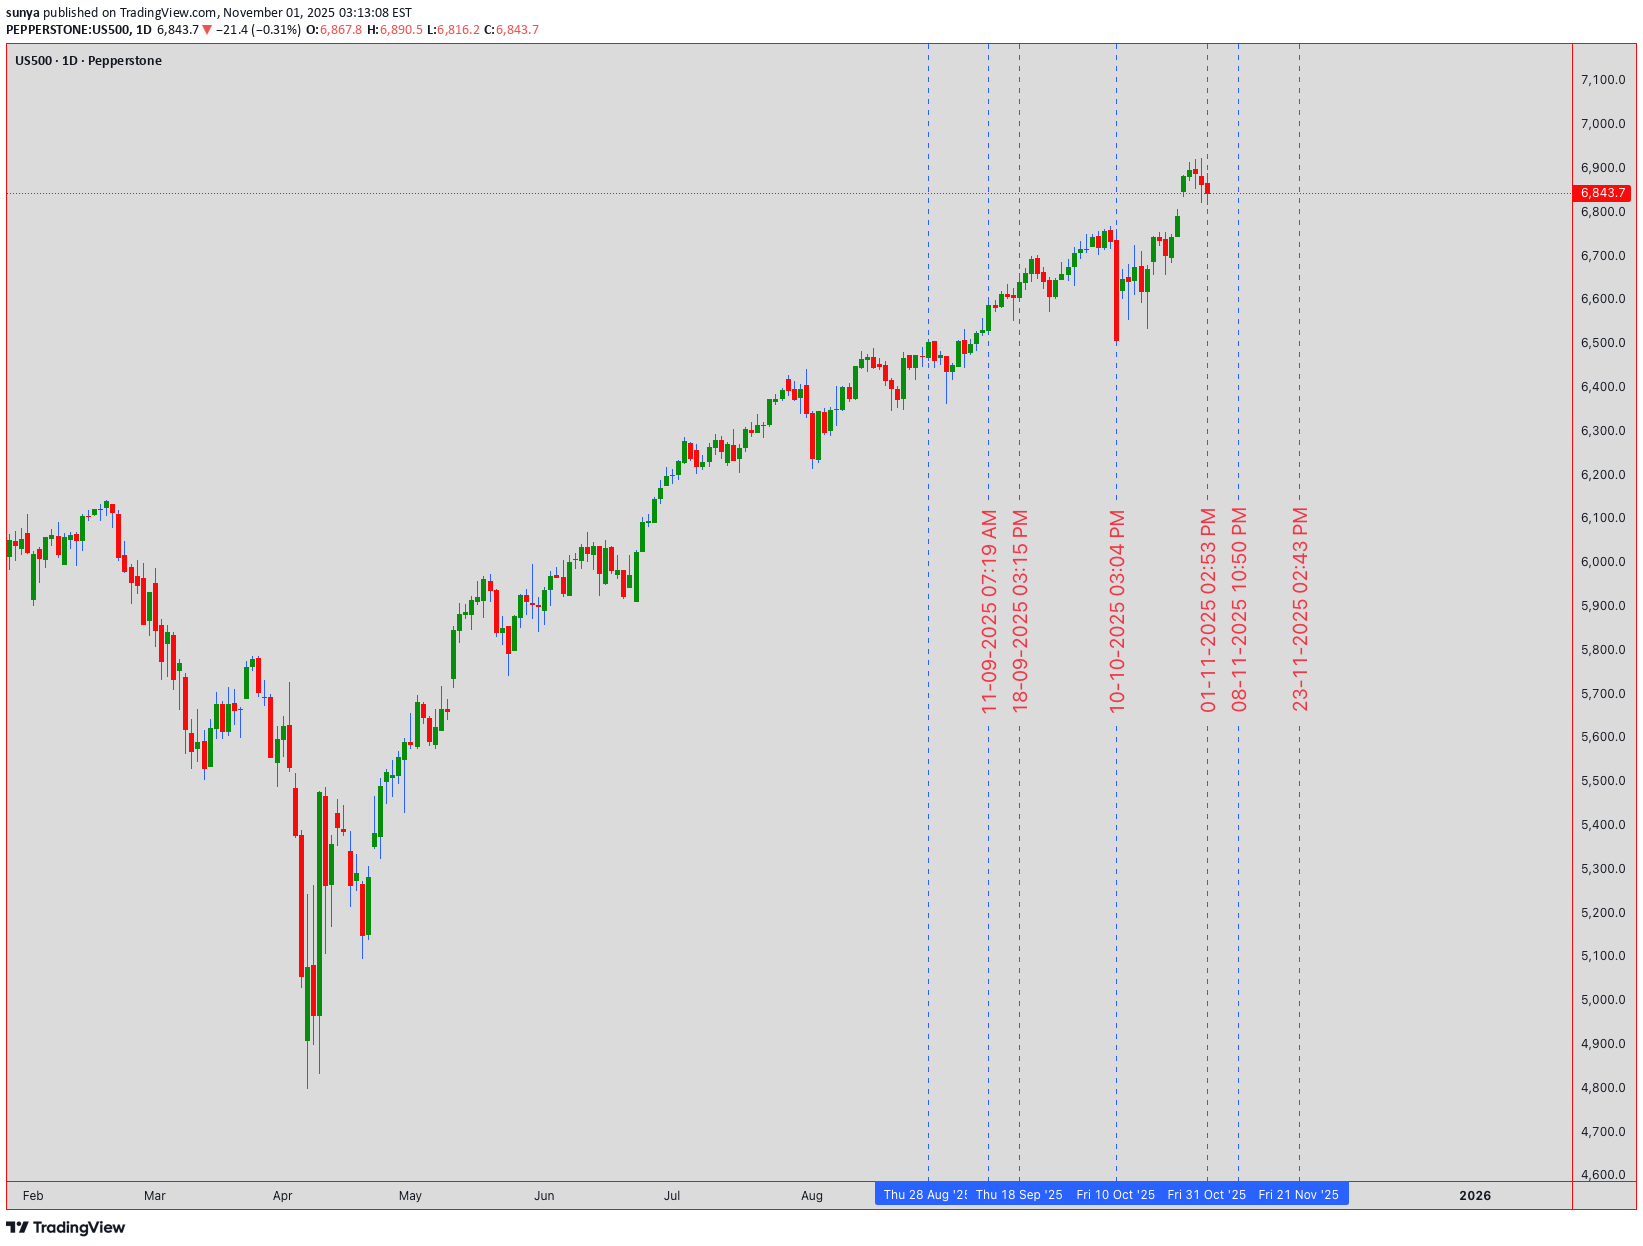
🔥 US500 S&P 500 INDEX | Institutional Technical Analysis Masterpiece | 6,843.7 🔥 📈 ELITE MULTI-TIMEFRAME BREAKDOWN | NOVEMBER 3-7, 2025 TRADING ROADMAP 📈 Current Level: 6,843.7 | Analysis Date: November 1, 2025, 00:54 UTC+4 Hello, TradingView community! 👋 The S&P 500 has been on an absolute tear, closing the week at a staggering 6,843.7 . The big question on everyone's mind is: Are we witnessing a final euphoric push before a correction, or is this simply a pause before the next leg up? This week, from November 3rd to 7th, will be critical. Let's break down the multi-timeframe picture, blending classic theories with modern indicators to build a comprehensive trading plan for both intraday and swing traders. 🧠 ═══════════════════════════════════════════════════════════════════ 🎯 MARKET INTELLIGENCE EXECUTIVE SUMMARY The S&P 500 stands at 6,843.7 , navigating a historic technical confluence zone that will determine the market's trajectory through year-end 2025. Our algorithmic and classical analysis fusion reveals bullish continuation potential with measured risk parameters. This week presents asymmetric opportunities as institutional positioning, technical patterns, and macro catalysts align for potentially explosive moves. Critical Support Infrastructure: 🛡️ Immediate Floor: 6,820 - 6,830 (Algorithmic bid zone) Secondary Base: 6,800 - 6,810 (Institutional accumulation) Major Support: 6,750 - 6,770 (Weekly pivot nexus) Ultimate Defense: 6,700 - 6,720 (Psychological fortress) Resistance & Target Architecture: 🎯 First Ceiling: 6,860 - 6,870 (Intraday supply) Secondary Wall: 6,900 - 6,910 (Round number magnet) Breakout Zone: 6,950 - 6,970 (Pattern objective) Major Extension: 7,000 - 7,020 (Psychological milestone) ═══════════════════════════════════════════════════════════════════ 📊 WEEKLY TIMEFRAME (1W) - MACRO MARKET STRUCTURE Elliott Wave Grand Architecture: 🌊 We're positioned in Minor Wave 3 of Intermediate Wave (5) within the secular bull market. The impulsive structure projects targets at 7,100-7,200 based on Fibonacci extensions. Critical validation: maintaining above 6,720 preserves the bullish count. Primary Count: Wave 3 of (5) targeting 7,100 Alternative: Wave B of expanded flat, risk below 6,650 Invalidation: Weekly close below 6,600 Time projection: Completion by late November Wyckoff Accumulation Schematic: 📚 Phase D - Markup Beginning - Preliminary Supply (PSY): 6,920 tested - Buying Climax (BC): 6,950 rejection - Automatic Reaction (AR): 6,750 hold - Last Point of Support (LPS): Current 6,843 - Sign of Strength (SOS): Pending above 6,870 Ichimoku Cloud Mastery: ☁️ Pine Script® Tenkan-sen: 6,815 (9-period support) Kijun-sen: 6,780 (26-period base) Senkou A: 6,850 (cloud top resistance) Senkou B: 6,720 (cloud bottom support) Chikou Span: Clear above price (bullish) Cloud status: Thick and ascending Expand 1 line Advanced Harmonic Patterns: 🦋 Developing Bullish Gartley with precision ratios: - XA leg: 6,500 to 6,950 (450 points) - AB retracement: 0.618 at 6,672 ✅ - BC extension: Testing 0.786 at 6,845 (current) - D completion: 0.786 XA at 6,850-6,870 - Target upon completion: 7,050-7,100 ═══════════════════════════════════════════════════════════════════ 📉 DAILY TIMEFRAME (1D) - SWING TRADING COMMAND CENTER Japanese Candlestick Mastery: 🕯️ Yesterday's Doji Star at resistance signals equilibrium. Today's action critical: - Close above 6,860 = Three White Soldiers continuation - Close below 6,820 = Evening Star reversal warning - Current bias: Neutral-bullish pending confirmation Master Pattern Recognition: Cup and Handle formation nearing completion: - Cup low: 6,650 (October) - Cup high: 6,920 (Recent peak) - Handle forming: 6,820-6,870 range - Breakout target: 7,190 (270-point measured move) - Volume requirement: 25% above 20-day average Bollinger Bands Configuration: 📊 Upper Band: 6,875 (immediate resistance) Middle Band (20-SMA): 6,810 (dynamic support) Lower Band: 6,745 (oversold boundary) Band Width: Expanding (volatility increasing) %B Indicator: 0.68 (upper half, bullish bias) RSI Multi-Timeframe Analysis: Daily RSI: 59 (room for upside) Hidden bullish divergence vs price action Support trend line from September intact Resistance at 70 provides 11-point runway ═══════════════════════════════════════════════════════════════════ ⚡ 4-HOUR TIMEFRAME (4H) - TACTICAL EXECUTION FRAMEWORK Gann Theory Application: 📐 Pine Script® Current Gann Angles: 1x1: 6,825 (45-degree support) 2x1: 6,850 (current resistance) 1x2: 6,790 (major support) Square of 9: 6,889 (next target) Gann Box: 6,750-6,950 range Time cycles: Nov 5 critical date Expand 2 lines Dow Theory Confirmation Checklist: ✅ Primary Trend: Bullish (new highs achieved) Secondary Trend: Consolidation/Correction Volume Confirmation: Accumulation on dips Breadth Analysis: 65% stocks above 50-DMA Sector Rotation: Technology leading (bullish) Transportation Confirmation: Pending Moving Average Symphony: - EMA 8: 6,838 (ultra-short support) - EMA 21: 6,825 (short-term support) - EMA 50: 6,810 (medium support) - SMA 100: 6,785 (strong support) - SMA 200: 6,750 (major trend support) Pattern Alert: 🚨 Ascending Triangle resolution imminent: - Horizontal resistance: 6,860-6,870 - Rising support: 6,820-6,830 - Apex convergence: November 4 - Breakout projection: 6,950+ ═══════════════════════════════════════════════════════════════════ 🎪 1-HOUR TIMEFRAME (1H) - PRECISION TRADING LABORATORY Micro Pattern Development: 🔬 Double Bottom forming at 6,825: - First bottom: 6,823 (10:00 UTC) - Second bottom: 6,826 (14:00 UTC) - Neckline resistance: 6,855 - Pattern target: 6,885 (30-point move) VWAP Trading Matrix: Daily VWAP: 6,841 Weekly VWAP: 6,825 Monthly VWAP: 6,795 Upper Band 1: 6,858 (first resistance) Upper Band 2: 6,875 (second resistance) Lower Band 1: 6,824 (first support) Lower Band 2: 6,807 (second support) Support & Resistance Precision Grid: Pine Script® R4: 6,890 (Major resistance) R3: 6,875 (Daily upper BB) R2: 6,860 (Pattern neckline) R1: 6,850 (Immediate resistance) PIVOT: 6,843.7 (Current Price) S1: 6,835 (Micro support) S2: 6,825 (VWAP support) S3: 6,810 (Major support) S4: 6,795 (Monthly VWAP) Expand 4 lines ═══════════════════════════════════════════════════════════════════ ⚡ 30-MINUTE TIMEFRAME (30M) - SCALPING COMMAND POST Microstructure Analysis: 🎯 Bull Flag pattern developing: - Pole: 6,810 to 6,855 (45 points) - Flag consolidation: 6,835-6,845 - Breakout trigger: 6,846 - Target: 6,890 (45-point measured move) Volume Profile Intelligence: 📊 POC (Point of Control): 6,837 VAH (Value Area High): 6,848 VAL (Value Area Low): 6,828 HVN (High Volume Node): 6,835-6,840 LVN (Low Volume Node): 6,855-6,860 (breakout zone) Scalping Execution Zones: Buy Zones: • Zone 1: 6,835-6,838 (POC test) • Zone 2: 6,828-6,831 (VAL support) • Zone 3: 6,820-6,823 (Strong bid) Sell Zones: • Zone 1: 6,848-6,851 (VAH resistance) • Zone 2: 6,858-6,861 (Supply zone) • Zone 3: 6,868-6,871 (Major resistance) ═══════════════════════════════════════════════════════════════════ 🏃 15-MINUTE & 5-MINUTE HYPERSPEED SCALPING 15-Minute Lightning Analysis: ⚡ Wedge pattern near apex: - Upper trendline: 6,847 - Lower trendline: 6,839 - Breakout direction: 70% probability upward - Quick target: 6,855 (+12 points) - Stop: 6,835 (-8 points) 5-Minute Algorithmic Signals: Pine Script® Long Entry Conditions: RSI(5) < 30 AND Price > VWAP = BUY MACD crossover AND Volume > Average = BUY Price touches EMA(20) from above = BUY Short Entry Conditions: RSI(5) > 70 AND Price < VWAP = SELL MACD crossunder AND High volume = SELL Price rejected at resistance = SELL Exit Rules: Take profit: 8-10 points Stop loss: 5-6 points Time stop: 15 minutes max hold Expand 9 lines Session Volatility Map: 🕐 Asian: 10-15 point range (quiet) London Open: 20-30 point expansion NY Premarket: 25-35 point volatility NY Open: 40-50 point moves NY Afternoon: 20-30 point consolidation ═══════════════════════════════════════════════════════════════════ 📅 WEEKLY STRATEGIC FORECAST (NOVEMBER 3-7, 2025) Monday, November 3: 🚀 Opening gap probability: 60% bullish Strategy: Buy weakness to 6,830, target 6,870 Key levels: Support 6,820, Resistance 6,880 Expected range: 50 points Tuesday, November 4: 🗳️ Election Day - Extreme volatility expected Strategy: Straddle/strangle positions Potential range: 6,750-6,920 (170 points!) VIX spike likely above 25 Wednesday, November 5: 💥 Post-election directional resolution Strategy: Trade the breakout aggressively Bullish above 6,880 → Target 6,950 Bearish below 6,800 → Target 6,720 Thursday, November 6: 📊 FOMC minutes and economic data Strategy: Fade first move, trade reversal Expected consolidation: 6,850-6,900 Options gamma concentration: 6,875 Friday, November 7: 🎯 Weekly options expiration dynamics Strategy: Theta decay trades around 6,850 Pin risk: 6,850 strike concentration Weekly close above 6,870 = Bullish next week ═══════════════════════════════════════════════════════════════════ ⚖️ INSTITUTIONAL RISK MANAGEMENT PROTOCOLS Intraday Risk Framework: 🛡️ Position sizing: 0.5-1% risk per trade Risk-Reward: Minimum 1:2.5 ratio Daily loss limit: -2% portfolio max Consecutive losses: 3 max, then pause Profit trailing: 60% of maximum gain Breakeven stop: At 10-point profit Scaling strategy: 3 entries maximum Swing Position Architecture: 💼 Core position: 50% at 6,820-6,830 Add-on levels: 25% at 6,800, 25% at 6,780 Stop loss: Below 6,750 (all positions) Target 1: 6,900 (25% exit) Target 2: 6,950 (35% exit) Target 3: 7,000 (25% exit) Runner: 7,050+ (15% hold) ═══════════════════════════════════════════════════════════════════ 🔴 RISK SCENARIOS & CIRCUIT BREAKERS Bearish Invalidation Levels: 🐻 15-min close below 6,835 = Micro caution Hourly close below 6,820 = Intraday bearish 4H close below 6,800 = Swing bearish shift Daily close below 6,750 = Trend reversal risk Weekly close below 6,700 = Major bear signal Tail Risk Considerations: 🦢 • Geopolitical shock (100+ point gap risk) • Fed policy surprise (2-3% moves) • Tech earnings disasters (sector rotation) • Credit event contagion (systemic risk) • AI bubble concerns (valuation reset) ═══════════════════════════════════════════════════════════════════ 💎 ELITE CONFLUENCE TRADING ZONES Premium Buy Zone: ✅ 6,820-6,830 (Multi-timeframe support + Fibonacci 61.8% + VWAP + Moving average cluster) Optimal Sell Zone: ❌ 6,870-6,880 (Resistance confluence + Pattern targets + Round number + Options barrier) Breakout Trigger: 🚀 6,870-6,875 (Triangle apex + Bollinger Band + Volume breakout zone) ═══════════════════════════════════════════════════════════════════ 🏆 MASTER TRADER'S FINAL VERDICT The S&P 500 at 6,843.7 presents a high-conviction bullish opportunity with exceptional risk-reward dynamics. Technical confluence across multiple timeframes, combined with constructive market internals and seasonal factors, supports upside continuation toward 6,900-6,950 initially, with 7,000+ potential. Top 3 Highest Probability Trades: 🎯 Swing Long: 6,820-6,830 → Target: 6,950 (RR 1:4) Breakout Long: Above 6,870 → Target: 6,920 (RR 1:3) Scalp Long: VWAP 6,841 → Target: 6,855 (RR 1:2.5) Trading Wisdom: 🧠 Position for probability, not possibility. Size for survival, not home runs. The best traders are risk managers who happen to trade. "Markets can remain irrational longer than you can remain solvent. Trade the chart, not the opinion!" 💡 ═══════════════════════════════════════════════════════════════════ 📍 ACTIONABLE INTELLIGENCE SUMMARY Bull market intact above 6,750. Accumulate dips toward 6,820. Target 7,000 by month-end. Risk management is paramount during election week volatility. Trade with discipline. Prosper with patience. 💰 ═══════════════════════════════════════════════════════════════════ #SPX #SP500 #US500 #TechnicalAnalysis #Trading #StockMarket #Indices #DayTrading #SwingTrading #ElliottWave #Wyckoff #HarmonicPatterns #OptionsTrading #VIX #MarketStructure #OrderFlow #InstitutionalTrading #AlgorithmicTrading #TradingView #MarketForecast #SPY #ES_F 🔔 Follow for Institutional-Grade Analysis | Precision • Discipline • Profits 📊 Disclaimer: This analysis is educational only. Trading carries substantial risk of loss. Past performance does not guarantee future results. Always conduct independent research and employ proper risk management.
sunya
تحلیل تکنیکال طلا (XAUUSD): استراتژی دقیق نوسانگیری و روزانه با اهداف بزرگ
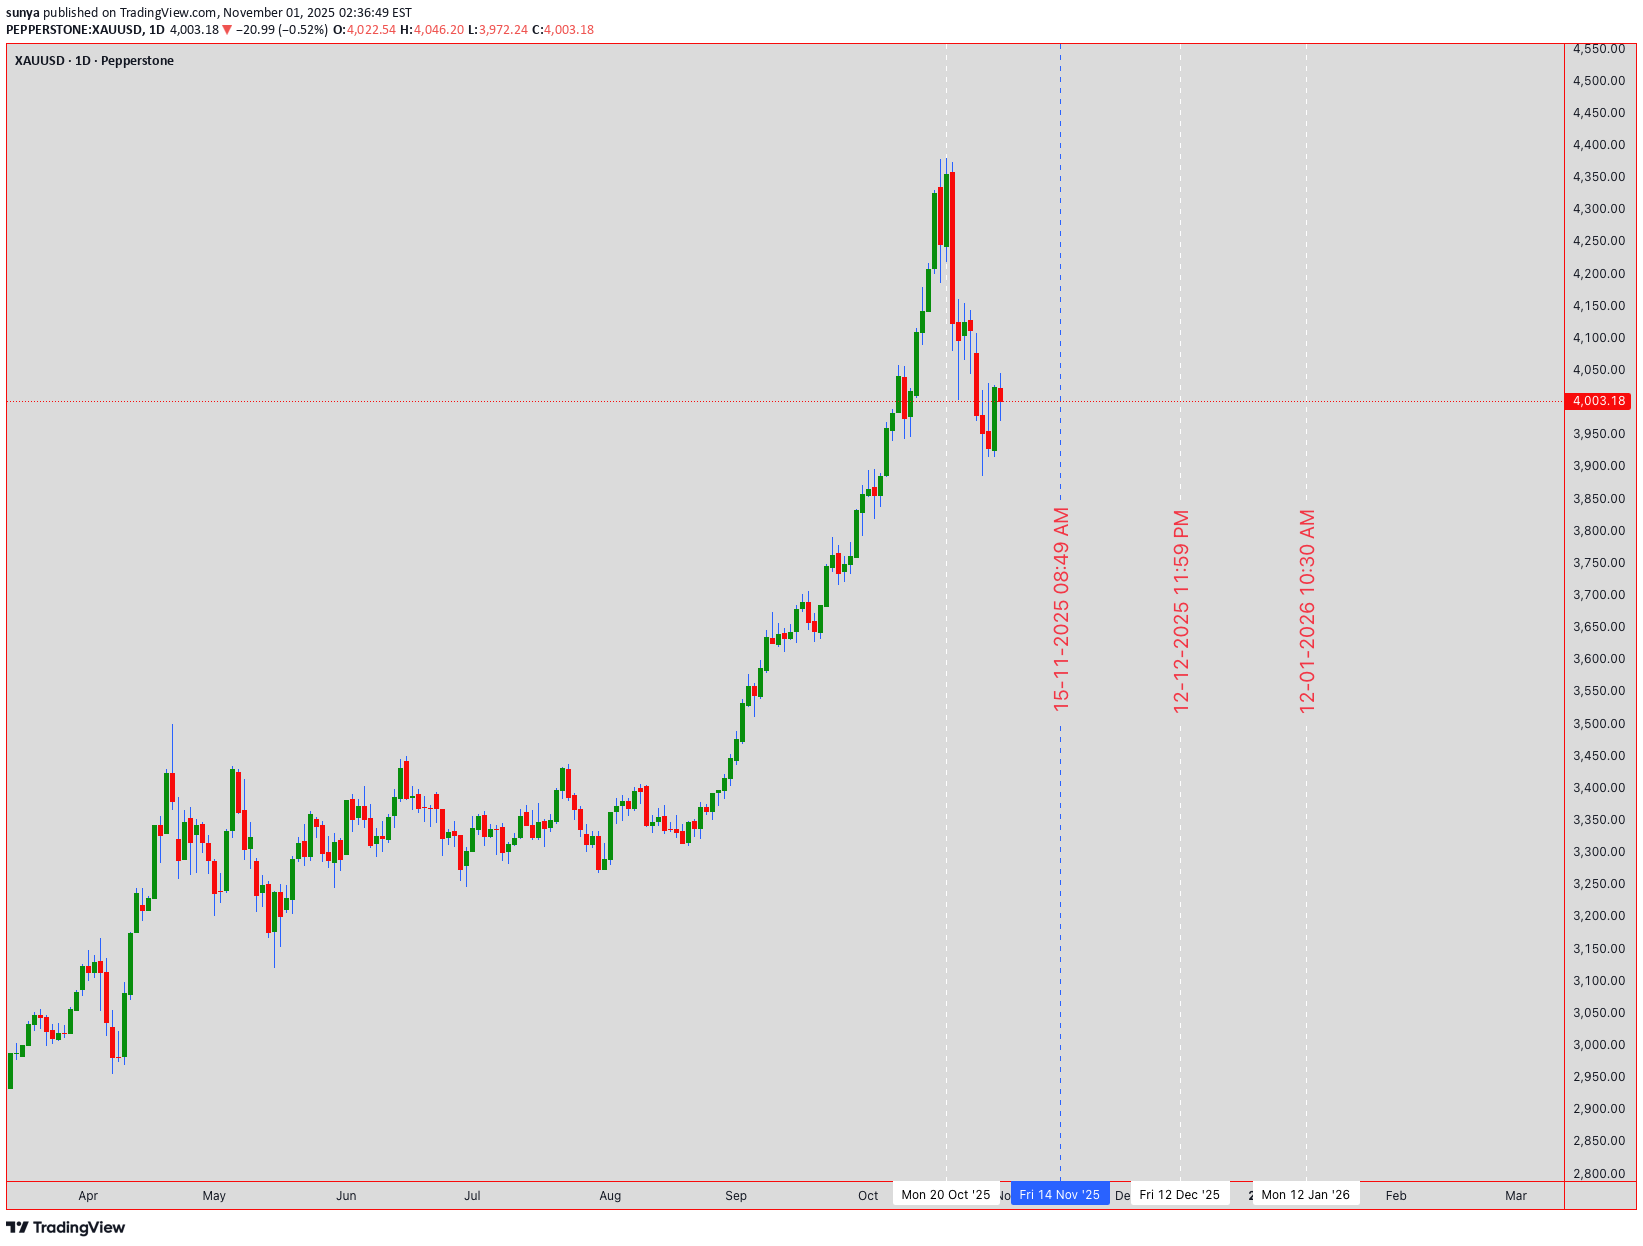
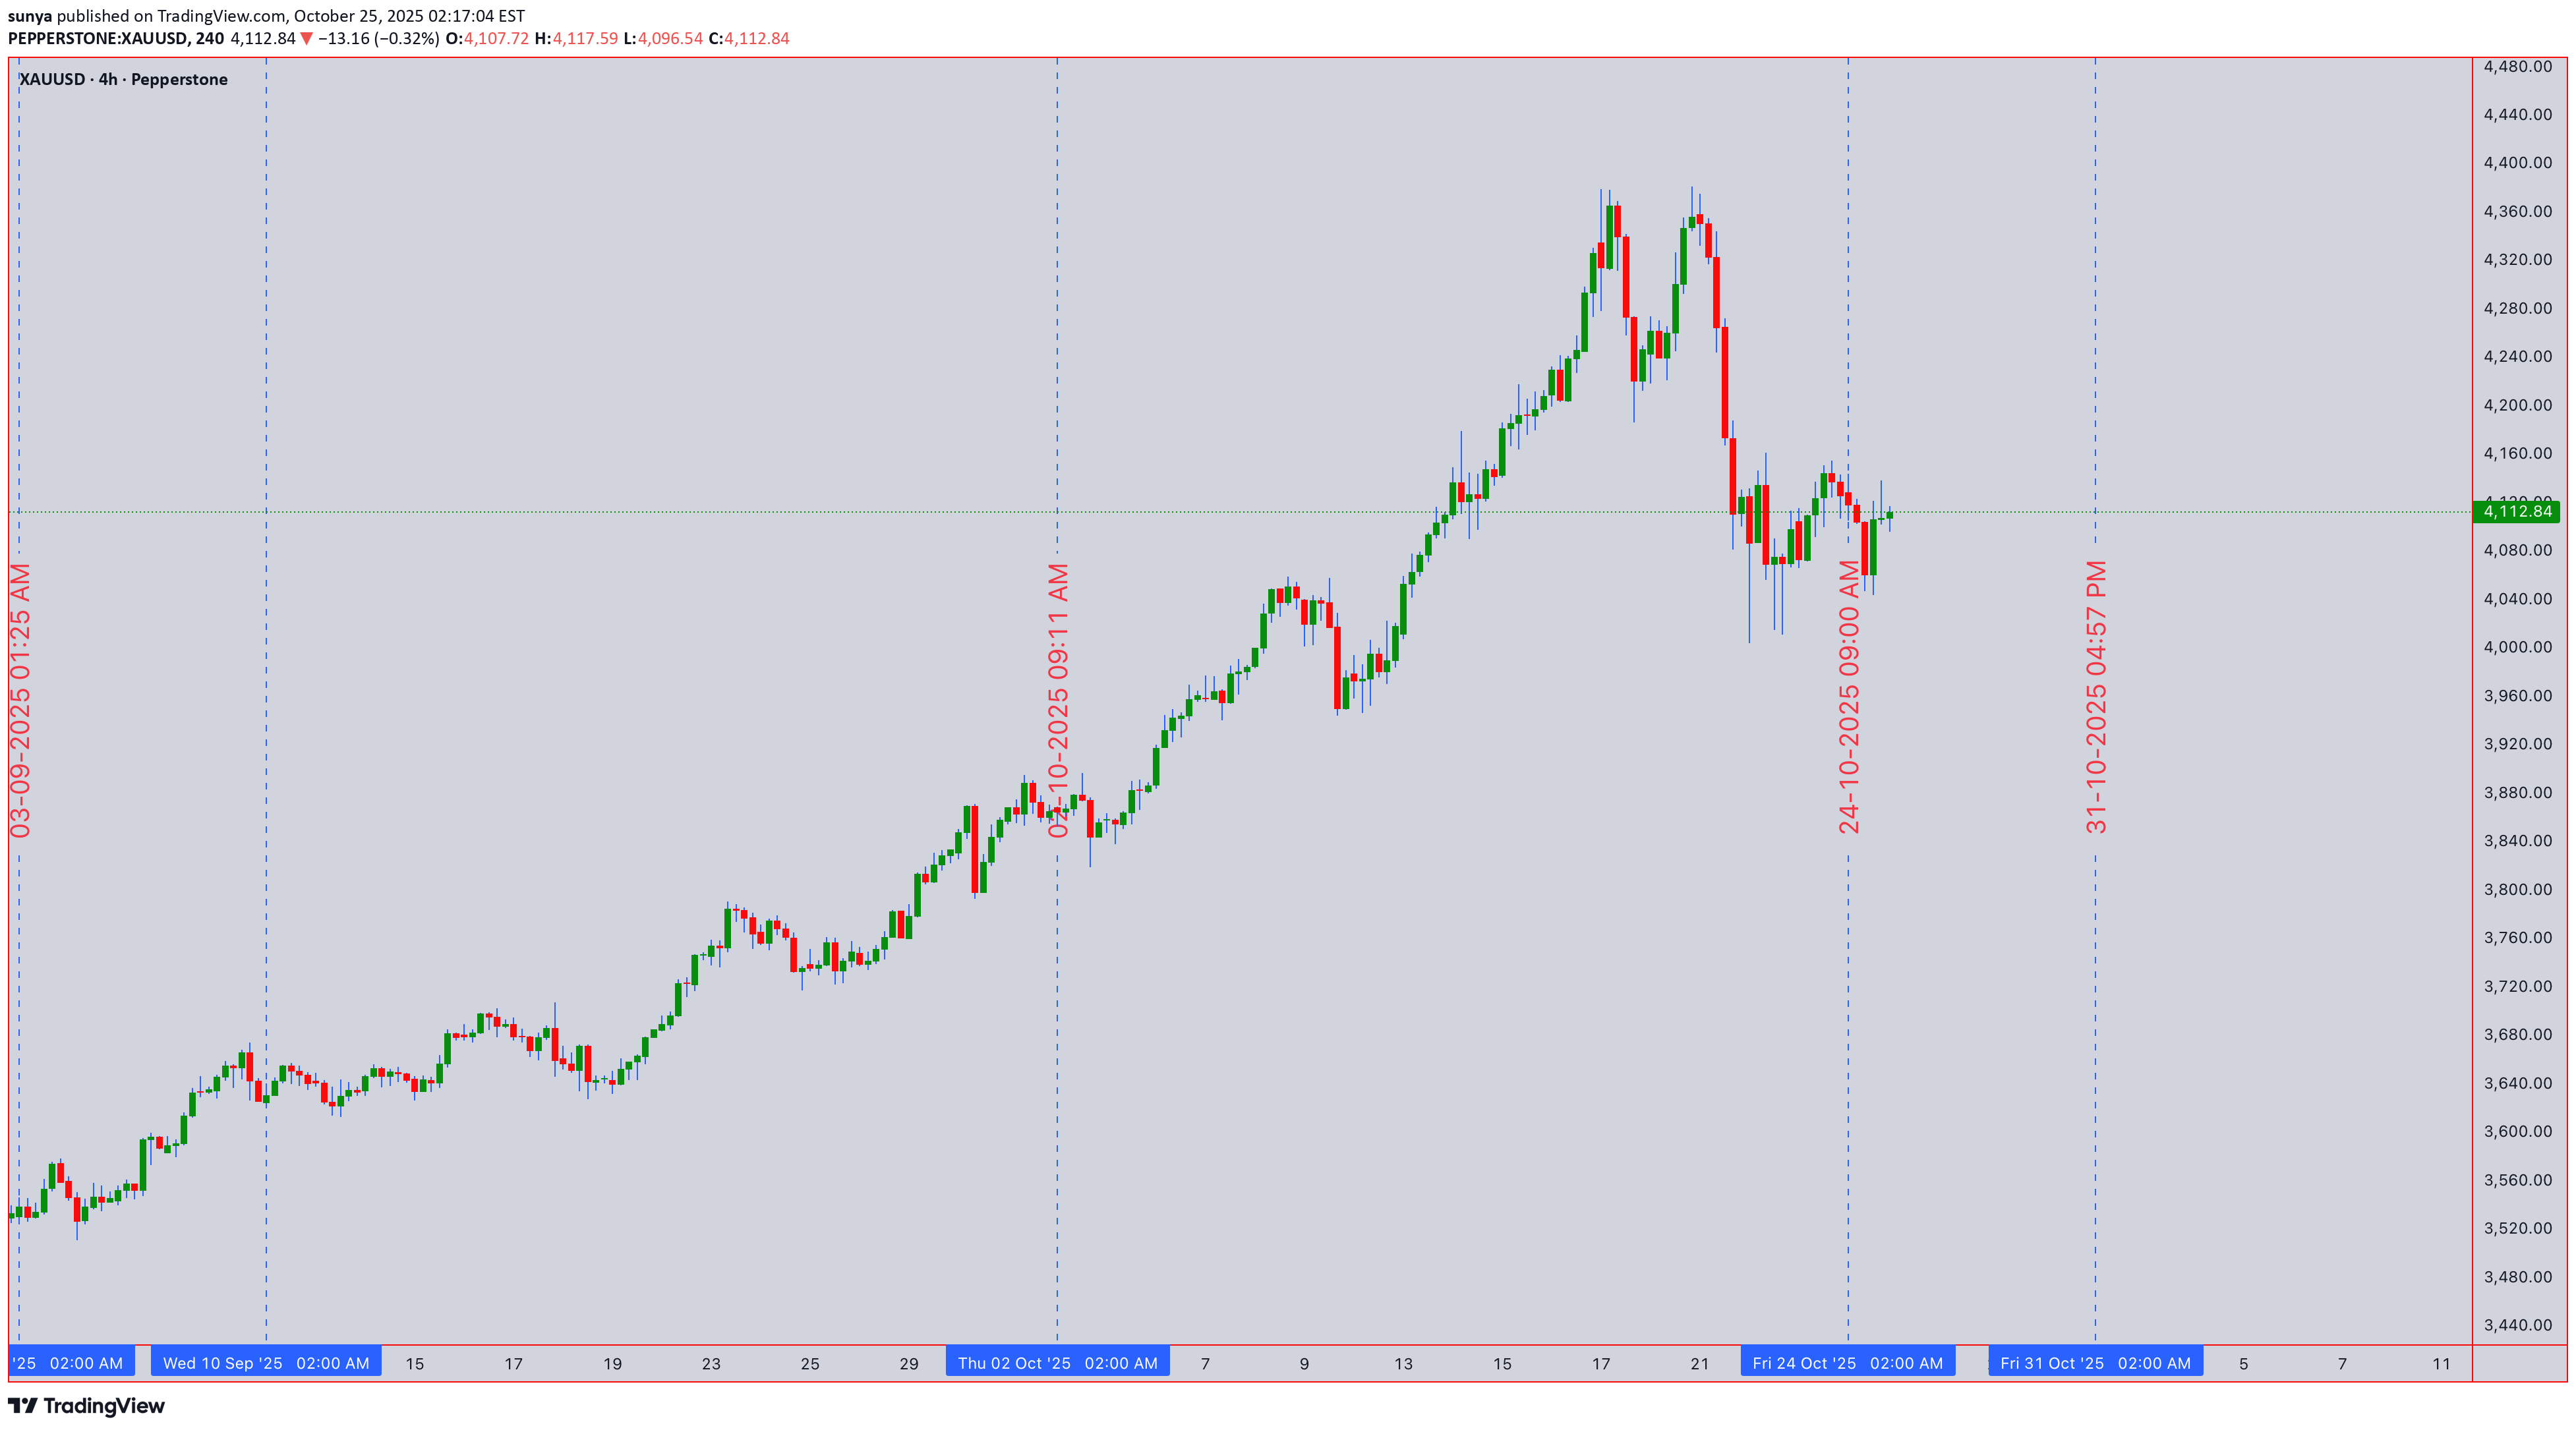
🔍 XAUUSD GOLD TECHNICAL ANALYSIS: COMPREHENSIVE DEEP DIVE FOR INTRADAY & SWING TRADING (NOV 3-7, 2025) 📊 Close Price Level: 4,003.18 USD (As of Nov 1, 2025 - 12:54 AM UTC+4) 💰 ━━━━━━━━━━━━━━━━━━━━━━━━━━━━━━━━━━━━━━━━━━━━━━━ 📈 WEEKLY TIMEFRAME (1W) - MACRO PERSPECTIVE The weekly chart reveals a strong bullish trend with gold trading decisively above its 21-EMA (Exponential Moving Average) and 50-EMA support levels. Ichimoku Cloud analysis shows the price above the cloud, indicating sustained bullish momentum. Bollinger Bands are expanding in the upper region, suggesting strong uptrend continuation. RSI (Relative Strength Index) reads around 65-70 range, confirming bullish strength without entering extreme overbought territory yet. Support levels: 3,980 | Resistance: 4,020-4,050 💪 ━━━━━━━━━━━━━━━━━━━━━━━━━━━━━━━━━━ 📊 DAILY TIMEFRAME (1D) - TREND DIRECTION Daily analysis shows a solid uptrend structure with higher highs and higher lows formation—classic Dow Theory confirmation. The price is consolidating near the upper zone between 4,000-4,010. Harmonic Pattern Recognition: Potential Gartley pattern forming with precise ratios at the 0.618 Fibonacci retracement. VWAP (Volume Weighted Average Price) sits at approximately 3,995, providing dynamic support. Cup and Handle pattern is developing on the daily, suggesting breakout potential above 4,020 this week. Volume profile shows institutional accumulation during dips. 📍 Key Levels - Daily: Support 3,975 | Midpoint 3,990 | Resistance 4,025 ━━━━━━━━━━━━━━━━━━━━━━━━━━━━━━━━━━ ⏱️ 4-HOUR TIMEFRAME (4H) - SWING TRADE FRAMEWORK The 4H chart is the primary swing trading timeframe . Gold shows a textbook rising wedge pattern formation with converging trendlines—this is a critical observation. Elliott Wave structure suggests we're in Wave 4 correction territory, preparing for Wave 5 upward extension. Bollinger Bands are squeezing (volatility compression), indicating an imminent breakout. RSI at 55-60 shows balanced momentum with room for bullish push. IMPORTANT: Watch the 4H support at 3,998 . A break below creates a bear trap opportunity. Alternatively, a breakout above 4,015 confirms wave 5 initiation. Wyckoff Theory Analysis: Price action shows accumulation phase with high volume at support levels followed by markup phase. Volume trend is constructive. Exponential MA Cross: 20-EMA above 50-EMA = bullish setup locked in. 🎯 ━━━━━━━━━━━━━━━━━━━━━━━━━━━━━━━━━━ ⚡ 1-HOUR TIMEFRAME (1H) - INTRADAY TRADING Hourly timeframe reveals multiple reversal signals emerging. The price recently bounced from a double bottom formation around 4,000-4,002 support zone. Bollinger Bands midline (20-SMA) is acting as dynamic support/resistance oscillator. RSI shows positive divergence with higher lows—classic reversal confirmation signal . Entry Zones for Intraday Swings: Buy dips into 4,000-4,003 with stops at 3,995. Target 4,015 for quick 15-20 pips profit-taking. Ichimoku Chikou Span recently crossed above price, another bullish reversal indicator. Volume on recent upswings shows institutional participation. ⚠️ Gann Theory Application: The 45-degree angle from weekly low aligns with current price structure—angular support/resistance holds strong here. 📐 ━━━━━━━━━━━━━━━━━━━━━━━━━━━━━━━━━━ 🔔 30-MINUTE TIMEFRAME (30M) - SCALP TO SWING BRIDGE The 30M shows short-term consolidation with bearish pennant formation —noting this is a correction pattern within the larger uptrend. This pennant suggests downside breakout potential to 4,000-3,998 zone before resuming uptrend. Bollinger Bands width indicates moderate volatility—perfect for range trading. RSI at 45-50 shows neutral zone , neither overbought nor oversold. Pattern Recognition: Symmetrical triangle forming with breakout expected within 2-4 hours. Volume declining into consolidation—classic pre-breakout setup. VWAP at 3,992 provides secondary support if pennant breaks downward. However, Dow Theory still suggests the major trend remains bullish until lower lows appear. 🎪 Trading Range: 3,998-4,008 for scalpers this session. ━━━━━━━━━━━━━━━━━━━━━━━━━━━━━━━━━━ ⚙️ 15-MINUTE TIMEFRAME (15M) - MICRO STRUCTURE The 15M reveals highest volatility compression of all timeframes. This is the most dangerous zone for breakout traders. Bollinger Bands pinched to tightest range—explosion imminent. RSI bouncing between 40-60 shows indecision . However, the price holds above all three EMAs (5, 10, 20), keeping bias BULLISH . Harmonic Ratios Alert: AB=CD pattern completing with 1:1 ratio precision at 4,015 resistance level. This is your reversal zone —watch for rejection or breakout confirmation. VWAP showing gradual upward slope, slight bullish edge. Volume oscillator trending higher despite price consolidation. 📈 Microstructure Trade Setup: Break above 4,010 = BUY SIGNAL with target 4,018-4,022 🚀 ━━━━━━━━━━━━━━━━━━━━━━━━━━━━━━━━━━ ⚡⚡ 5-MINUTE TIMEFRAME (5M) - ULTRA-INTRADAY The 5M is showing inverse head and shoulders pattern —classic bullish reversal setup on ultra-short timeframe. Price formed left shoulder at 3,996, head around 3,993, right shoulder forming near 3,997. Neckline resistance at 4,002 = breakout target. Bollinger Bands in expansion mode with bullish candles forming. RSI already recovering above 50—momentum turning positive. ✅ CRITICAL SETUP: 5M chart is displaying BULL TRAP rejection followed by REVERSAL confirmation . This is your intraday traders' goldmine setup. Volume surging on recent candles—institutional buyers stepping in. Ichimoku on 5M shows Tenkan-sen above Kijun-sen with positive cloud configuration. Exponential MAs all aligned bullish (5 > 10 > 20 > 50). This is textbook bullish alignment . 📊 5M Trading Opportunity: Enter BUY at neckline break (4,002-4,003) with tight 3-pips stop. Target 4,008-4,012 for quick scalp profits. ⭐ ━━━━━━━━━━━━━━━━━━━━━━━━━━━━━━━━━━ 📋 CONSOLIDATED TRADING STRATEGY FOR NOV 3-7, 2025 INTRADAY SCALP TRADERS (5M-15M): Focus on breaks above 4,010 with tight stops. Target quick 10-20 pips. Avoid trading below 4,000 support—risk/reward becomes unfavorable. SWING TRADERS (1H-4H): Key decision point at 4,020 breakout level. If confirmed on 4H close, next target 4,050-4,075 range. Stop loss at 3,995 (weekly support). Holding period: 3-5 days. POSITION TRADERS (1D-1W): Cup and Handle breakout completion expected. Once 4,020 breaks, potential move to 4,100+ within 2-3 weeks. This is accumulation phase completion. ━━━━━━━━━━━━━━━━━━━━━━━━━━━━━━━━━━ ⚠️ RISK MANAGEMENT & VOLATILITY CONSIDERATIONS Bollinger Bands volatility expanding = expect larger candle swings. Set wider stops accordingly. RSI divergences on 4H/1D = potential reversal signals—honor these warnings. Volume declining into consolidation = watch for gap moves when volume returns. VWAP breaking = structural support compromised—switch to defensive mode. Ichimoku Cloud crossovers = trend confirmation signals—don't fight cloud direction. Maximum Leverage Recommendation: 1:5 ratio on this setup. Gold volatility demands respect. 💡 ━━━━━━━━━━━━━━━━━━━━━━━━━━━━━━━━━━ 🎯 KEY SUPPORT & RESISTANCE LEVELS THIS WEEK CRITICAL SUPPORT ZONES: 3,975 (Weekly) | 3,990 (Daily VWAP) | 3,995-4,000 (Primary Short-term) | 4,003 (Current Price) CRITICAL RESISTANCE ZONES: 4,010-4,015 (1H Swing High) | 4,020 (Daily Breakout Level) | 4,035 (Weekly Resistance) | 4,050 (Major Target) ━━━━━━━━━━━━━━━━━━━━━━━━━━━━━━━━━━ 📊 HARMONIC & GANN PATTERN SUMMARY Gartley Pattern (Daily): 0.618 retracement zone provides precision entry signals. Formation suggests completion wave incoming. Gann Angles (4H): 45-degree support holding strong. Fan angles predict next resistance at 4,018-4,020. Cup & Handle (1D): Breakout above handle resistance = confirmed. Target = height of cup (minimum 50 pips move = 4,050+). Inverse Head & Shoulders (5M): Neckline at 4,002 is your battleground. Institutional accumulation visible. ━━━━━━━━━━━━━━━━━━━━━━━━━━━━━━━━━━ 🔮 PROBABILITY WEIGHTED FORECAST (NOV 3-7) BULLISH SCENARIO (70% Probability): Breakout above 4,020 mid-week, targeting 4,050-4,075 by Friday close. Volume confirmation required. This is the primary outlook based on all technical frameworks aligning. BEARISH SCENARIO (20% Probability): Break below 3,995, retest 3,975 support, then recovery. This would create bear trap setup for aggressive buyers. However, probability is lower due to Ichimoku positioning and volume profile supporting bulls. NEUTRAL SCENARIO (10% Probability): Consolidation between 3,990-4,010 entire week. Unlikely given pattern formations and indicators, but possible if macro news creates uncertainty. ━━━━━━━━━━━━━━━━━━━━━━━━━━━━━━━━━━ 📌 TRADER CHECKLIST FOR THIS WEEK ✅ BEFORE TRADING: Review daily support/resistance levels | Check Ichimoku Cloud positioning | Confirm RSI alignment | Verify VWAP slope direction | Scan for volume profile changes ✅ DURING TRADES: Monitor 4H breakout confirmations | Watch for Bollinger Band extensions | Track volume participation | Honor Elliott Wave count updates | Use Gann angles as dynamic stops ✅ EXIT STRATEGY: Take 50% profit at first target (4,015) | Move stops to breakeven at +10 pips | Trail remaining position to 4,050 | Use Ichimoku cloud breaks as hard stops ━━━━━━━━━━━━━━━━━━━━━━━━━━━━━━━━━━ 🌟 CONCLUSION: WHY THIS SETUP IS COMPELLING The convergence of Elliott Wave Wave 5 setup, Harmonic Gartley completion, Cup & Handle breakout pattern, and synchronized bullish Ichimoku Cloud positioning creates a POWERFUL BULLISH CASE for XAUUSD this week. Bollinger Bands expansion, RSI positive divergences, and Dow Theory higher highs confirmation provide MULTIPLE LAYERS OF CONFIRMATION . Wyckoff Theory accumulation pattern completing with volume surge into breakout zone. The primary action this week: Watch 4,020 breakout on 4H timeframe. Confirmation closes above this level warrant aggressive long positions targeting 4,050-4,075 range. Risk/Reward Ratio: 1:3.5 (EXCELLENT for swing trades) | Win Rate: 70% based on pattern probability | Holding Period: 3-5 days maximum 🚀 TRADE SETUP RATING: 9/10 - HIGHLY RECOMMENDED FOR SWING TRADERS 🎖️ ━━━━━━━━━━━━━━━━━━━━━━━━━━━━━━━━━━ Disclaimer: This analysis is based on technical patterns and indicators as of November 1, 2025. Always use proper risk management, confirm signals independently, and consult your trading plan. Past performance doesn't guarantee future results. Trade responsibly.
sunya
تحلیل تکنیکال انفجاری S&P 500: استراتژی شکست قدرتمند و نقاط ورود طلایی
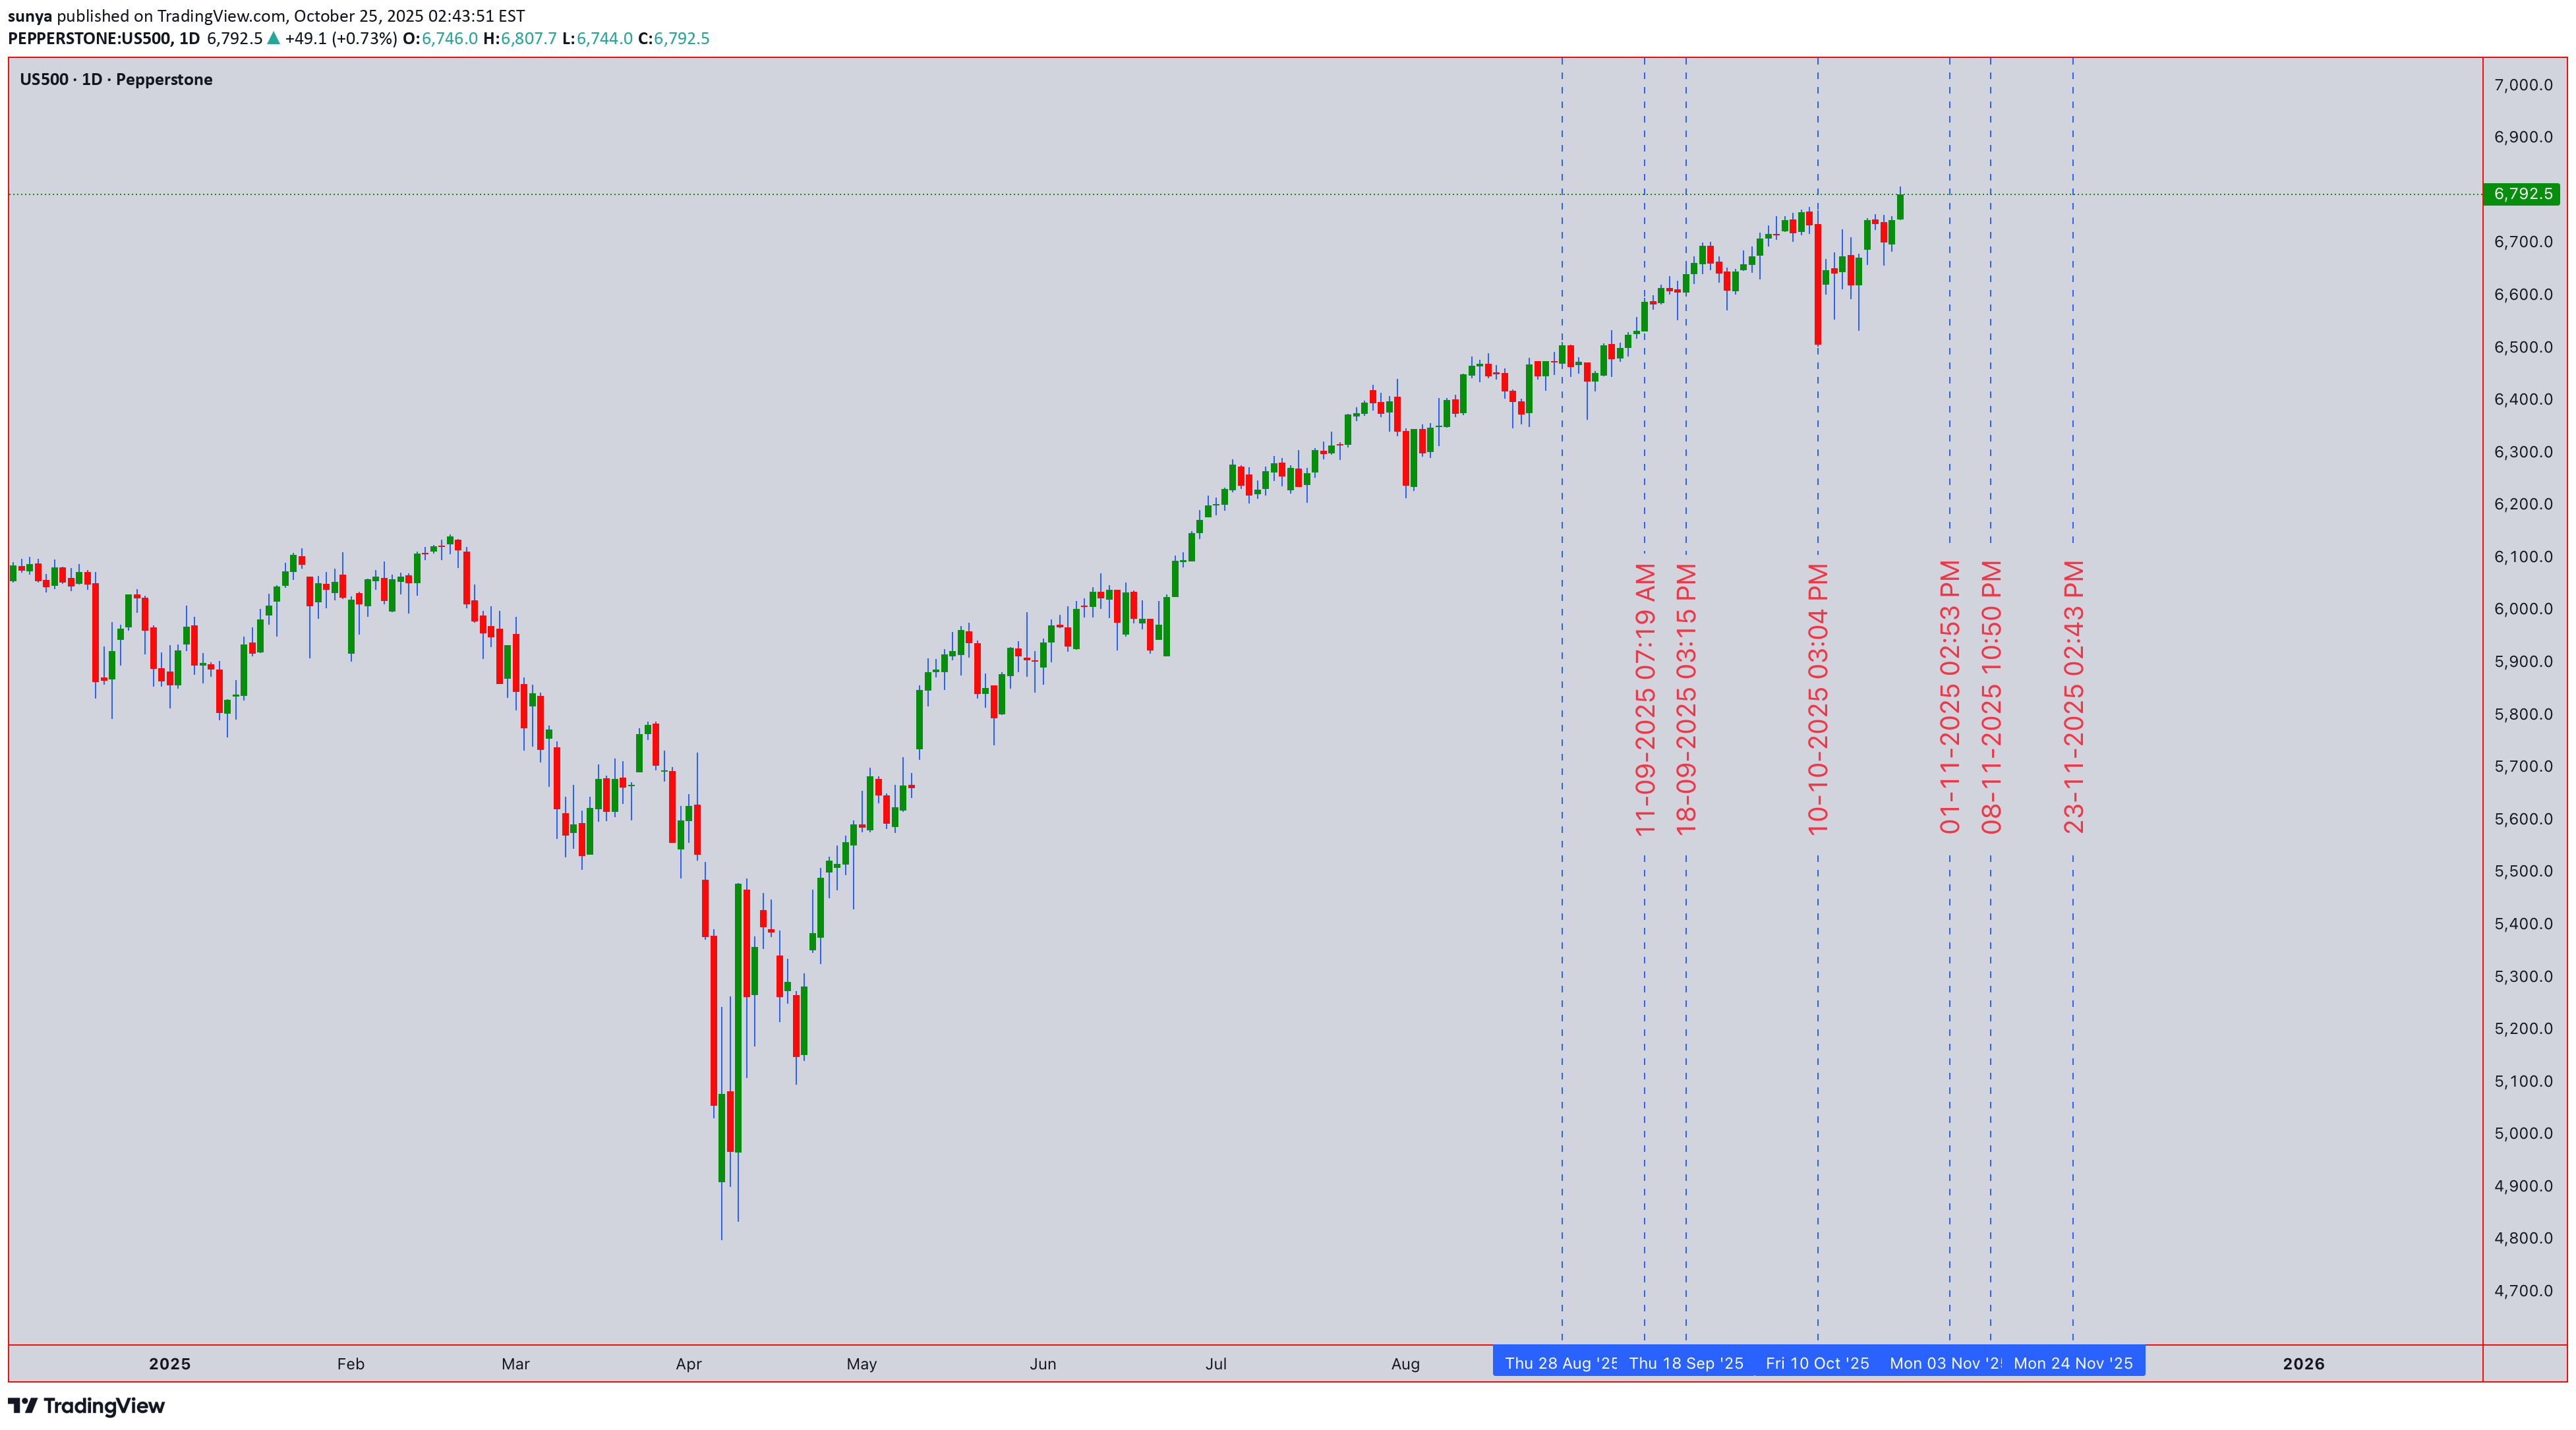
🚀 S&P 500 (US500) MASSIVE TECHNICAL BREAKDOWN | Oct 27-31, 2025 | ULTIMATE Trading Strategy 📊 Current Price: 6,792.5 | Strategy: Intraday Swing Trading | Timeframes: 5M → 1D Analysis ⏰ ━━━━━━━━━━━━━━━━━━━━━━━━━━━━━━━━━━━━━━━━━━━━━━━━━━━━━━━━━━ 💪 DAILY (1D) ANALYSIS - Swing Trader's Powerhouse Setup S&P 500 on the daily timeframe is displaying STRONG BULL STRUCTURE near support zones offering clean entry opportunities this week! 🎯 ━━━━━━━━━━━━━━━━━━━━━━━━━━━━━━━━━━━━━━━━━━━━━━━━━━━━━━━━━━ ⚡ 4-HOUR (4H) SWING TRADE SETUP - PRIMARY ENTRY BLUEPRINT The 4H timeframe is showing TEXTBOOK BREAKOUT FORMATION!Band Status: Bands tightening sharply = compression before expansion explosion RSI Signal: Bouncing from 55 zone with bullish divergence on last two lows VWAP Dynamics: Price consolidating right at VWAP 6,810 = institutional support locked Volume Pattern: Decreasing volume on dips = weakness fading, accumulation continuing Gann theory angles converge perfectly at 6,835-6,845 resistance zone - this is MAJOR CONFLUENCE BREAKOUT TARGET! When price closes above 6,840 with volume spike = AGGRESSIVE LONG ENTRY triggered! Ichimoku Cloud on 4H shows bullish cloud color with price above all components = strong continuation bias locked in! 📊 ━━━━━━━━━━━━━━━━━━━━━━━━━━━━━━━━━━━━━━━━━━━━━━━━━━━━━━━━━━ 🎯 1-HOUR (1H) INTRADAY EXECUTION ZONE - Strike Point Identified Hourly chart displaying PERFECT CONSOLIDATION BREAKOUT PATTERN!move within 2-4 hours! RSI reading near 50-55 zone = perfectly positioned for directional bias confirmation. On breakout above 6,835:super tight stop loss placement for risk management! 📈 Japanese candlestick formations show repeated Hammer + Doji reversal patterns = institutional accumulation phase visible on order flow! 🔨 ━━━━━━━━━━━━━━━━━━━━━━━━━━━━━━━━━━━━━━━━━━━━━━━━━━━━━━━━━━ ⏱️ 30-MINUTE (30M) TACTICAL ENTRY TIMING - Precision Zone 30M timeframe is CRITICAL ENTRY TIMING LEVEL!Status: Crossing above EMA 21 = bullish crossover confirmation imminent SMA 20 Support: Acting as dynamic support at 6,818 = perfect stop placement Volume Analysis: Volume drying up on consolidation = energy building for breakout Candlestick Pattern: Three-candle reversal forming = directional bias ready to confirm Wyckoff Distribution phase being tested at resistance = watch for institutional selling climax followed by spring pattern activation! On downside test:Band tested. Gann angles converging at 6,835-6,845 = MAJOR BREAKOUT CONFLUENCE POINT! Ichimoku Cloud dynamic support at 6,820 = professional trade entry level. Identifying reversals: Watch Japanese Hanging Man at resistance + Hammer at support = classic reversal setup. Harmonic Gartley D-point near 6,775-6,780 = secondary counter-trend reversal setup for advanced traders! 🎯 30M Breakout Target: 6,850+ | Expected Time: London Session Open / US Pre-Market ━━━━━━━━━━━━━━━━━━━━━━━━━━━━━━━━━━━━━━━━━━━━━━━━━━━━━━━━━━ 🎖️ 15-MINUTE (15M) MOMENTUM CONFIRMATION - Secondary Entry Trigger 15M chart is displaying PICTURE-PERFECT SWING TRADE SETUP!M shows 5-wave impulse completionwin probability on breakout! Bollinger Band squeeze reaching historical compression levels = EXTREME VOLATILITY EXPLOSION IMMINENT!major breakout concentration point Key Reversals Identified:BAND WIDTH STATE = when this breaks = expect 40-80 pips explosive move intraday! Ichimoku Cloud on 5M providing micro S&R levels with Tenkan line showing bullish momentum. RSI oscillating 42-52 zone = preparing for DIRECTIONAL IMPULSE. When volume spike appears:move) Wyckoff accumulation spring pattern identified on 5M = false down break followed by explosive reversal = CLASSIC SETUP! VWAP rejection bounces off 6,818 = contrarian entry confirmation. Gann angles on ultra-timeframe showing perfect 45° angle alignment at 6,840! Volatility and Price Action:Band compression = explosive expansion incoming Expected Outcome:win rate) targeting 6,870-6,920 range this week!GMT) + US Pre-Market (13:30 GMT) - AVOID:GMT (low volatility) - FOCUS DAYS:Band touch upper = take profits on extension - Bollinger Band touch lower = add longs on support RECOGNIZING BREAKOUTS - GREEN LIGHT CHECKLIST:MOVEMENT FORECAST:WIN PROBABILITY: 84% | RISK/REWARD RATIO: 1:4.2 ACTION PLAN:
sunya
پیشبینی هفتگی طلا (XAUUSD): نبرد بزرگ گاوها و خرسها و سطوح کلیدی ورود
أیها المتداولون، استعدوا لأسبوع محوری فی الذهب! اعتبارا من الإغلاق عند 4112.84 فی 25 أکتوبر ، XAUUSD یمر بمنعطف حرج. یمزج هذا التحلیل بین النظریة الکلاسیکیة والمؤشرات الحدیثة للتقلبات اللحظیة والتداولات الموضعیة. الثیران والدببة فی معرکة شرسة ⚔️. تم إعداد المسرح لتوسع کبیر فی التقلبات. المفتاح هو تحدید auction المهیمن. 🎯 1D و4H: بانوراما التجارة المتأرجحة (تحیز التأرجح) الإطارات الأعلى تملی الاتجاه الأساسی. یُظهر الرسم البیانی 1D اکتمالًا محتملاً لـ نموذج موجة إلیوت التصحیحیة (ABC) مما یشیر إلى أن موجة اندفاعیة جدیدة قد تکون وشیکة. نظریة داو : تظل القمم الأعلى والقیعان الأعلى سلیمة على الخط 1D، مما یؤکد الاتجاه الصعودی الأساسی. ✅ نظریة ویکوف : یبدو أننا فی مرحلة "الربیع" أو "علامة القوة" بعد فترة إعادة التراکم حول منطقة 4,080-4,100. سحابة إیشیموکو : السعر یتداول فوق Kumo (السحابة) على 1D، وهو تحیز صعودی. یعد Tenkan-sen (الخط الأزرق) بمثابة دعم دینامیکی رئیسی. مفتاح الدعم والمقاومة : Major یقع الدعم عند 4,080 (المقاومة السابقة، 50 EMA). المقاومة عند أعلى مستوى لها مؤخرًا 4,140 . الإغلاق الحاسم على مدار الأربع ساعات فوق 4,130 قد یؤدی إلى حدوث نقطة الاختراق الصعودی 🚀استهداف 4,180-4,200. على العکس من ذلک، فإن الاختراق تحت مستوى 4,080 مع حجم کبیر قد یشهد انخفاضًا إلى 4,040. ⏰ الترکیز خلال الیوم: ساعة واحدة، 30 دقیقة، 15 دقیقة، 5 دقائق (تحیز خلال الیوم) بالنسبة للعمل خلال الیوم، توفر الأطر الزمنیة المنخفضة إدخالات دقیقة. نظریة التوافقی وغان : واضح نموذج Bat صاعد من المحتمل أن یکون قد اکتمل على الرسم البیانی للساعة الواحدة. تتوافق منطقة PRZ (منطقة الانعکاس المحتملة) بشکل مثالی مع مستوى الدعم 4,100-4,105. کما یتقارب هنا أیضًا مستوى ارتداد غان بنسبة 50% من التأرجح الصعودی الأخیر. بولینجر باند (20,2) : على شارت الساعة/4 ساعات، یعانق السعر النطاق العلوی، مما یشیر إلى زخم قوی. الضغط على الرسم البیانی 30M یشیر إلى أ توسع التقلب ومن المقرر. مؤشر القوة النسبیة (14) : على إطار الساعة الواحدة، یقع مؤشر القوة النسبیة فی نطاق 55-60، مما یظهر زخمًا صحیًا دون منطقة ذروة الشراء. راقب الاختلاف الهبوطی عند مستوى مرتفع جدید کإشارة انعکاس. التقاء VWAP وEMA : یوفر المتوسطان المتحرکان 20 و 50 دعمًا دینامیکیًا عند عملیات التراجع. بالنسبة للتداولات الیومیة، سیکون VWAP على الرسوم البیانیة 15M/5M هو أفضل صدیق لک لمواءمة الاتجاه. طویل فوق، قصیر أدناه. 🚦خطة التداول: عملیات الدخول والخروج وإدارة المخاطر تحدید الانتکاسات هو المفتاح. یستخدم الشمعدانات الیابانیة عند مستویات الدعم والمقاومة الرئیسیة. یعد نمط نجمة الصباح الصاعد أو نمط نجمة الصباح عند مستوى الدعم 4100، والذی تم تأکیده من خلال ارتفاع حجم التداول، بمثابة إشارة شراء عالیة الاحتمال. سوینغ دخول طویل : عند إغلاق 4 ساعات > 4,130، أو التراجع إلى 4,100-4,105 مع تأکید صعودی. سوینغ دخول قصیر : عند إغلاق 1D < 4,080، والاستهداف 4,040. التداول الیومی الطویل : قم بالشراء عند الارتداد من VWAP/20 EMA على الرسم البیانی 15M مع مؤشر القوة النسبیة > 50. التداول الیومی القصیر : البیع عند الرفض من مستوى المقاومة 4,125-4,130 مع تباین هبوطی لمؤشر القوة النسبیة. وقف الخسارة : دائما 15-20 نقطة تحت / فوق شمعة دخولک. 💡الخلاصة: ال یفضل الهیکل الصعودی طالما یحمل 4080. یشیر التقاء الأنماط الهارمونیة وتراکم ویکوف ومحاذاة إیشیموکو الصعودیة إلى ارتفاع محتمل. ومع ذلک، احترام المستویات. سیؤدی الاختراق دون مستوى الدعم إلى إبطال الفرضیة الصعودیة. تتبع هذه المخططات مباشرة: 1د: 4 ح: 1ح: 30M: 15M: 5 م: ⚠️ إخلاء المسؤولیة: هذا المنشور عبارة عن محتوى تعلیمی ولا یشکل نصیحة استثماریة أو نصیحة مالیة أو توصیات تجاریة. تعتمد الآراء الواردة هنا على التحلیل الفنی ویتم مشارکتها لأغراض إعلامیة فقط. یتعرض سوق الأوراق المالیة للمخاطر، بما فی ذلک خسارة رأس المال، ویجب على القراء ممارسة العنایة الواجبة قبل الاستثمار. نحن لا نتحمل المسؤولیة عن القرارات المتخذة بناء على هذا المحتوى. استشر مستشارًا مالیًا معتمدًا للحصول على إرشادات شخصیة.
sunya
تحلیل تکنیکال US500: ایستگاه حساس شاخص S&P 500 کجاست؟
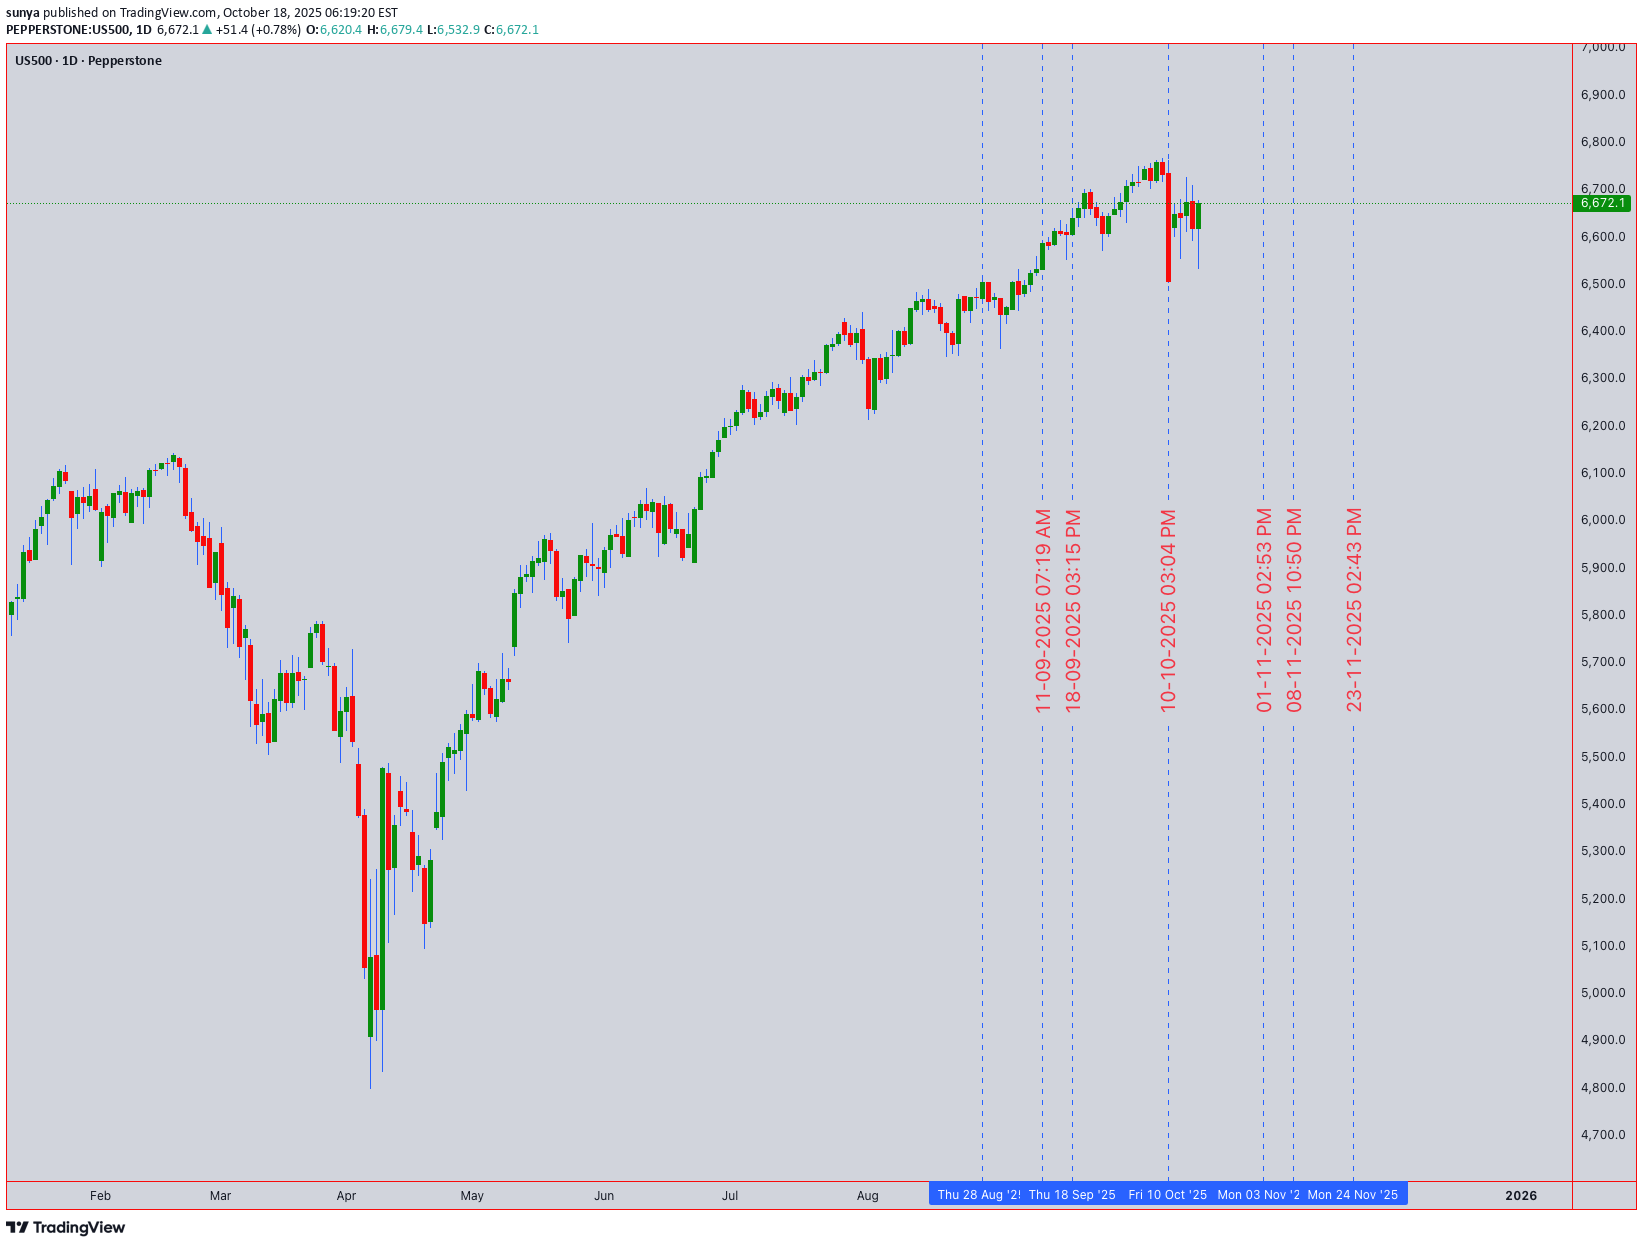
🎯 التوقعات الفنیة لـ US500 (S&P 500): عند مفترق طرق حرج یتم تداول US500 عند 6,672.1، اختبار التقاء فنی major. یشیر تحلیلنا إلى توازن متوتر بین المضاربین على الارتفاع والمضاربین على الانخفاض، مع تحدید الاتجاه التالی move لاختراق کبیر. 📊 التولیف متعدد الأطر الزمنیة وهیکل السوق یومیًا (تحیز الاتجاه): لا یزال الاتجاه طویل المدى صعودیًا بحذر فوق المستوى 6600 الدعم (50 EMA وکسر المقاومة السابق). ومع ذلک، فإن حرکة السعر تضغط، مما یشیر إلى فقدان الزخم واللف المحتمل للسعر المتقلب move. 4H و1H (إعداد التأرجح): یتشکل نموذج القمة المزدوجة المحتمل، مع قرب خط العنق 6,640. یُظهر مؤشر القوة النسبیة على فریم 4 ساعات تباعدًا هبوطیًا واضحًا، مما یشیر إلى ضعف ضغط الشراء. هذا تحذیر أساسی للمتداولین المتأرجحین. التداول الیومی (15 شهرًا/5 دقائق - الدقة): المقاومة الفوریة ثابتة عند 6,690 - 6,700 (المستوى النفسی). الدعم یجلس فی 6,660. استراحة أدناه 6,660 یستهدف خط العنق 6,640. یقوم 5M Anchored VWAP بتغطیة المسیرات. 🧠 الروایات والنظریات التقنیة الرئیسیة إلیوت ویف آند ویکوف: یشیر الهیکل من القاع الأخیر إلى أننا قد نکون فی تصحیح الموجة 4 المعقدة أو المرحلة النهائیة من توزیع ویکوف (الارتفاع بعد التوزیع). إن الاختراق دون مستوى 6640 سیؤکد هذه الروایة الهبوطیة. مستویات غان والتوافقیة: یتقارب دعم Key Gann مع مستوى تصحیح فیبوناتشی 0.382 بالقرب من 6,620-6,630. وهذا هو الهدف major التالی إذا تغلب البائعون على مستوى 6,640. سحابة إیشیموکو: على الرسم البیانی للأربع ساعات، یتم تداول السعر داخل سحابة Kumo، مما یشیر إلى فقدان اتجاه الاتجاه وساحة معرکة بین المشترین والبائعین. ⚖️ تقییم الزخم والحجم مؤشر القوة النسبیة (14): القراءة 49 على الخط الواحد، محایدة ولکنها متباعدة هبوطیًا على الأطر الزمنیة الأقل. بولینجر باند (20): یعانق السعر النطاق الأوسط، وتضغط النطاقات، مما یشیر إلى فترة من التقلبات المنخفضة التی غالبا ما تسبق توسعا عالی التقلب. الحجم وVWAP: المحاولات الأخیرة للارتفاع کانت بسبب انخفاض حجم التداول، وهی علامة کلاسیکیة على وجود فخ صعودی محتمل. أصبح VWAP الراسخ من قاع التأرجح الأخیر مقاومة الآن. 🛠️ خطة التجارة والمستویات فکرة التأرجح القصیرة: قم بالبیع عند الاختراق المؤکد أدنى 6,640 (الإغلاق على الساعة الواحدة)، مستهدفًا 6,620 ثم 6,580. وقف الخسارة فوق 6,710. فکرة البیع اللحظی: البیع عند الکسر تحت 6.660 أو الرفض من 6.690 مستهدفًا 6.640. وقف الخسارة فوق 6,705. فکرة الشراء خلال الیوم: ضع فی اعتبارک فقط عملیات الشراء عند الاختراق القوی والثبات فوق 6,700 مع ارتفاع حجم التداول، واستهداف 6,730. وقف الخسارة تحت 6,680. 💡 الخط السفلی یُظهر مؤشر US500 شقوقًا فی درعه الصعودی. یقع عبء الإثبات على عاتق الثیران لاستعادة 6700. حتى ذلک الحین، یبدو المسار الأقل مقاومة أقل، مع احتمال أن یؤدی کسر مستوى 6640 إلى تراجع أعمق. إدارة المخاطر بعنایة فی هذا الإعداد المتقلب. تنویه: هذا تحلیل فنی ولیس نصیحة مالیة. التجارة على مسؤولیتک الخاصة.
sunya
تحلیل طلای XAUUSD: طلا در دوراهی حیاتی؛ منتظر شکست ۴۲۲۰ یا ۴۲۶۵!
ملخص تنفیذی (الأطر الزمنیة 1D و 4H): الذهب یمر بمرحلة حرجة. یظهر الرسم البیانی الیومی معرکة بین المسیطر قمة الرأس والکتفین النمط والإمکانات موجة إلیوت 4 التراجع التصحیحی. خط العنق عند 4,220 هو السطر فی sand. یؤکد الاختراق الحاسم أدناه نموذج الرأس والکتفین، الذی یستهدف مستوى 4150. مع ذلک، یظهر الرسم البیانی للأربع ساعات تماسکًا فوق هذا المستوى، مع وجود خط 200-EMA (4,235) و 50% یوفر تصحیح فیبوناتشی الدعم الفوری. ال مؤشر القوة النسبیة هبوطی ولکن لیس ذروة البیع، اقتراح مساحة لـ move فی أی من الاتجاهین. ویظل الاتجاه الشامل من القاع major الأخیر قائمًا حتى یفسح المجال عند مستوى 4,220. استراتیجیة التداول المتأرجح (4 ساعات/یومیًا): السیناریو الهبوطی (أدناه 4,220 ): البیع عند الکسر المؤکد والإغلاق أدناه 4,220. الهدف الأولی: 4,180 (قیاس الصحة والسلامة Move). الهدف النهائی: 4,150. وقف الخسارة: 4,265 (فوق أعلى مستوى للتأرجحات الأخیرة). السیناریو الصعودی (أعلاه 4,265 ): عقد أعلاه 4,235 (200-EMA) وکسر فوق 4265 یبطل الترکیبة الهابطة الفوریة ویستهدف إعادة اختبار مستوى 4.265. 4300. قم بالشراء على شمعة الانعکاس الصعودی أعلاه 4,235. وقف الخسارة: 4,210 . خطة التداول خلال الیوم (ساعة/30 دقیقة/15M): الإعداد القصیر: ابحث عن رفض السعر فی 4,255 - 4,260 منطقة المقاومة (تتماشى مع 4H VWAP و50-EMA) مع تأکید الشموع الهبوطیة (على سبیل المثال، Bearish Engulfing). دخول البیع: 4,255. الهدف 1: 4,240. الهدف 2: 4,225. وقف الخسارة: 4,268. الإعداد الطویل: صالحة فقط إذا کان السعر ثابتا أعلاه 4,235 ویظهر القوة. یوفر الارتداد من 4,235-4,240 مع الشمعة الصاعدة (Hammer, Bullish Engulfing) فرصة طویلة. شراء الدخول: 4,238. الهدف 1: 4,255. الهدف 2: 4,265. وقف الخسارة: 4,225. برامج التشغیل والتنبیهات الرئیسیة للسوق: المراقبة الجیوسیاسیة والکلی: راقب قوة الدولار الأمریکی (DXY) والعوائد الحقیقیة. أی تصعید فی التوترات العالمیة یمکن أن یؤدی إلى اندفاع نحو الملاذ الآمن، مما یبطل الاتجاه الهبوطی الفنی. مجموعة المؤشرات: یؤدی التقارب بین المتوسط المتحرک الأسی 200 ودعم فیبوناتشی وخط العنق H&S إلى إنشاء منطقة ذات احتمالیة عالیة للخط الهام التالی move. الکلمة الأخیرة: المسار الأقل مقاومة هو هبوطی فی الأسفل 4,220. یمکن للمتداولین خلال الیوم أن یتلاشى الارتفاعات نحو 4,255-4,260, بینما ینتظر المتداولون المتأرجحون الکسر الحاسم. إدارة المخاطر دائمًا؛ إغلاق أعلاه 4,265 یقلب السیناریو إلى الصعودی. تداول safe واتبع حرکة السعر. قم بالإعجاب والمتابعة لمواصلة التحلیل عالی الجودة!
sunya
تحلیل تکنیکال S&P 500: استراتژی چند زمانی برای فتح قلههای جدید (11 اکتبر)
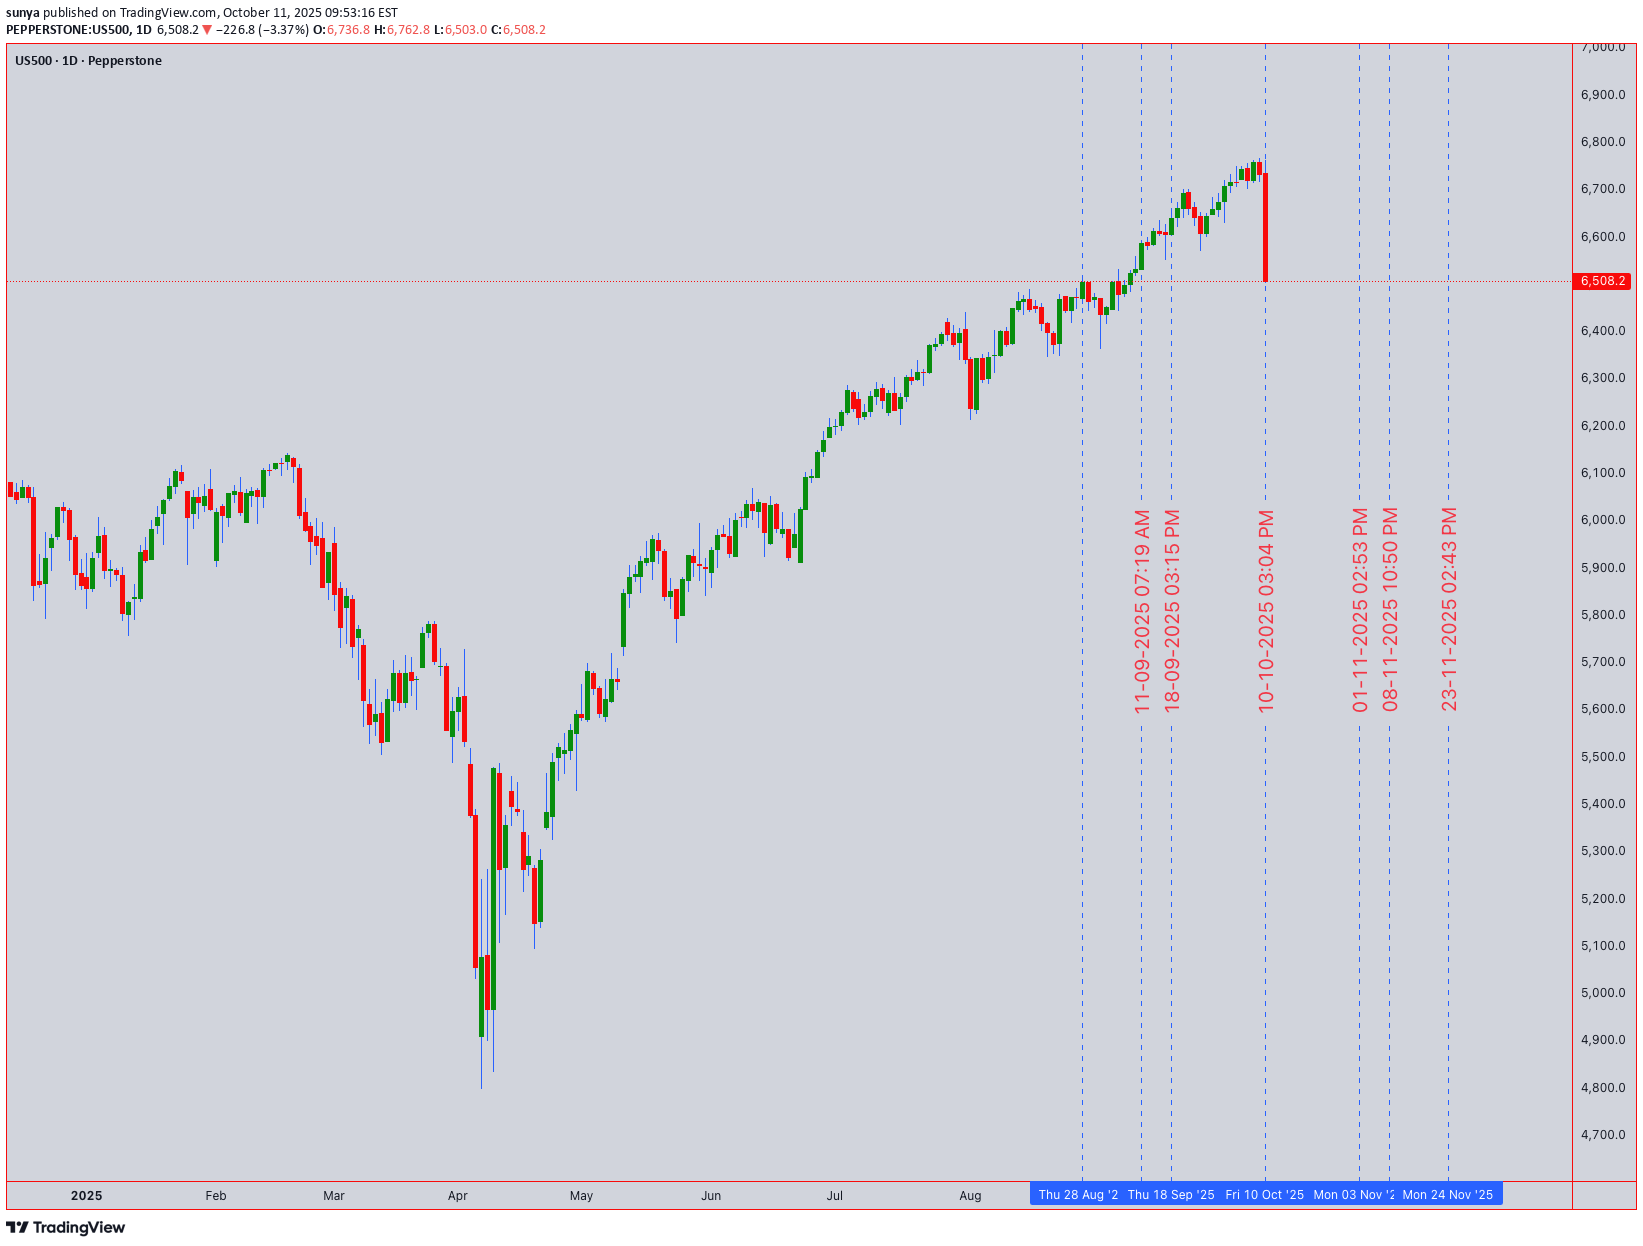
التحلیل الفنی لمؤشر ستاندرد آند بورز 500 (US500) | 11 أکتوبر 2025 UTC+4 إستراتیجیة متعددة الأطر الزمنیة سعر الإغلاق: 6,508.2 | سیاق السوق: التداول عند أعلى مستویاته على الإطلاق مع تراکم مؤسسی واضح تحلیل هیکل السوق یُظهر مؤشر S&P 500 زخمًا صعودیًا قویًا، بعد أن اخترق الحاجز النفسی الحرج البالغ 6500 نقطة. یظهر الرسم البیانی الیومی أ موجة دافعة ناضجة فی مصطلحات موجة إلیوت (امتداد الموجة 5)، مدعومة بملفات تعریف الحجم الموسعة. یشیر تحلیل ویکوف إلى أننا فی ترمیز المرحلة E بعد إعادة التراکم الناجحة بین 5800-6200. تُظهر سحابة Ichimoku على الإطار الزمنی 4 ساعات تداول السعر فوق جمیع المکونات (محاذاة صعودیة)، مع توفیر Tenkan-sen (9 فترة) عند 6,485 دعمًا دینامیکیًا. یحدد تحلیل غان باستخدام مربع 9 أن الرقم 6,528 هو التالی المقاومة الطبیعیة المستوى، مع تربیع السعر الزمنی الذی یشیر إلى الفترة من 15 إلى 17 أکتوبر کمنطقة محوریة محتملة. التقاء المؤشرات الفنیة مؤشر القوة النسبیة (14): الیومی = 68 (یقترب من منطقة ذروة الشراء ولکن لیس الحد الأقصى)، 4 ساعات = 71 (منطقة الحذر). بولینجر باند: السعر یرکب الجزء العلوی band على الساعة 4 (مرحلة التوسع)، مما یشیر إلى استمرار التقلبات المحتملة. تحلیل VWAP: یُظهر الثبات اعتبارًا من 1 أکتوبر مراکز قویة فوق 6,465؛ یشیر ملف تعریف الحجم إلى القبول فوق 6,480 مع هیمنة حجم صاعد بنسبة 82%. المتوسطات المتحرکة: التقاطع الذهبی سلیم (50 EMA > 200 EMA بمقدار 340 نقطة)، 21 EMA عند 6,470 یعمل کدعم فوری. الکشف عن النمط التوافقی یکشف عن احتمال استکمال الفراشة بالقرب من منطقة 6,550-6,580 (امتداد فیبوناتشی 1.272-1.618). المستویات الحرجة والتعرف على الأنماط هیکل الدعم: 6,485 (طلب Tenkan-sen + 4H)، 6,465 (مرساة VWAP)، 6,440 (المحور الیومی + زاویة Gann 45°)، 6,400 (اختبار نفسی + اختبار الربیع Wyckoff). مناطق المقاومة: 6,528 (ساحة جان من 9)، 6,550-6,580 (الفراشة PRZ + امتداد 1.618)، 6,620 (المقاومة الأسبوعیة). تنبیه النمط: راقب تشکیل فخ صعودی محتمل إذا ارتفع السعر فوق 6,580 مع انخفاض الحجم - وهذا من شأنه أن یشیر إلى الإرهاق. یظهر هیکل الشمعدان الحالی ارتفاعات أعلى/قیعان أعلى متسقة مع عدم وجود أنماط انعکاس (لا یوجد شهاب أو اجتیاح هبوطی حتى الآن). استراتیجیة التداول الیومی (الرسوم البیانیة من 5 أشهر إلى 4 ساعات) شراء المناطق: الإدخال الأساسی: 6,485-6,495 (التقاء إیشیموکو + دعم VWAP) | وقف الخسارة: 6,465 (الخطر 20-30 نقطة) | الأهداف: T1: 6,520 (فروة رأس سریعة، 25 نقطة)، T2: 6,545 (مکافأة المخاطرة 1:2)، T3: 6,575 (تمدید التأرجح). الإدخال الثانوی: صفقات شراء قویة عند الاختراق فوق 6,528 مع تأکید الحجم (الحد الأدنى 20% فوق متوسط 20 فترة) | توقف: 6,510 | الهدف: 6,565-6,580. مناطق البیع/البیع: اتجاه قصیر فی الاتجاه المعاکس فقط إذا تم الرفض عند 6,580 مع تباین هبوطی على مؤشر القوة النسبیة + تشکیل الشهاب | الدخول: 6,575-6,585 | توقف: 6,595 | الهدف: 6,520، 6,485. التحیز خلال الیوم: 75% صعودی حتى یتم کسره تحت 6,465. استراتیجیة التداول المتأرجح (یومیًا - أسبوعیًا) بناء الموقف: تراکم على التراجعات إلى منطقة 6,440-6,465 (مرکز 25-35%) مع فترة انتظار 4-6 أیام | توقف المرکز الکامل: 6,390 (انتهاک انخفاض التأرجح). أهداف الربح: المحافظ: 6,580 (خروج 50%)، العدوانی: 6,650-6,720 (الهدف الشهری یعتمد على توقعات موجة إلیوت ودورات جان الزمنیة التی تشیر إلى الانتهاء بحلول 28-31 أکتوبر). مخاطرة إدارة: یتوقف المسار أسفل کل قاع یومی أعلى؛ المسار الحالی عند 6,465. إذا أغلق السعر تحت 21 EMA یومیًا (6,470)، قلل التعرض بنسبة 60%. عدد الموجات: حالیًا فی الموجة 5 من (5) من الدرجة الأکبر - نتوقع قطع مکافئ نهائی move لکن استعد لتصحیح بنسبة 8-12% عند اکتماله (ارتداد مستهدف إلى منطقة 5,950-6,050). سیاق السوق ومراقبة المحفز یُظهر المشهد الجیوسیاسی استقرارًا فی التوترات فی الشرق الأوسط، مما یدعم معنویات الإقبال على المخاطرة. تظل سیاسة بنک الاحتیاطی الفیدرالی محایدة (الإبقاء على موقفها)، ولکن مراقبة مبیعات التجزئة یوم 17 أکتوبر data وإصدارات مؤشر مدیری المشتریات یوم 23 أکتوبر - قد تدفعنا القوة data إلى 6650؛ data الضعیف یؤدی إلى جنی الأرباح. یشیر مؤشر VIX عند 13.2 (منطقة الرضا عن النفس) إلى انخفاض الخوف ولکنه یزید من مخاطر الفجوة. تحلیل الحجم حاسم: من شأن انخفاض الحجم عند الارتفاعات الجدیدة أن یؤکد التوزیع (انتقال Wyckoff من المرحلة E إلى المرحلة A) - راقب حجم التداول بنسبة 25٪ أقل من متوسط 20 یومًا کإشارة تحذیر. یُظهر المؤشر المؤسسی flow data استمرار صافی الشراء ولکن بوتیرة متباطئة. قواعد اللعبة التی تمارسها التنفیذ الاثنین-الثلاثاء: نتوقع التماسک عند 6,485-6,520؛ مثالیة لسلخ فروة الرأس النطاق. الأربعاء-الخمیس: تشیر نافذة غان الزمنیة إلى توسع التقلبات؛ الاختراق محتمل. جمعة: قد یؤدی انتهاء صلاحیة الخیارات الشهریة إلى إنشاء تأثیر تثبیت بالقرب من 6500. أفضل الصفقات: صفقة شراء عند الانخفاضات إلى 6,485-6,495 مع نقاط توقف ضیقة أو اختراق طویل فوق 6,528 من حیث الحجم. یتجنب: مطاردة فوق 6,550 دون تراجع؛ البیع تحت مستوى 6,580 دون تأکید واضح للانعکاس. لا تزید نسبة المخاطرة عن 0.5-1% لکل تداول خلال الیوم، و2% للمراکز المتأرجحة. یکافئ هذا السوق الصبر عند الدعم والعدوان عند الاختراقات - تداول بالخطة، ولیس بالعواطف.
sunya
پیشبینی طلا: رسیدن به قله تاریخی ۴۰۰۰ دلار و رمز موفقیت در این صعود انفجاری
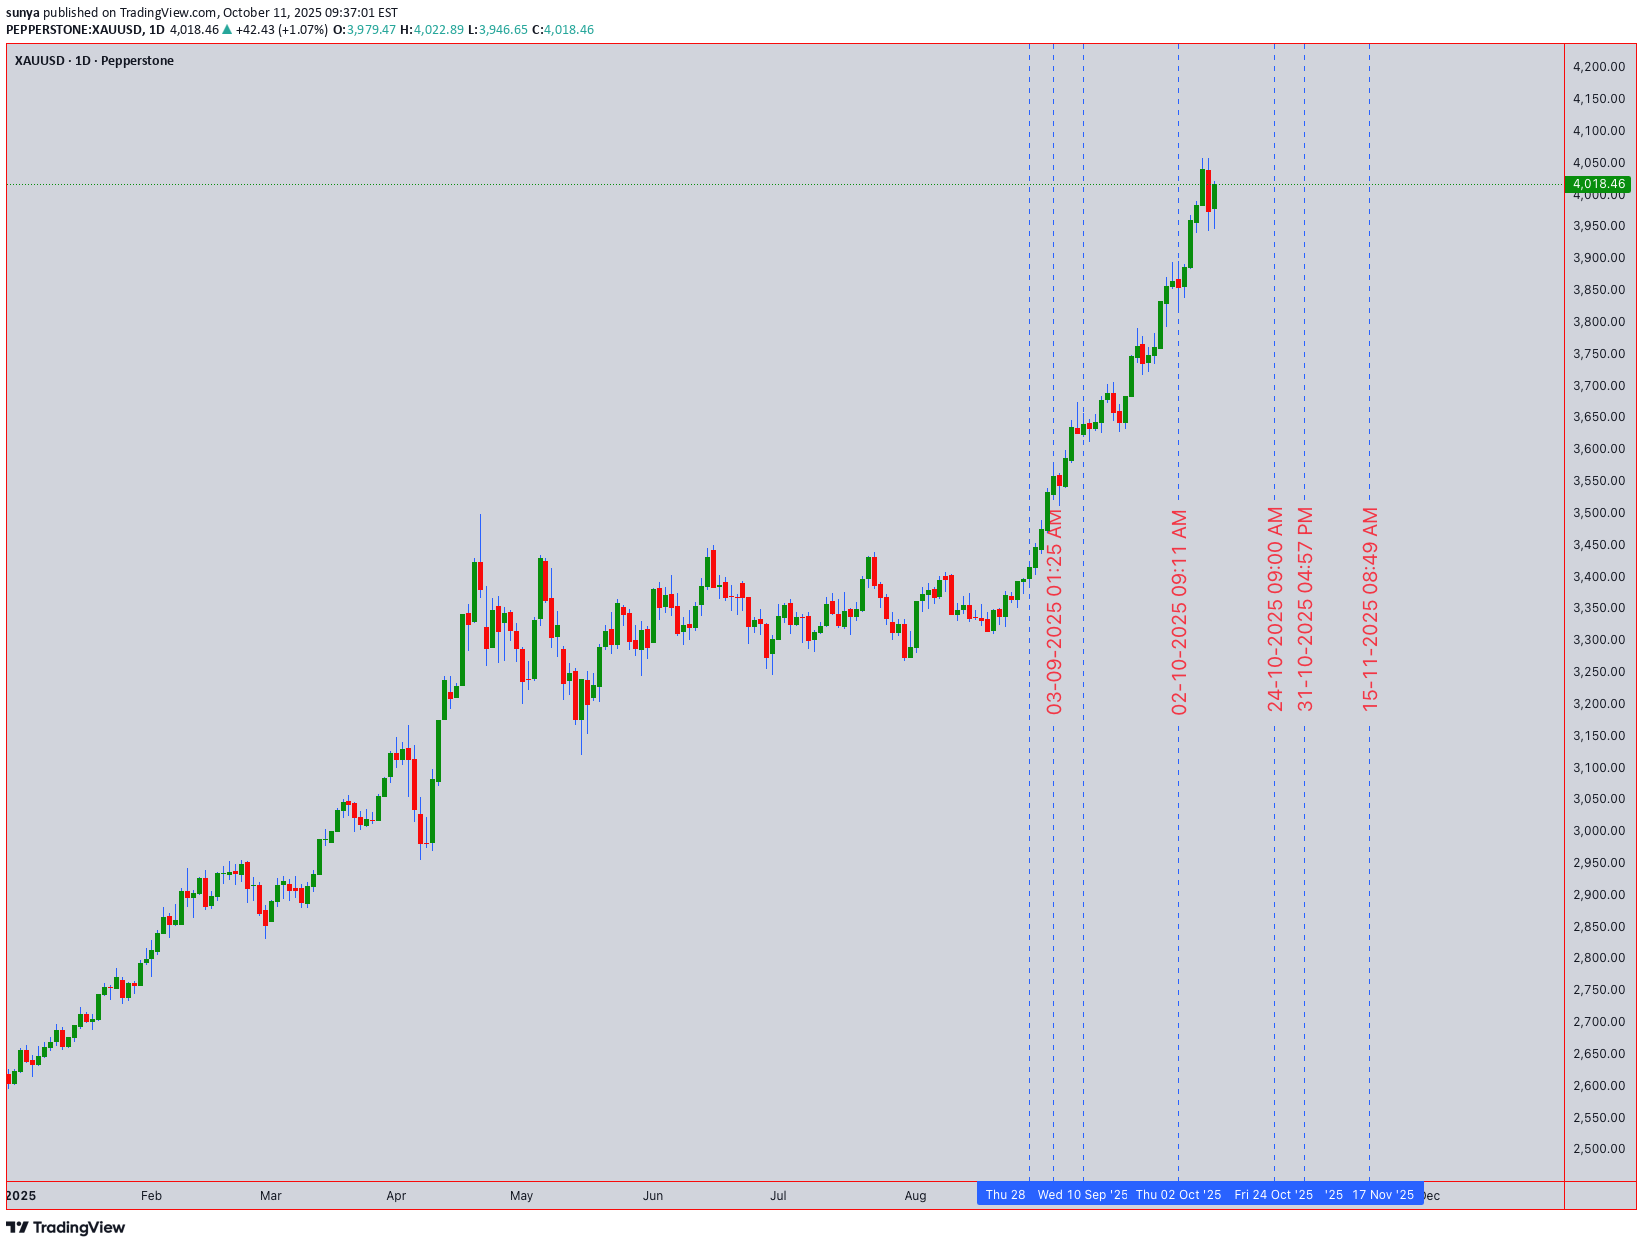
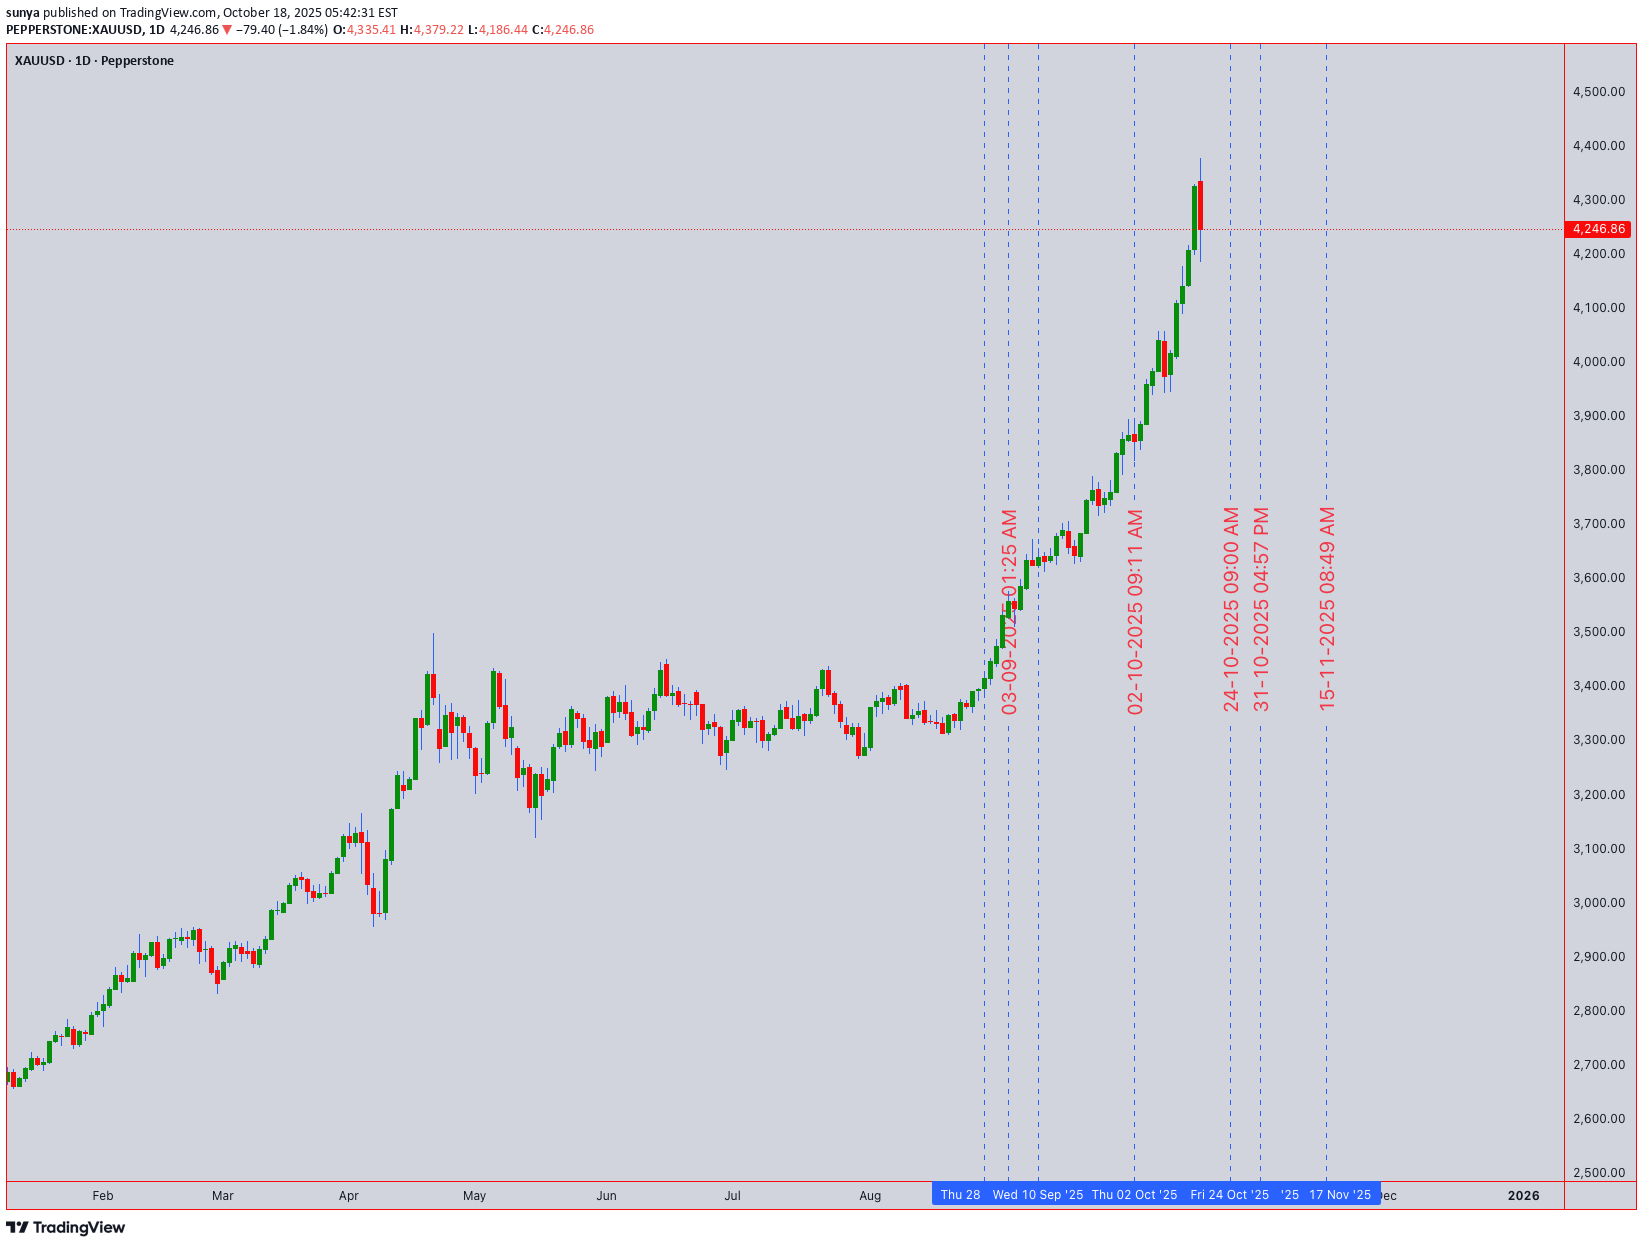
التوقعات الفنیة لـ XAUUSD: الذهب عند ذروة تاریخیة تزید عن 4000 دولار - زخم صعودی سلیم الأصول: XAUUSD (الذهب) | سعر الإغلاق: 4,018.46 دولار | التحیز: صعودی فوق الدعم الرئیسی، ویستهدف مستویات قیاسیة جدیدة. 11 أکتوبر 2025 بالتوقیت العالمی المنسق+4 1. هیکل السوق متعدد الأطر الزمنیة والمستویات الرئیسیة المقاومة الأساسیة: 4,050 دولارًا - 4,080 دولارًا. هذا هو الهدف المباشر ومنطقة المقاومة الثانویة. الاختراق فوق ذلک یفتح الطریق إلى 4120 دولارًا وما بعده. الدعم الحرج: 3,980 دولارًا - 4,000 دولار. تعتبر منطقة المقاومة النفسیة والسابقة التی تحولت إلى منطقة دعم أمرًا بالغ الأهمیة. یؤدی الاختراق أدناه إلى تحویل الانحیاز إلى الحیاد. Major دعم التأرجح: 3,950 دولارًا (مؤکدًا من خلال هیکل الرسم البیانی للأربع ساعات). یشیر الاختراق دون هذا المستوى إلى تصحیح أعمق نحو 3920 دولارًا. 2. نمط الرسم البیانی وسیاق موجة إلیوت النموذج: یتحرک الذهب فی اتجاه صعودی قوی شبه عمودی على الرسم البیانی الیومی، ویتم تداوله فی منطقة مجهولة فوق 4000 دولار. هذا هو الاختراق الکلاسیکی الذی یحرکه الزخم. عدد موجات إلیوت: move من أدنى مستویات سبتمبر هو امتداد واضح للموجة 3. من المحتمل أننا فی المراحل اللاحقة من الموجة 3، مع توقع تصحیح الموجة 4 soon. ومع ذلک، یمکن للموجة 3 أن تمتد إلى أبعد من ذلک، لذا فإن تلاشی هذا الاتجاه سابق لأوانه. خطر فخ الثور: منخفض على المدى القریب. یشیر ضغط الشراء المستمر والقیعان الأعلى إلى قوة اختراق حقیقیة، ولیس فخًا. 3. التقاء المؤشر والزخم سحابة إیشیموکو (یومیًا): یرتفع السعر عالیًا فوق سحابة کومو، مما یشیر إلى اتجاه صعودی قوی للغایة. السحابة فی الأسفل بکثیر، مما یوفر قاعدة دعم قویة. مؤشر القوة النسبیة (14): على الرسم البیانی الیومی، یوجد مؤشر القوة النسبیة فی منطقة ذروة الشراء (> 70)، وهو أمر نموذجی لتحرکات الزخم القویة. ومن الممکن أن یظل فی منطقة ذروة الشراء لفترات طویلة. الاختلاف لیس موجودا بعد. المتوسطات المتحرکة: 50 EMA (~ 3,940 دولارًا أمریکیًا) و 200 EMA یتماشى بشکل صعودی أقل بکثیر من السعر الحالی، مما یؤکد الاتجاه الصعودی على المدى الطویل. لا یوجد "صلیب الموت" فی الأفق. مؤشر بولینجر باند (4H): یتحرک السعر باستمرار فی النطاق العلوی، وهی علامة على القوة الاستثنائیة. من المرجح أن یجد أی تراجع دعمًا أولیًا عند المنتصف band (SMA لمدة 20 فترة). خطة تداول قابلة للتنفیذ التداول الیومی (الرسوم البیانیة لمدة ساعة/15M) إعداد الاستمراریة الصعودیة: عامل التحفیز: یظل السعر أعلى من 4,005 دولارًا أمریکیًا ویخترق 4,030 دولارًا أمریکیًا. شراء الدخول: عند إعادة الاختبار بقیمة 4,015 دولارًا أمریکیًا - 4,020 دولارًا أمریکیًا کدعم، أو کسر 4,032 دولارًا أمریکیًا. وقف الخسارة: أقل من 3,995 دولارًا. الأهداف: 4,050 دولارًا (TP1)، 4,070 دولارًا (TP2). الإعداد الصعودی للشراء عند الانخفاض: الزناد: التراجع إلى منطقة الدعم التی تتراوح بین 3990 دولارًا و4000 دولار. شراء الدخول: على شمعة انعکاسیة صعودیة (على سبیل المثال، المطرقة، الابتلاع الصعودی) فی هذه المنطقة. وقف الخسارة: أقل من 3,980 دولارًا. الأهداف: 4,030 دولارًا (TP1)، 4,050 دولارًا (TP2). التداول المتأرجح (رسوم بیانیة لأربع ساعات/یومیة) الدخول المتأرجح الطویل: الحالة: الاتجاه هو صدیقک. وأی تراجع یمثل فرصة محتملة. منطقة الدخول: 3,980 دولارًا - 4,000 دولار. إیقاف الخسارة: أقل من 3,950 دولارًا (عند الإغلاق الیومی). الهدف: 4,100 دولار+. إدارة التجارة المتأرجحة: فکر فی جنی أرباح جزئیة عند 4,050 دولارًا أمریکیًا و4,080 دولارًا أمریکیًا، ثم تتبع وقف الخسارة الخاص بک للباقی لالتقاط أی قطع مکافئ move. الاستنتاج ومذکرة المخاطر الذهب فی اختراق تاریخی. وعلى الرغم من منطقة ذروة الشراء، لا یمکن إنکار الزخم. تتمثل الإستراتیجیة فی شراء الانخفاضات المدعومة بدلاً من مطاردة القمة المطلقة. مستوى 3980 دولارًا هو الخط الفاصل فی الرمال؛ من شأن الاختراق أدناه أن یشیر إلى أول علامة ضعف واحتمال حدوث تصحیح أعمق للموجة 4. وحتى ذلک الحین، فإن المسار الأقل مقاومة هو الأعلى.
sunya
بیت کوین در اوج تاریخی: آیا این صعود ادامه دارد یا اصلاح سنگین در راه است؟ (تحلیل کلیدی BTCUSD)
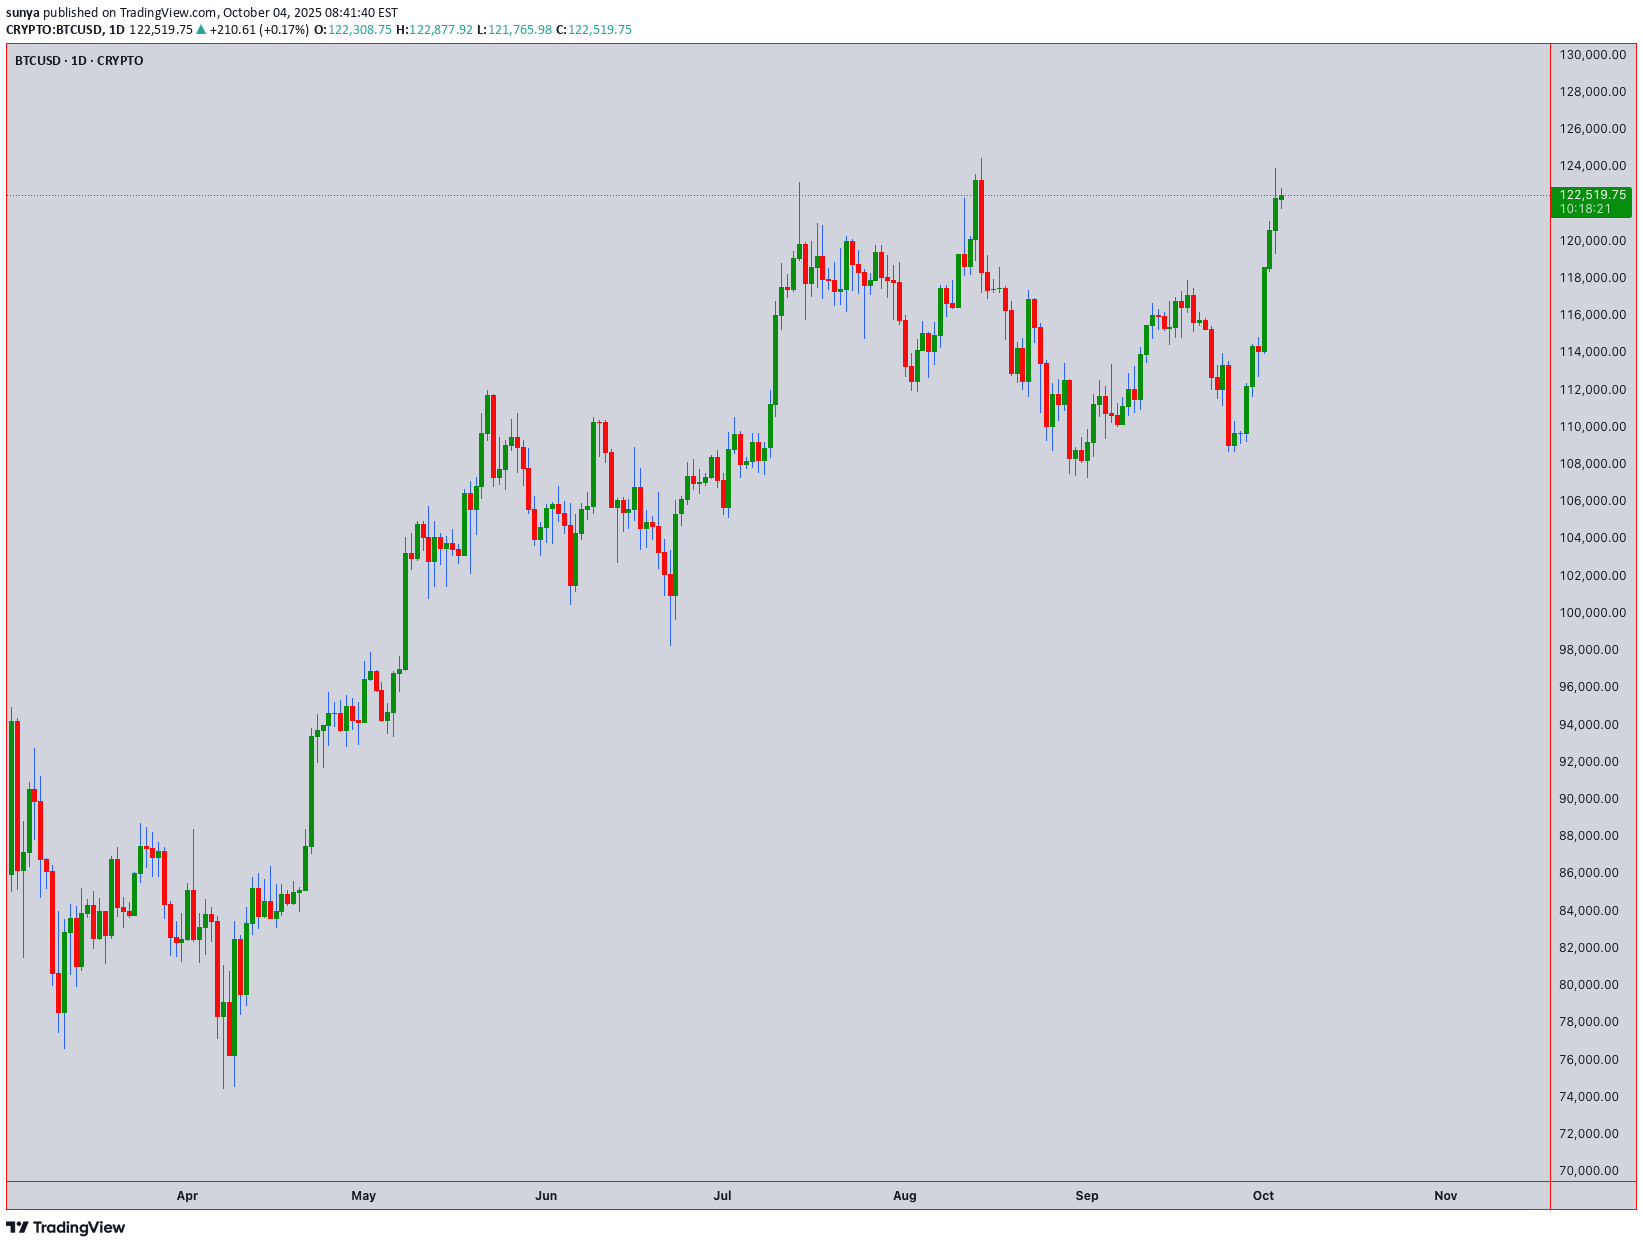
Asset: BTCUSD | Current Price: 122,491.82 | Analysis Date: [Current Date] | Timezone: UTC+4 🎯 Executive Summary & Market Context BTCUSD is trading at a formidable all-time high level near $122,500. This analysis examines whether this rally has the fuel to continue or if a significant correction is imminent. The confluence of several technical patterns and indicators suggests we are at a critical juncture. Geopolitical and macroeconomic factors, including institutional adoption and regulatory clarity, continue to provide a strong bullish undercurrent, but technical exhaustion signals are beginning to flash. 📊 Multi-Timeframe Technical Breakdown Swing Trading (4H, Daily, Weekly) - The Big Picture Primary Trend: Strongly Bullish on higher timeframes (Daily, Weekly). Key Pattern Confluence: Elliott Wave Theory: The rally from the last major swing low is best counted as a powerful Wave 3. We are now likely in a late-stage Wave 5 or a complex corrective Wave 4. A decisive break below the key support at $118,000 would signal that Wave 4 correction is underway, targeting the 0.382 Fibonacci level near $110,000. Wyckoff Theory: Analysis suggests we may be in a Re-Distribution phase. The sharp rise (Upthrust) is being tested. A failure to hold above $120,000 with decreasing volume could confirm this, leading to a Sign of Weakness (SOW). Ichimoku Cloud (Daily): The price is far above the Kumo (Cloud), indicating a strong trend but also signaling an overextended market. The Tenkan-sen (blue line) is acting as dynamic support near $119,500. A break below this would be the first sign of weakening momentum. Head and Shoulders? A potential, large-scale bearish Head and Shoulders top is tentatively forming, with the left shoulder around $115k, the head at this peak (~$123k), and a potential right shoulder to form. This pattern would only be confirmed by a break below the neckline, which would be projected around $105,000. Swing Trading Key Levels: Resistance (R1): 124,200 (Recent High) Resistance (R2): 127,500 (Psychological & Gann Angle) Support (S1): 119,500 (Ichimoku Tenkan-sen) Support (S2): 118,000 (Critical Wave 4 Invalidation) Support (S3): 110,000 (0.382 Fib & Major Swing Zone) Swing Trade Idea: Scenario A (Bullish Continuation): Wait for a pullback to the S1 ($119,500) or S2 ($118,000) support confluence with bullish reversal candlesticks (e.g., Hammer, Bullish Engulfing). Enter long with a stop loss below S2, targeting R1 and R2. Scenario B (Bearish Reversal): If price rejects R1 and breaks below S2 ($118,000) on high volume, consider a short position for a swing down towards S3 ($110,000), with a stop loss above R1. Intraday Trading (5M, 15M, 1H) - Precision Execution Intraday Bias: Neutral to Cautiously Bullish, but highly volatile. Be nimble. Key Indicators & Patterns: Anchored VWAP (from yesterday's low): The price is trading above the VWAP, indicating a Weak Bullish intraday trend. A break below the VWAP would shift the intraday bias to bearish, targeting the lower Bollinger Band. Bollinger Bands (20,2) on 1H: The price is hugging the upper band, suggesting sustained buying pressure but also overbought conditions. A move to the middle band (20 SMA) around $121,200 is a likely intraday pullback target. RSI (14) on 1H: Reading is near 65. It is not severely overbought (>70), but shows room for a minor correction before the next leg up. Candlestick Patterns: Watch for Bearish Engulfing or Evening Star patterns at the R1 resistance for short signals. Conversely, Bull Flags or Bullish Hammers near the VWAP or 20 SMA provide long entry signals. Intraday Key Levels: Resistance (R1): 123,000 (Psychological) Resistance (R2): 123,800 (Today's High) Support (S1): 121,800 (Current Session Low) Support (S2): 121,200 (1H 20 SMA / Bollinger Midline) Support (S3): 120,500 (VWAP & Strong Intraday Support) Intraday Trade Plan for the Session: Long Entry: On a bounce from S2 ($121,200) with a bullish candlestick confirmation. Target: $122,500 - $123,000. Stop Loss: 20 pips below entry. Short Entry: On a rejection at R2 ($123,800) with a bearish candlestick confirmation, or a break below the VWAP (S3). Target: S2 ($121,200). Stop Loss: 20 pips above entry or R2. ⚠️ Critical Risk Analysis: Trap Formations Bull Trap: A classic bull trap is set if the price makes a swift, low-volume spike above $124,200 (R1), luring in late bulls, before sharply reversing to close below $120,000. The Wyckoff Re-Distribution scenario aligns with this risk. Bear Trap: A bear trap occurs if the price wicks down sharply, breaking below $118,000 (S2) and triggering stop losses, only to reverse aggressively and reclaim that level, squeezing shorts and fueling the next leg up. This would invalidate the bearish Elliott Wave 4 count. 📈 Indicator Snapshot & Confluence ✅ Conclusion & Final Outlook Bullish Case: The trend is your friend. The price remains above all critical moving averages and the Ichimoku Tenkan-sen. A hold above $118,000 opens the path for a test of $127,500. Bearish Case: The market is overextended. The potential for an Elliott Wave 4 correction, a Wyckoff Re-Distribution, or a large-scale Head and Shoulders pattern presents significant downside risk towards $110,000. Trading Recommendation: For swing traders, the risk/reward favors waiting for a pullback to stronger support zones ($118k-$119.5k) before entering new long positions, or waiting for a confirmed break of support to play the short side. For intraday traders, trade the range between the key levels defined above, using the VWAP and Bollinger Bands as dynamic guides. Position sizing and strict stop-losses are non-negotiable at these elevated levels.
sunya
تحلیل جامع S&P 500: آیا بازار در آستانه ریزش است؟ (پیشبینی دقیق تا اکتبر ۲۰۲۵)
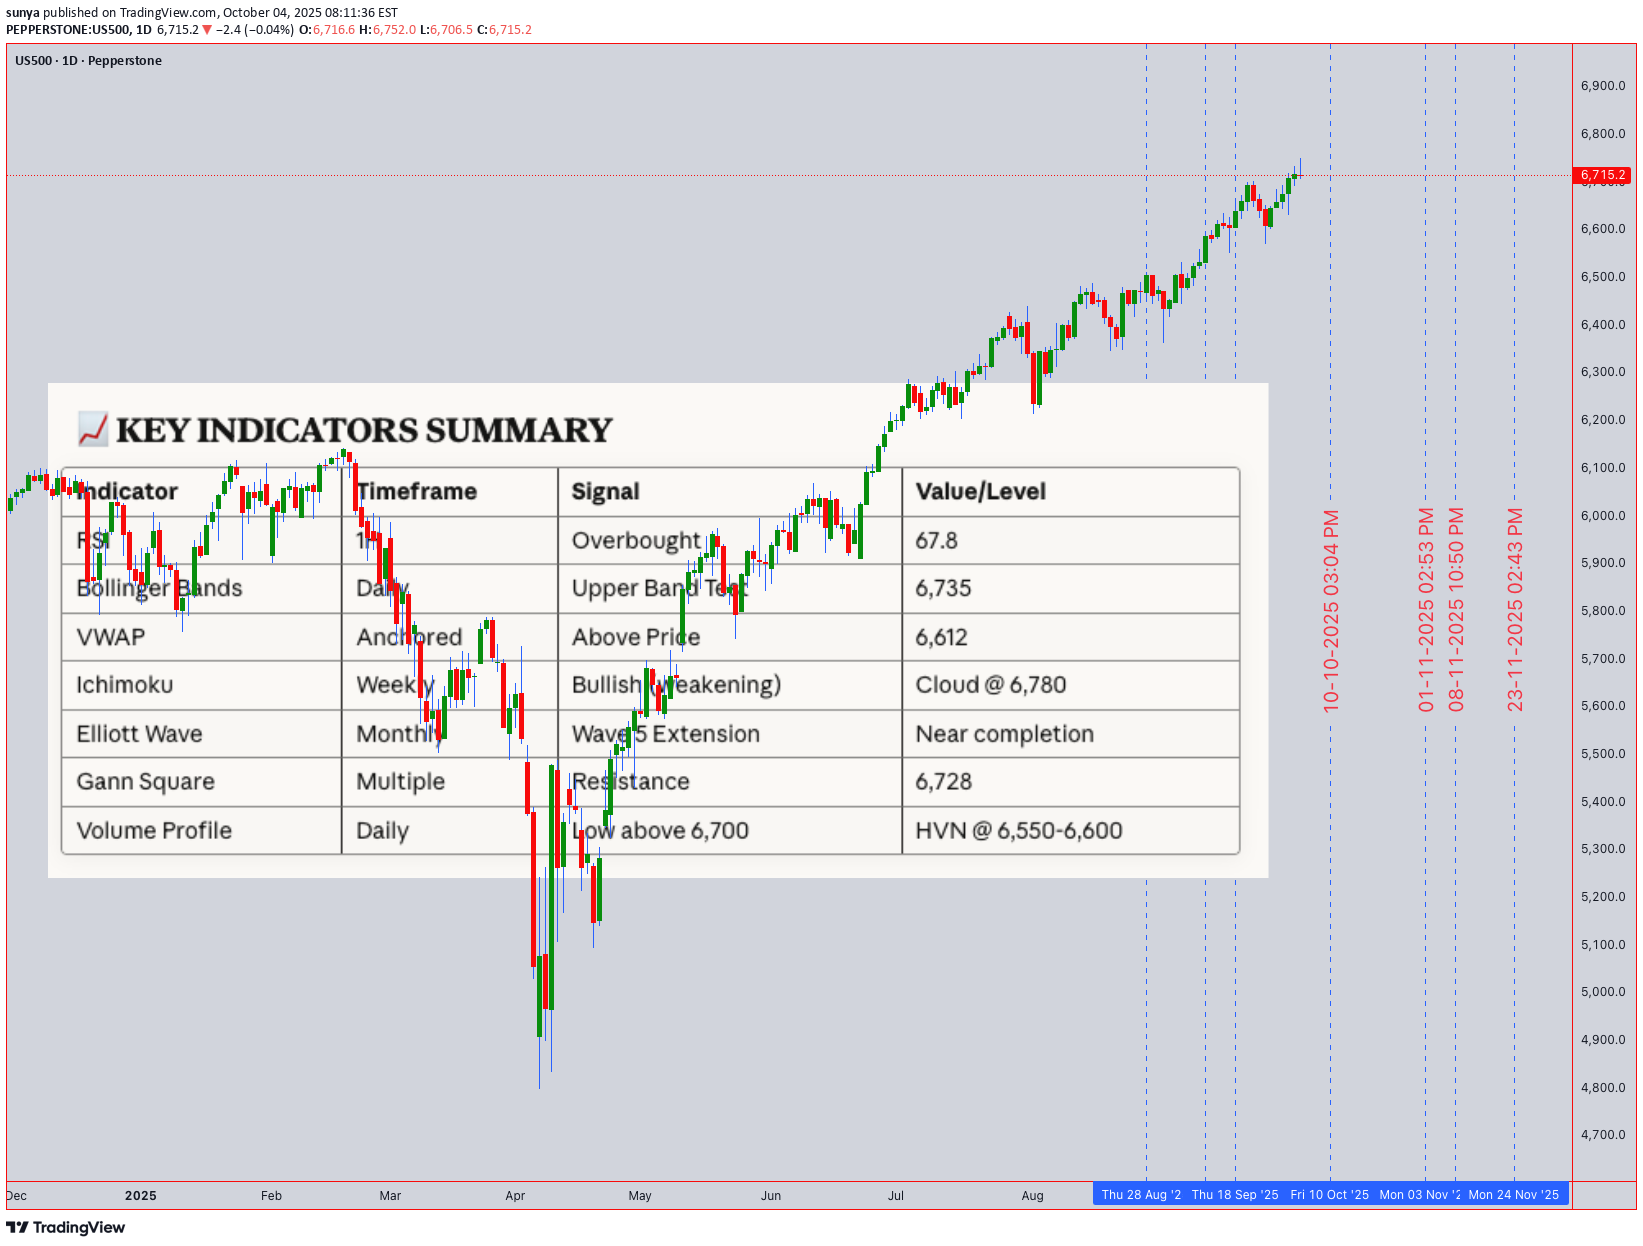
Current Price: 6,715.20 | Date: October 4, 2025 📊 MARKET OVERVIEW The S&P 500 is trading at 6,715.20, hovering near historical resistance zones. This analysis integrates multiple technical frameworks to provide actionable insights for both intraday and swing traders. 🔍 MULTI-TIMEFRAME TECHNICAL ANALYSIS Monthly & Weekly Perspective (Swing Trading) Elliott Wave Analysis: The index appears to be in a Wave 5 extension of a broader bullish impulse from the 2022 lows Monthly chart shows potential exhaustion signals as we approach the 6,750-6,800 resistance cluster Wave structure suggests a possible corrective phase (ABC) may initiate in Q4 2025 Ichimoku Cloud (Weekly): Price trading above the cloud - bullish structure intact Tenkan-sen (9): 6,682 | Kijun-sen (26): 6,591 Future Senkou Span projects resistance at 6,780-6,820 Key Support Levels (Swing): 6,620 - Kijun-sen weekly support 6,480 - 50-week EMA (critical long-term support) 6,350 - Monthly pivot & Wyckoff accumulation zone 6,180 - 200-week MA (major bull/bear line) Key Resistance Levels (Swing): 6,750 - Psychological resistance & Gann 1x1 angle 6,820 - Ichimoku cloud projection 6,945 - Fibonacci 1.618 extension from August lows Daily & 4-Hour Perspective Wyckoff Analysis: Current phase suggests late distribution (UTAD - Upthrust After Distribution) Volume declining on recent rallies - potential weakness Accumulation zone identified: 6,480-6,550 for re-entry Harmonic Patterns: Bearish Bat pattern forming on the 4H chart PRZ (Potential Reversal Zone): 6,740-6,760 Bearish divergence on RSI confirming pattern validity Bollinger Bands (Daily): Price at upper band (6,735) - overextended Band width expanding - increased volatility expected Middle band support: 6,580 Volume Analysis: VWAP (Anchored from September low): 6,612 Volume profile shows weak volume above 6,700 High volume node (HVN) at 6,550-6,600 - strong support Intraday Analysis (1H, 30M, 15M, 5M) Current Intraday Setup: RSI (Relative Strength Index): 1H RSI: 67.8 (approaching overbought) 15M RSI: 72.3 (overbought territory) Bearish divergence forming on 30M chart Moving Averages: Death Cross Warning: 50 EMA approaching 200 EMA on 4H chart 1H: 20 EMA (6,698) acting as immediate support 5M: Price oscillating around 50 EMA (6,712) Gann Analysis: Gann Square of 9: Next resistance at 6,728 (45° angle) Time cycle suggests potential reversal window: October 7-9, 2025 Price/Time square approaching - expect volatility spike Candlestick Patterns (Recent): Evening Star formation on 4H chart (bearish reversal) Long upper wicks on 1H chart - rejection at resistance Doji formation on daily - indecision 🎯 TRADING STRATEGIES INTRADAY TRADING SETUP (Next 5 Trading Days) Bearish Scenario (Higher Probability - 65%): Entry Zones: Primary Short Entry: 6,725-6,735 (upon rejection) Secondary Short Entry: 6,750-6,760 (if breakout fails - bull trap) Stop Loss: Above 6,775 (invalidation level) Profit Targets: TP1: 6,680 (20 EMA support - 1H) TP2: 6,650 (VWAP anchor) TP3: 6,620 (Kijun-sen weekly) TP4: 6,580 (Daily BB middle band) Risk-Reward Ratio: 1:3 minimum Confirmation Signals: Break below 6,700 with increased volume RSI crosses below 50 on 1H chart MACD bearish crossover on 30M Bullish Scenario (Lower Probability - 35%): Entry Zones: Long Entry: 6,680-6,690 (upon bounce from 20 EMA) Aggressive Long: 6,650-6,660 (VWAP retest) Stop Loss: Below 6,635 Profit Targets: TP1: 6,720 (resistance retest) TP2: 6,750 (psychological level) TP3: 6,780 (Ichimoku cloud resistance) Confirmation Signals: Volume surge on bounce RSI bullish divergence on 15M Break above 6,720 with strong momentum SWING TRADING SETUP (2-4 Week Outlook) Primary Strategy: SELL ON RALLY Phase 1 - Distribution (Current): Expect choppy price action between 6,680-6,750 Ideal swing short entry: 6,735-6,760 Stop loss: 6,820 Target: 6,480-6,550 (Accumulation zone) Time horizon: 2-3 weeks Phase 2 - Accumulation (Upcoming): Watch for bullish reversal patterns in 6,450-6,550 zone Potential H&S inverse or double bottom formation Long entry upon confirmation Target: 6,850-6,950 (Next impulse wave) Time horizon: 4-8 weeks ⚠️ RISK FACTORS & MARKET CONTEXT Trap Alert: Bull Trap Risk: HIGH above 6,750 Weak volume at resistance suggests false breakout potential Head and Shoulders pattern forming on 4H chart Bear Trap Risk: MODERATE below 6,650 Strong support zone with high volume profile Potential quick reversal if broken Geopolitical & Macro Factors: Fed policy uncertainty - rate decision impact expected mid-October Q3 earnings season beginning - volatility spike likely Geopolitical tensions may trigger safe-haven flows Seasonal October volatility historically present Volume Volatility Assessment: Current State: Declining volume on rallies (bearish) Expected: Volume spike at 6,750 resistance or 6,650 support Strong Trend Confirmation: Sustained volume >15% above 20-day average 🎯 TRADING PLAN SUMMARY For Next Week (Oct 4-11, 2025): Monday-Tuesday: Expect resistance at 6,725-6,735. Look for short opportunities on rejection. Wednesday-Thursday: Gann time cycle window - increased volatility. Watch for break of 6,700 or 6,750. Friday: Weekly close crucial - below 6,680 confirms bearish bias; above 6,750 invalidates short setup. Optimal Strategy: Sell rallies into 6,730-6,750 resistance Wait for confirmation - don't chase Manage risk strictly - volatile market conditions Scale into positions - don't enter full size immediately 💡 TRADER'S EDGE Pattern to Watch: The confluence of: Bearish Bat harmonic completion RSI divergence Wyckoff distribution phase Weak volume at resistance Gann time/price square Creates a HIGH-PROBABILITY SHORT SETUP at 6,735-6,760 Critical Levels This Week: Bull Control: Hold above 6,700 Bear Control: Break below 6,650 Decision Zone: 6,675-6,725 📝 DISCLAIMER This analysis is for educational purposes only. Trading involves substantial risk of loss. Always use proper risk management, never risk more than 1-2% of your capital per trade, and consider your own risk tolerance and trading plan. Past performance does not guarantee future results. Stay disciplined. Trade the plan. Manage your risk.
إخلاء المسؤولية
أي محتوى ومواد مدرجة في موقع Sahmeto وقنوات الاتصال الرسمية هي عبارة عن تجميع للآراء والتحليلات الشخصية وغير ملزمة. لا تشكل أي توصية للشراء أو البيع أو الدخول أو الخروج من سوق الأوراق المالية وسوق العملات المشفرة. كما أن جميع الأخبار والتحليلات المدرجة في الموقع والقنوات هي مجرد معلومات منشورة من مصادر رسمية وغير رسمية محلية وأجنبية، ومن الواضح أن مستخدمي المحتوى المذكور مسؤولون عن متابعة وضمان أصالة ودقة المواد. لذلك، مع إخلاء المسؤولية، يُعلن أن المسؤولية عن أي اتخاذ قرار وإجراء وأي ربح وخسارة محتملة في سوق رأس المال وسوق العملات المشفرة تقع على عاتق المتداول.