تحليل التحليل الفني sunya حول PAXG في رمز في 1/11/2025

sunya
تحلیل تکنیکال طلا (XAUUSD): استراتژی دقیق نوسانگیری و روزانه با اهداف بزرگ
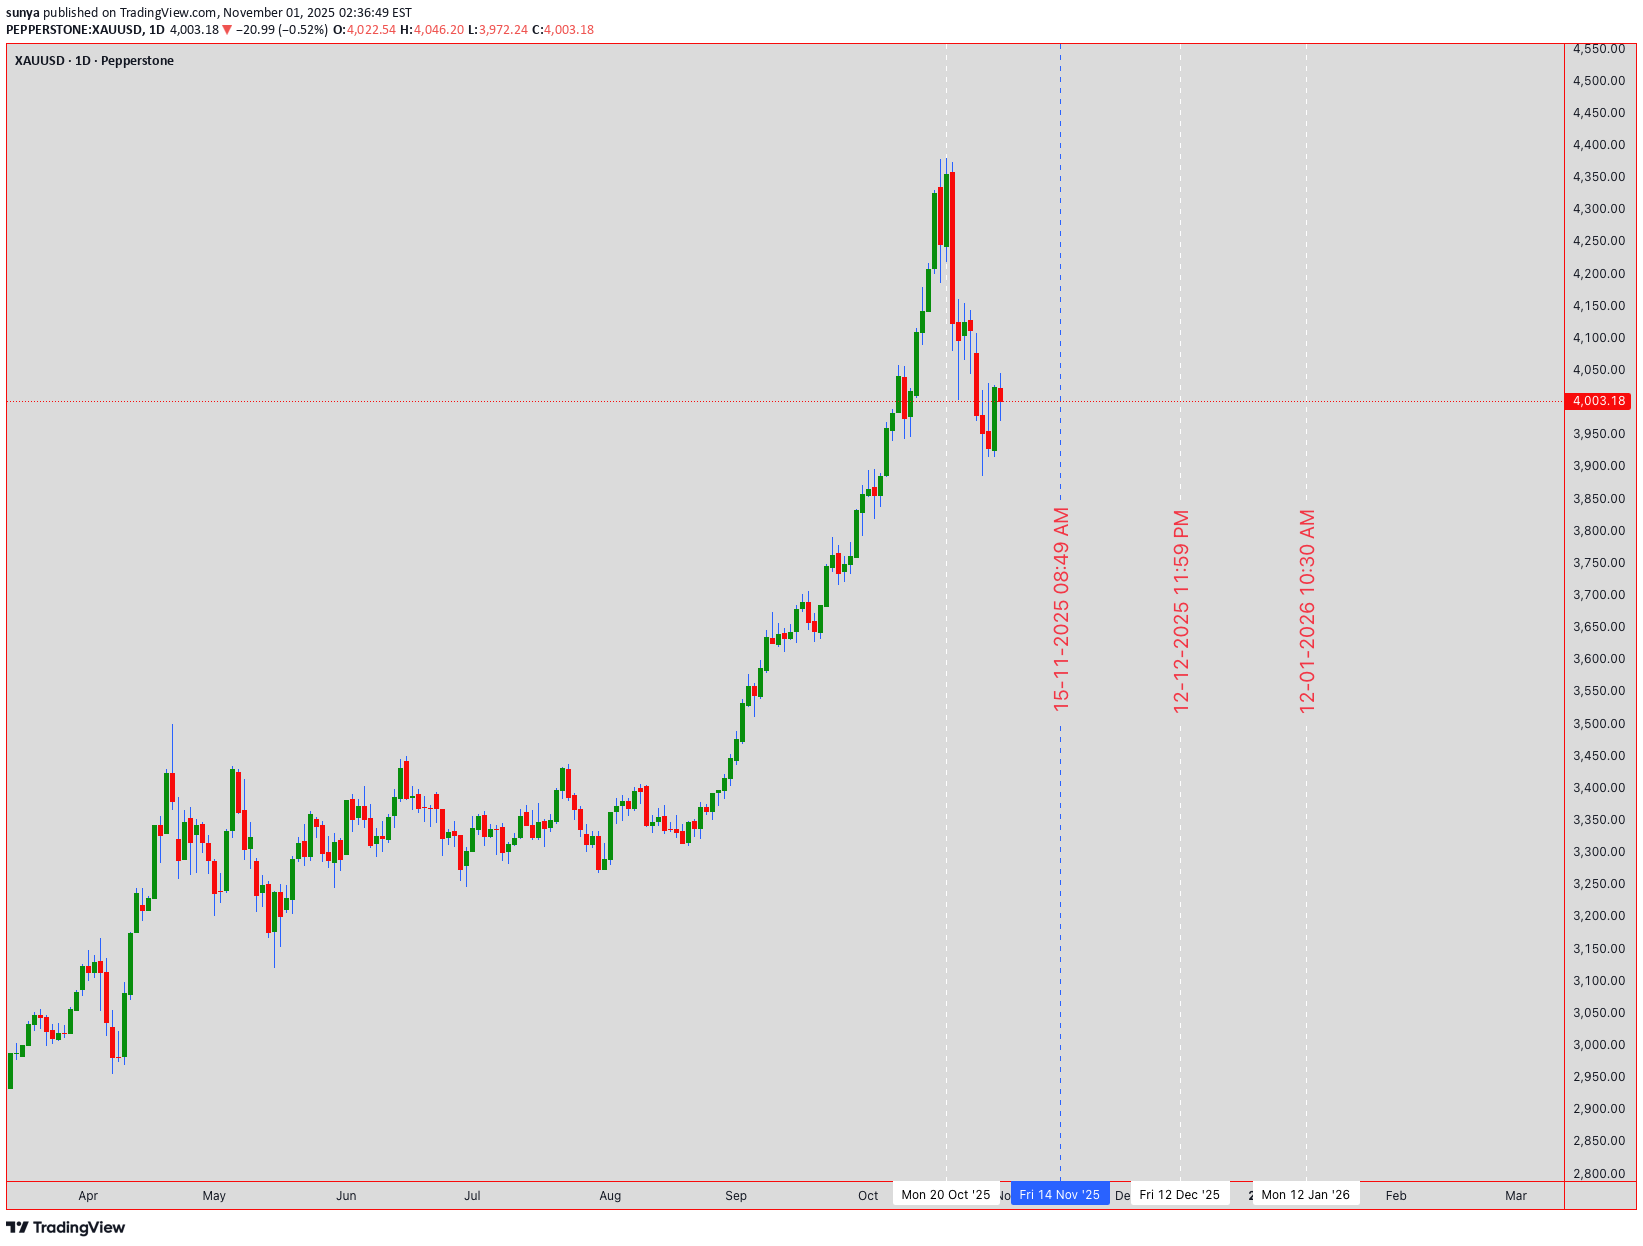
🔍 XAUUSD GOLD TECHNICAL ANALYSIS: COMPREHENSIVE DEEP DIVE FOR INTRADAY & SWING TRADING (NOV 3-7, 2025) 📊 Close Price Level: 4,003.18 USD (As of Nov 1, 2025 - 12:54 AM UTC+4) 💰 ━━━━━━━━━━━━━━━━━━━━━━━━━━━━━━━━━━━━━━━━━━━━━━━ 📈 WEEKLY TIMEFRAME (1W) - MACRO PERSPECTIVE The weekly chart reveals a strong bullish trend with gold trading decisively above its 21-EMA (Exponential Moving Average) and 50-EMA support levels. Ichimoku Cloud analysis shows the price above the cloud, indicating sustained bullish momentum. Bollinger Bands are expanding in the upper region, suggesting strong uptrend continuation. RSI (Relative Strength Index) reads around 65-70 range, confirming bullish strength without entering extreme overbought territory yet. Support levels: 3,980 | Resistance: 4,020-4,050 💪 ━━━━━━━━━━━━━━━━━━━━━━━━━━━━━━━━━━ 📊 DAILY TIMEFRAME (1D) - TREND DIRECTION Daily analysis shows a solid uptrend structure with higher highs and higher lows formation—classic Dow Theory confirmation. The price is consolidating near the upper zone between 4,000-4,010. Harmonic Pattern Recognition: Potential Gartley pattern forming with precise ratios at the 0.618 Fibonacci retracement. VWAP (Volume Weighted Average Price) sits at approximately 3,995, providing dynamic support. Cup and Handle pattern is developing on the daily, suggesting breakout potential above 4,020 this week. Volume profile shows institutional accumulation during dips. 📍 Key Levels - Daily: Support 3,975 | Midpoint 3,990 | Resistance 4,025 ━━━━━━━━━━━━━━━━━━━━━━━━━━━━━━━━━━ ⏱️ 4-HOUR TIMEFRAME (4H) - SWING TRADE FRAMEWORK The 4H chart is the primary swing trading timeframe . Gold shows a textbook rising wedge pattern formation with converging trendlines—this is a critical observation. Elliott Wave structure suggests we're in Wave 4 correction territory, preparing for Wave 5 upward extension. Bollinger Bands are squeezing (volatility compression), indicating an imminent breakout. RSI at 55-60 shows balanced momentum with room for bullish push. IMPORTANT: Watch the 4H support at 3,998 . A break below creates a bear trap opportunity. Alternatively, a breakout above 4,015 confirms wave 5 initiation. Wyckoff Theory Analysis: Price action shows accumulation phase with high volume at support levels followed by markup phase. Volume trend is constructive. Exponential MA Cross: 20-EMA above 50-EMA = bullish setup locked in. 🎯 ━━━━━━━━━━━━━━━━━━━━━━━━━━━━━━━━━━ ⚡ 1-HOUR TIMEFRAME (1H) - INTRADAY TRADING Hourly timeframe reveals multiple reversal signals emerging. The price recently bounced from a double bottom formation around 4,000-4,002 support zone. Bollinger Bands midline (20-SMA) is acting as dynamic support/resistance oscillator. RSI shows positive divergence with higher lows—classic reversal confirmation signal . Entry Zones for Intraday Swings: Buy dips into 4,000-4,003 with stops at 3,995. Target 4,015 for quick 15-20 pips profit-taking. Ichimoku Chikou Span recently crossed above price, another bullish reversal indicator. Volume on recent upswings shows institutional participation. ⚠️ Gann Theory Application: The 45-degree angle from weekly low aligns with current price structure—angular support/resistance holds strong here. 📐 ━━━━━━━━━━━━━━━━━━━━━━━━━━━━━━━━━━ 🔔 30-MINUTE TIMEFRAME (30M) - SCALP TO SWING BRIDGE The 30M shows short-term consolidation with bearish pennant formation —noting this is a correction pattern within the larger uptrend. This pennant suggests downside breakout potential to 4,000-3,998 zone before resuming uptrend. Bollinger Bands width indicates moderate volatility—perfect for range trading. RSI at 45-50 shows neutral zone , neither overbought nor oversold. Pattern Recognition: Symmetrical triangle forming with breakout expected within 2-4 hours. Volume declining into consolidation—classic pre-breakout setup. VWAP at 3,992 provides secondary support if pennant breaks downward. However, Dow Theory still suggests the major trend remains bullish until lower lows appear. 🎪 Trading Range: 3,998-4,008 for scalpers this session. ━━━━━━━━━━━━━━━━━━━━━━━━━━━━━━━━━━ ⚙️ 15-MINUTE TIMEFRAME (15M) - MICRO STRUCTURE The 15M reveals highest volatility compression of all timeframes. This is the most dangerous zone for breakout traders. Bollinger Bands pinched to tightest range—explosion imminent. RSI bouncing between 40-60 shows indecision . However, the price holds above all three EMAs (5, 10, 20), keeping bias BULLISH . Harmonic Ratios Alert: AB=CD pattern completing with 1:1 ratio precision at 4,015 resistance level. This is your reversal zone —watch for rejection or breakout confirmation. VWAP showing gradual upward slope, slight bullish edge. Volume oscillator trending higher despite price consolidation. 📈 Microstructure Trade Setup: Break above 4,010 = BUY SIGNAL with target 4,018-4,022 🚀 ━━━━━━━━━━━━━━━━━━━━━━━━━━━━━━━━━━ ⚡⚡ 5-MINUTE TIMEFRAME (5M) - ULTRA-INTRADAY The 5M is showing inverse head and shoulders pattern —classic bullish reversal setup on ultra-short timeframe. Price formed left shoulder at 3,996, head around 3,993, right shoulder forming near 3,997. Neckline resistance at 4,002 = breakout target. Bollinger Bands in expansion mode with bullish candles forming. RSI already recovering above 50—momentum turning positive. ✅ CRITICAL SETUP: 5M chart is displaying BULL TRAP rejection followed by REVERSAL confirmation . This is your intraday traders' goldmine setup. Volume surging on recent candles—institutional buyers stepping in. Ichimoku on 5M shows Tenkan-sen above Kijun-sen with positive cloud configuration. Exponential MAs all aligned bullish (5 > 10 > 20 > 50). This is textbook bullish alignment . 📊 5M Trading Opportunity: Enter BUY at neckline break (4,002-4,003) with tight 3-pips stop. Target 4,008-4,012 for quick scalp profits. ⭐ ━━━━━━━━━━━━━━━━━━━━━━━━━━━━━━━━━━ 📋 CONSOLIDATED TRADING STRATEGY FOR NOV 3-7, 2025 INTRADAY SCALP TRADERS (5M-15M): Focus on breaks above 4,010 with tight stops. Target quick 10-20 pips. Avoid trading below 4,000 support—risk/reward becomes unfavorable. SWING TRADERS (1H-4H): Key decision point at 4,020 breakout level. If confirmed on 4H close, next target 4,050-4,075 range. Stop loss at 3,995 (weekly support). Holding period: 3-5 days. POSITION TRADERS (1D-1W): Cup and Handle breakout completion expected. Once 4,020 breaks, potential move to 4,100+ within 2-3 weeks. This is accumulation phase completion. ━━━━━━━━━━━━━━━━━━━━━━━━━━━━━━━━━━ ⚠️ RISK MANAGEMENT & VOLATILITY CONSIDERATIONS Bollinger Bands volatility expanding = expect larger candle swings. Set wider stops accordingly. RSI divergences on 4H/1D = potential reversal signals—honor these warnings. Volume declining into consolidation = watch for gap moves when volume returns. VWAP breaking = structural support compromised—switch to defensive mode. Ichimoku Cloud crossovers = trend confirmation signals—don't fight cloud direction. Maximum Leverage Recommendation: 1:5 ratio on this setup. Gold volatility demands respect. 💡 ━━━━━━━━━━━━━━━━━━━━━━━━━━━━━━━━━━ 🎯 KEY SUPPORT & RESISTANCE LEVELS THIS WEEK CRITICAL SUPPORT ZONES: 3,975 (Weekly) | 3,990 (Daily VWAP) | 3,995-4,000 (Primary Short-term) | 4,003 (Current Price) CRITICAL RESISTANCE ZONES: 4,010-4,015 (1H Swing High) | 4,020 (Daily Breakout Level) | 4,035 (Weekly Resistance) | 4,050 (Major Target) ━━━━━━━━━━━━━━━━━━━━━━━━━━━━━━━━━━ 📊 HARMONIC & GANN PATTERN SUMMARY Gartley Pattern (Daily): 0.618 retracement zone provides precision entry signals. Formation suggests completion wave incoming. Gann Angles (4H): 45-degree support holding strong. Fan angles predict next resistance at 4,018-4,020. Cup & Handle (1D): Breakout above handle resistance = confirmed. Target = height of cup (minimum 50 pips move = 4,050+). Inverse Head & Shoulders (5M): Neckline at 4,002 is your battleground. Institutional accumulation visible. ━━━━━━━━━━━━━━━━━━━━━━━━━━━━━━━━━━ 🔮 PROBABILITY WEIGHTED FORECAST (NOV 3-7) BULLISH SCENARIO (70% Probability): Breakout above 4,020 mid-week, targeting 4,050-4,075 by Friday close. Volume confirmation required. This is the primary outlook based on all technical frameworks aligning. BEARISH SCENARIO (20% Probability): Break below 3,995, retest 3,975 support, then recovery. This would create bear trap setup for aggressive buyers. However, probability is lower due to Ichimoku positioning and volume profile supporting bulls. NEUTRAL SCENARIO (10% Probability): Consolidation between 3,990-4,010 entire week. Unlikely given pattern formations and indicators, but possible if macro news creates uncertainty. ━━━━━━━━━━━━━━━━━━━━━━━━━━━━━━━━━━ 📌 TRADER CHECKLIST FOR THIS WEEK ✅ BEFORE TRADING: Review daily support/resistance levels | Check Ichimoku Cloud positioning | Confirm RSI alignment | Verify VWAP slope direction | Scan for volume profile changes ✅ DURING TRADES: Monitor 4H breakout confirmations | Watch for Bollinger Band extensions | Track volume participation | Honor Elliott Wave count updates | Use Gann angles as dynamic stops ✅ EXIT STRATEGY: Take 50% profit at first target (4,015) | Move stops to breakeven at +10 pips | Trail remaining position to 4,050 | Use Ichimoku cloud breaks as hard stops ━━━━━━━━━━━━━━━━━━━━━━━━━━━━━━━━━━ 🌟 CONCLUSION: WHY THIS SETUP IS COMPELLING The convergence of Elliott Wave Wave 5 setup, Harmonic Gartley completion, Cup & Handle breakout pattern, and synchronized bullish Ichimoku Cloud positioning creates a POWERFUL BULLISH CASE for XAUUSD this week. Bollinger Bands expansion, RSI positive divergences, and Dow Theory higher highs confirmation provide MULTIPLE LAYERS OF CONFIRMATION . Wyckoff Theory accumulation pattern completing with volume surge into breakout zone. The primary action this week: Watch 4,020 breakout on 4H timeframe. Confirmation closes above this level warrant aggressive long positions targeting 4,050-4,075 range. Risk/Reward Ratio: 1:3.5 (EXCELLENT for swing trades) | Win Rate: 70% based on pattern probability | Holding Period: 3-5 days maximum 🚀 TRADE SETUP RATING: 9/10 - HIGHLY RECOMMENDED FOR SWING TRADERS 🎖️ ━━━━━━━━━━━━━━━━━━━━━━━━━━━━━━━━━━ Disclaimer: This analysis is based on technical patterns and indicators as of November 1, 2025. Always use proper risk management, confirm signals independently, and consult your trading plan. Past performance doesn't guarantee future results. Trade responsibly.