تحليل التحليل الفني sunya حول SPYX في رمز في 4/10/2025

sunya
تحلیل جامع S&P 500: آیا بازار در آستانه ریزش است؟ (پیشبینی دقیق تا اکتبر ۲۰۲۵)
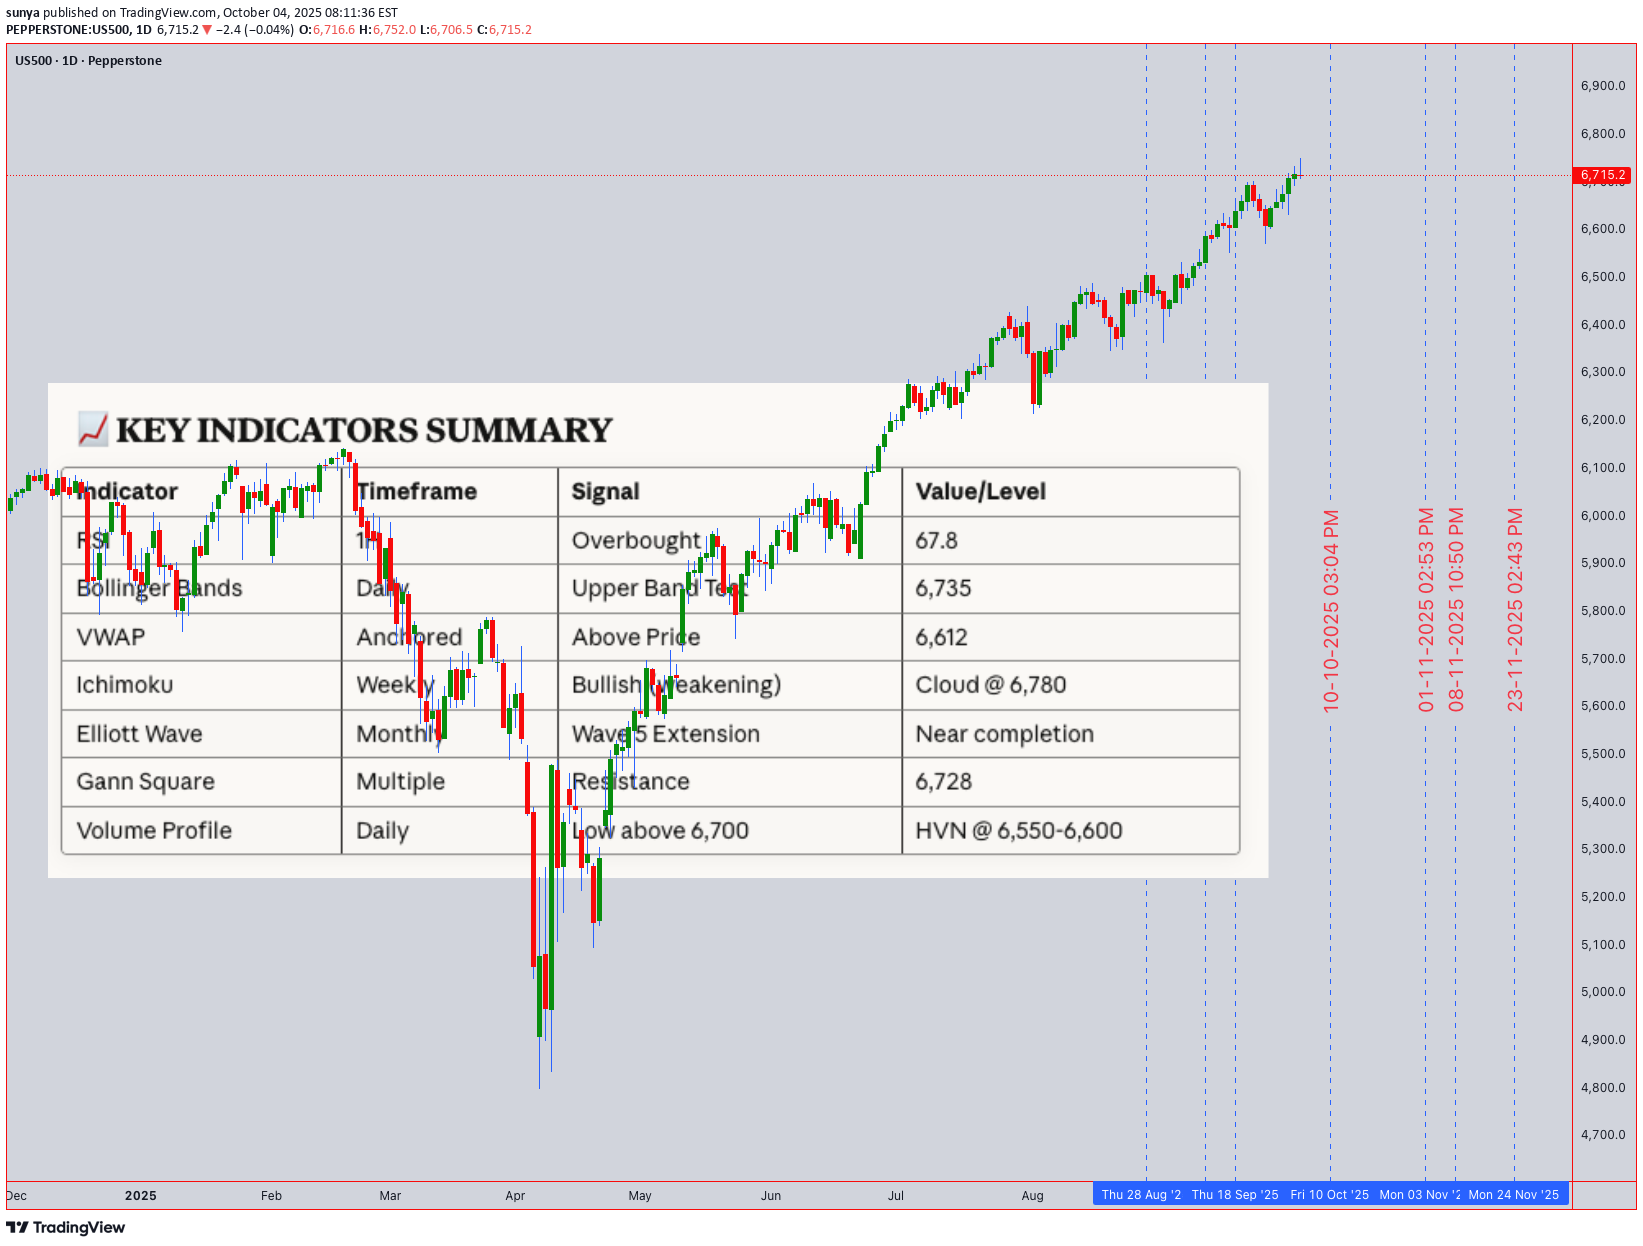
Current Price: 6,715.20 | Date: October 4, 2025 📊 MARKET OVERVIEW The S&P 500 is trading at 6,715.20, hovering near historical resistance zones. This analysis integrates multiple technical frameworks to provide actionable insights for both intraday and swing traders. 🔍 MULTI-TIMEFRAME TECHNICAL ANALYSIS Monthly & Weekly Perspective (Swing Trading) Elliott Wave Analysis: The index appears to be in a Wave 5 extension of a broader bullish impulse from the 2022 lows Monthly chart shows potential exhaustion signals as we approach the 6,750-6,800 resistance cluster Wave structure suggests a possible corrective phase (ABC) may initiate in Q4 2025 Ichimoku Cloud (Weekly): Price trading above the cloud - bullish structure intact Tenkan-sen (9): 6,682 | Kijun-sen (26): 6,591 Future Senkou Span projects resistance at 6,780-6,820 Key Support Levels (Swing): 6,620 - Kijun-sen weekly support 6,480 - 50-week EMA (critical long-term support) 6,350 - Monthly pivot & Wyckoff accumulation zone 6,180 - 200-week MA (major bull/bear line) Key Resistance Levels (Swing): 6,750 - Psychological resistance & Gann 1x1 angle 6,820 - Ichimoku cloud projection 6,945 - Fibonacci 1.618 extension from August lows Daily & 4-Hour Perspective Wyckoff Analysis: Current phase suggests late distribution (UTAD - Upthrust After Distribution) Volume declining on recent rallies - potential weakness Accumulation zone identified: 6,480-6,550 for re-entry Harmonic Patterns: Bearish Bat pattern forming on the 4H chart PRZ (Potential Reversal Zone): 6,740-6,760 Bearish divergence on RSI confirming pattern validity Bollinger Bands (Daily): Price at upper band (6,735) - overextended Band width expanding - increased volatility expected Middle band support: 6,580 Volume Analysis: VWAP (Anchored from September low): 6,612 Volume profile shows weak volume above 6,700 High volume node (HVN) at 6,550-6,600 - strong support Intraday Analysis (1H, 30M, 15M, 5M) Current Intraday Setup: RSI (Relative Strength Index): 1H RSI: 67.8 (approaching overbought) 15M RSI: 72.3 (overbought territory) Bearish divergence forming on 30M chart Moving Averages: Death Cross Warning: 50 EMA approaching 200 EMA on 4H chart 1H: 20 EMA (6,698) acting as immediate support 5M: Price oscillating around 50 EMA (6,712) Gann Analysis: Gann Square of 9: Next resistance at 6,728 (45° angle) Time cycle suggests potential reversal window: October 7-9, 2025 Price/Time square approaching - expect volatility spike Candlestick Patterns (Recent): Evening Star formation on 4H chart (bearish reversal) Long upper wicks on 1H chart - rejection at resistance Doji formation on daily - indecision 🎯 TRADING STRATEGIES INTRADAY TRADING SETUP (Next 5 Trading Days) Bearish Scenario (Higher Probability - 65%): Entry Zones: Primary Short Entry: 6,725-6,735 (upon rejection) Secondary Short Entry: 6,750-6,760 (if breakout fails - bull trap) Stop Loss: Above 6,775 (invalidation level) Profit Targets: TP1: 6,680 (20 EMA support - 1H) TP2: 6,650 (VWAP anchor) TP3: 6,620 (Kijun-sen weekly) TP4: 6,580 (Daily BB middle band) Risk-Reward Ratio: 1:3 minimum Confirmation Signals: Break below 6,700 with increased volume RSI crosses below 50 on 1H chart MACD bearish crossover on 30M Bullish Scenario (Lower Probability - 35%): Entry Zones: Long Entry: 6,680-6,690 (upon bounce from 20 EMA) Aggressive Long: 6,650-6,660 (VWAP retest) Stop Loss: Below 6,635 Profit Targets: TP1: 6,720 (resistance retest) TP2: 6,750 (psychological level) TP3: 6,780 (Ichimoku cloud resistance) Confirmation Signals: Volume surge on bounce RSI bullish divergence on 15M Break above 6,720 with strong momentum SWING TRADING SETUP (2-4 Week Outlook) Primary Strategy: SELL ON RALLY Phase 1 - Distribution (Current): Expect choppy price action between 6,680-6,750 Ideal swing short entry: 6,735-6,760 Stop loss: 6,820 Target: 6,480-6,550 (Accumulation zone) Time horizon: 2-3 weeks Phase 2 - Accumulation (Upcoming): Watch for bullish reversal patterns in 6,450-6,550 zone Potential H&S inverse or double bottom formation Long entry upon confirmation Target: 6,850-6,950 (Next impulse wave) Time horizon: 4-8 weeks ⚠️ RISK FACTORS & MARKET CONTEXT Trap Alert: Bull Trap Risk: HIGH above 6,750 Weak volume at resistance suggests false breakout potential Head and Shoulders pattern forming on 4H chart Bear Trap Risk: MODERATE below 6,650 Strong support zone with high volume profile Potential quick reversal if broken Geopolitical & Macro Factors: Fed policy uncertainty - rate decision impact expected mid-October Q3 earnings season beginning - volatility spike likely Geopolitical tensions may trigger safe-haven flows Seasonal October volatility historically present Volume Volatility Assessment: Current State: Declining volume on rallies (bearish) Expected: Volume spike at 6,750 resistance or 6,650 support Strong Trend Confirmation: Sustained volume >15% above 20-day average 🎯 TRADING PLAN SUMMARY For Next Week (Oct 4-11, 2025): Monday-Tuesday: Expect resistance at 6,725-6,735. Look for short opportunities on rejection. Wednesday-Thursday: Gann time cycle window - increased volatility. Watch for break of 6,700 or 6,750. Friday: Weekly close crucial - below 6,680 confirms bearish bias; above 6,750 invalidates short setup. Optimal Strategy: Sell rallies into 6,730-6,750 resistance Wait for confirmation - don't chase Manage risk strictly - volatile market conditions Scale into positions - don't enter full size immediately 💡 TRADER'S EDGE Pattern to Watch: The confluence of: Bearish Bat harmonic completion RSI divergence Wyckoff distribution phase Weak volume at resistance Gann time/price square Creates a HIGH-PROBABILITY SHORT SETUP at 6,735-6,760 Critical Levels This Week: Bull Control: Hold above 6,700 Bear Control: Break below 6,650 Decision Zone: 6,675-6,725 📝 DISCLAIMER This analysis is for educational purposes only. Trading involves substantial risk of loss. Always use proper risk management, never risk more than 1-2% of your capital per trade, and consider your own risk tolerance and trading plan. Past performance does not guarantee future results. Stay disciplined. Trade the plan. Manage your risk.