
NoOneWhoIsSomeone
@t_NoOneWhoIsSomeone

ما هو الشيء الذي ننصحك بشراءه من المواد الغذائية؟
سابق في الشراء
پیام های تریدر
مرشح
NoOneWhoIsSomeone

على مدار التاریخ ، یمکن للمرء دائمًا أن ینظر إلى الوراء وتصنیف فترة من الوقت مثل "The Great War" ، "The Great Espression" ، "The Progressive Era" ، "The Gilded Age" ، إلخ. لا یوجد فکرة إدراکیة یمکن أن تحدد أننا فی فترة تاریخیة حتى نصل إلى ما یعرف بعد فوات الأوان. نقطة محوریة للتفکیر فی الماضی التی تنیر بطریقة لم تکن ممکنة من قبل. هذه الدینامیکیة الدقیقة هی السبب فی أن التاریخ التاریخی data والمخططات مهمان للغایة فی عدم التنبؤ بالضرورة للمستقبل ، ولکن من خلال النظر فی التصور المحسوب غیر ممکن بدون هذه المعلومات. لذلک ، دعونا نستخدم هذه المعلومات لصالحنا. فیما یلی بعض الحقائق التاریخیة: ~ لا تنتهی سوق الدب فی التاریخ قبل الرکود ~ لا یوجد سوق دب فی التاریخ انتهى بمعدلات رفع الاحتیاطی الفیدرالی ~ لا تنتهی سوق الدب فی التاریخ قبل محور الاحتیاطی الفیدرالی الحقیقی ~ لم یتبع أی انعکاس مستمر فی سوق الدب (US10Y-US02Y مقلوبًا منذ یولیو) و (US10Y-US03 M مقلوب فی أکتوبر). وصف الرئیس بایدن الأسبوع الماضی ، "الاقتصاد الأمریکی یتوسع ، وارتفع الدخل بشکل أسرع من التضخم". حسنًا ، شیئان: أولاً ، إلیک حقیقة بسیطة ولکنها مؤثرة ؛ منذ بدایة هذا العام ، امسحت خسائر سوق الأسهم 9 تریلیونات دولار من ثروة الأمیرکیین cnbc.com/2022/09/27/stock-market-losses-wipe-out-9-trillion-from- americans-.html ثانیاً ، إذا کانت الأجور تنمو بشکل أسرع من التضخم (نما التضخم بشکل کبیر مقارنة بالسنوات الأربعین الماضیة) ، فلماذا یظهر data فجوة هائلة بین تکالیف العمالة وأرباح الشرکات؟ epi.org/blog/corporate-profits-have-dispropedicalive-to-inflation-how-should-policymakers-respond/ من الأفضل رؤیة data بنفسک ، ولکن هنا مقتطف: أرباح الشرکات (2020 Q2-2021 Q4 = 53.9 ٪) و (1979-2019 = 11.4 ٪) تکلفة عمالة الوحدة (2020 Q2-2021 Q4 = 7.9 ٪) و (1979-2019 = 61.8 ٪) هذا هو حوالی 155 ٪ الفرق فی الاتجاه الخاطئ. (تکلفة عمالة الوحدة) کانت هذه الدینامیکیة نفسها بالضبط هی السبب الرئیسی وراء حدوث الکساد العظیم فی المقام الأول. نمت أرباح الشرکة أکبر بینما کانت أجور العمالة متخلفة بشکل کبیر. لم یقتصر الأمر على انهیار تام من الإنفاق الصناعی ولکنه سیدین الاقتصاد منذ ما یقرب من عقد من البؤس والوسطاء. دعنا move إلى الجزء الأکثر أهمیة فی المنشور وهو مؤشر الرکود المفضل لدى الاحتیاطی الفیدرالی. (US10Y-US3M). لقد تومض أخیرًا تحذیرًا من الرکود لأنه مقلوب للمرة الرابعة منذ عام 2000. فی کل مرة یحدث هذا ، کان هناک رکود تلت ذلک. قم بإقران هذا مع أزمة الطاقة فی جمیع أنحاء العالم والتی تمیزت أیضًا بإشارات رکود صالحة للغایة: من المعروف أیضًا أن سوق الإسکان یحمل غالبیة الثروة الفردیة ، لذلک دعونا نلقی نظرة خاطفة على المکان الذی یقف فیه: یضمن هذا الرسم البیانی من منظور تقنی تقریبًا قمة محلیة بعد ارتفاع أسعار المساکن بنسبة 27 ٪ تقریبًا بعد الانتعاش عام 2020. ألق نظرة على RSI المقترنة بالتسارع السریع إلى الاتجاه الصعودی. ما یلی واضح جدا ، على الأقل محلیا. ومن المثیر للاهتمام ، أن ذروة المحور/التضخم فی مجلس الاحتیاطی الفیدرالی هی من بین أکثر الروایات التی یتم نقلها على طول وقیمة الاسمیة ، فمن المنطقی ، ولکن بمجرد الغوص ، فإن الأمر أکثر تعمیقًا ، إلا أن الأمر لا معنى له. اسمحوا لی أن أشرح: فیما یلی التضخم المتراکب مع معدل صندوق FEDS: کما ترون ، لم یکن الاحتیاطی الفیدرالی فی وقت متأخر من الحزب فیما یتعلق بالسیاسة لمکافحة التضخم (ربما یکون مقصودًا بسبب الدیون الأسیة) ولکن لم یکن ذلک أیضًا حتى تتطابق أسعار الفائدة على مستوى التضخم عندما بلغ التضخم ذروته حقًا. لم یتم الوفاء بهذا الیوم. علاوة على ذلک ، دعونا نرى ما یحدث بمجرد محور بنک الاحتیاطی الفیدرالی ویبدأ فی تقلیل المعدلات مرة أخرى: مرة أخرى ، إذا لاحظت متى بدأ بنک الاحتیاطی الفیدرالی فی تقلیل المعدلات ، فإن السوق لم یکن act الطریقة التی یتوقع بها الجمهور أن یتفاعل الیوم. إنه اقتراح غیر بدیهی لأنه من الإیجابی أن السیاسة النقدیة أکثر ملاءمة ولکن لماذا تنخفض معدلات الاحتیاطی الفیدرالی؟ على الأرجح بسبب الضعف الاقتصادی. إذا کان بنک الاحتیاطی الفیدرالی یمسک بثقة ، فهذا یعنی أن الاقتصاد لا یزال سلیماً وقادرًا على تحمل وطأة التأثیر. یتم تفویت هذه الدینامیکیة من قبل غالبیة کبیرة من المشارکین فی السوق. شیء واحد أرید الترکیز علیه فی المخطط الأخیر هو استراحة الاتجاه لمدة 40 عامًا للسیاسة النقدیة. نرى هذا الاستراحة فی جمیع المخططات التی تمثل العائد/المعدلات من حیث القطاعات الحکومیة. على سبیل المثال؛ إلیکم US10Y: کسر الاتجاه لمدة 40 عامًا بالإضافة إلى الرهن العقاری الثابت لمدة 30 عامًا ، یفعل نفس الشیء بالضبط: هذا بالنسبة لی یشیر إلى أننا فی فترة انتقالیة تاریخیة. إذا کان هذا هو الحال فی الواقع ، فهذا یعنی أننا سننتقل من الاتجاه القدیم إلى اتجاه جدید. الآن دعونا نفکر فی الاتجاه الذی کنا فیه على مدار العشرین عامًا الماضیة. لقد کان کمی الفلکی والطباعة النقدیة التی لا نهایة لها والتی جلبتنا إلى الیوم. ماذا یوجد على الجانب الآخر من هذه العملة؟
NoOneWhoIsSomeone

This is going to be a very extensive post so it will take some time to fully grasp most of these concepts but I am going to try my best to explain my perspective of the current economic landscape and what implications certain factors can have going forward. First, let us look at the Original Chart in the post and explain it: As you can see I have laid out the Resistance and 3 different layers of support. One local support at ($3850) and Two long Term Supports at ($3400) & ($2850) respectively. Current Criteria: IF the price pushes past the current Resistance labeled in the chart , I expect more upside over the next few weeks to months as the market expands and ignores recession fears for now. Remember, in this scenario, markets can remain irrational FAR longer than you can remain solvent. IF the price rejects off of this Resistance , it highly suggests Local support will be tested and if that is lost then the two long-term supports will come into play. I have labeled why the price would make it there and where the sentiment would likely be in this scenario. Now let's try to understand the current Recession Delima and where we stand: Today we live in a world where the past isn't considered a measure. To be a historian today would mean you would be doubted by most, saying "This time is different", "Past performance is not indicative of future performance", "Dinosaurs didn't exist", Etc etc. Our perception of the world and the lives we live are constantly changing. This new digital Era has connected the world in ways never seen before in humanity. So inherently, the way we think, what we believe, and how we anticipate the future has changed and is ever-changing. So much so, that even the most basic understanding of an economy comes into question. Over the last week, we have seen the "Definition" of a Recession be explained in vastly different ways. To such an extent Wikipedia actually blocked any edits in relation to the actual definition. The White House has downplayed Recession fears repeatedly and we have heard Powell mention a "Strong economy" just about every time he has spoken. Let us ask ourselves this first; what were these same people saying before the snowball actually started to roll down the hill? "Inflation is transitory", "No Recession Risks". Today we find this guidance to be incredibly misleading and incorrect. "But no one could have predicted this".... Wrong. Many people saw the red flags and predicted the tailwind effects of these dynamics. Even if the ones in power ultimately know, they can never let us in on the "know". If you've ever run a company or led any kind of extensive group, there are information highways. Certain information goes to certain groups, while others are left in the dark. Think of us, the regular working-class individuals, as the group that's left in the dark. Governments are run on the base concept of the people do not know what's best for them so we created a system that we believe will lead to better decisions for the betterment of society. A real downside to this reality is that there will always be a communication deficiency between the Government and the People. This is where the strange Re-Definition of a Recession comes into play. A commonly accepted definition of a Recession is simply, Two or more Quarters of Negative GDP Prints. We have seen just that. Although this isn’t the end all be all definition, it is one check mark down. "Real gross domestic product (GDP) decreased at an annual rate of 0.9 percent in the second quarter of 2022, following a decrease of 1.6 percent in the first quarter. The smaller decrease in the second quarter primarily reflected an upturn in exports and a smaller decrease in federal government spending". bea.gov/data/gdp/gross-domestic-product But US President Biden rejected the idea that the U.S. is in a recession, and instead touted continued job growth, low unemployment, and growing investment from manufacturers. Sure these are valid reasons, but WHY is that the case? Is it from pure organic growth or is it coming after the complete shut down of an entire country for 2 years? To put the job growth into perspective, we aren't even back to 2020 Employment levels before Covid hit: tradingeconomics.com/united-states/employment-rate So to play their game, What exactly is the definitely of Job Growth or Strong Employment? You see, words and data can be very misleading. This is why, "Don't trust, but verify" is crucial to surviving in this world. If you're waiting on someone to give you a warning or for someone to give you the official green light on something, you'll hear about it after it's already too late. It is very likely if there is a true Recession coming, most officials won't claim it so until we are already about 25% into it. We may very well look back on today a year or two from now and think, "It was so obvious". Now that we have covered the psychological aspect of the situation, let us look at it objectively and with some charts. Here I will first show a comparison between 2000 and 2008: This shows the Price Action of both 2000 and 2008 leading up to the ultimate wipe-out of the economy. I have labeled the percentage (%) of Drawdowns relative to both the peak and the rejection off resistance. These percentages can prove important because it reflects a potentially pivotal point in which the market finds a new Fair Value. Now, if we look at our current position, you can see just how similar the Price Structure is. Price has seen a significant breakdown and then followed up with a retest of this support that has now turned resistance. I have labeled the same percentages as 2000 & 2008 just so the comparison can be made and why these levels are truly significant: We are currently seeing the retest of the lost support, which occurred both in 2000 and 2008 very similarly. Although it is not guaranteed to repeat, it is something significant to note nonetheless. Next lets look at the US10Y-US01Y which has been a signal for the last 6 Recessions, which occurs after there has been a significant Yield Inversion: (I have outlined each time we have seen the beginning of the inversion so what happens after can be perceived) If you look at the chart, you can see there has been a significant inversion after inverting for a very short time back in March. We haven’t seen an inversion of this caliber since 2000 and 2008. To further support this development, if you just look at the US10Y, you can see it has once again parabolically rallied from its sharpest drop to its strongest impulse up to reach the historical trend line: I have labeled what has occurred following this development, as well as showing SPX in relation. Pay attention to each RSI level as well. Okay? So What? You can also say there have been gains after an inversion occurred… Sure this is true, but ask yourself this, are you prepared, and do you have a well enough plan laid out to properly secure those profits when the time comes? You have to remember, timing is absolutely everything so while an Index may have a 10% rise overall if you didn’t buy the absolute bottom, that 10% would actually be more like 5% or 6% for you. Furthermore, unless you sell with the right timing, those profits are not secured. Let's lay out some quick math because this concept seems to be missed by quite a few. Let us say an index goes from 1,000 to 6,000 and generated a 500% return on your money. Great. So now why worry about just a correction when you are up 500% already? Well, here's a reason… A 50% correction from this level does NOT leave you with a 450% gain. Instead, a 50% correction subtracts 3,000 points, reducing that 500% gain to just 200%. Then the problem becomes of regaining those lost 3,000 points to recover lost profits or to cut and make sure that the last 200% profit is secured. Long story short, profits are not profits until you sell. End of story. These decisions could mean early retirement or no retirement. I know this is a really extended post but let's touch on just a few more things I deem very important. Let's take a look at the Dow Jones (DJI) and see where it stands: Here you will see a very similar approach in a few other charts below where I have labeled the Deviations from the original trend which marks a “Blow off the Top” type of event. Whenever the value is extended beyond usual terms, is when the chances of a significant reversal increase. It marked warnings for both 2000 and 2008. Next, let's look at an aspect of the Housing Market which would be the Average Sales Price of Homes sold in the US: As you can see I have once again labeled a possible Deviation. This along with the massive RSI Divergence building over a 40-year period, the “Safe Heaven” of the housing market may not be as bulletproof as most would believe. Furthermore, let's analyze the 30-Year Fixed Rate Mortgage Average in the US: We have seen the sharpest impulse in Fixed Mortgages since 1980 and a possible break of a 40-year downtrend. What exactly would that mean for new homeowners over the next 20 years? Moving on, let's look at the VIX and what it can mean for the market: A general rule of thumb is if using the VIX as a reference, you want to look for positions when VIX is at significant resistance (Or after a parabolic rise) and you want to exit positions/use caution when VIX is at support. This is very prevalent in thinking Medium/Long term. As you can see the VIX has been steadily trending upwards since February of 2018 and I have labeled other points in time for reference. Here’s a small reference to DXY which has had a historical rally in a time that no one really expected: As you can see there has been a breakout of very important resistance, and if DXY holds strength and investors continue to value the dollar in ways not consistent in the past, liquidity will remain dry in relation. Now, let's talk about USOIL which holds a significant % in CPI changes. If Oil/Energy continues to climb here over the next few months then so will CPI. If Oil falls below its deviation zone, then CPI will likely subside for some time before any significant changes. Here is a reference to see this deviation level with respect to the SPX: I have marked every time USOIL lost this level to see possible effects. This does not mean the "Inflation Peak" narrative is one of any substance. Inflation peaking will not inherently change anything as it will take most likely Years to get Inflation down to FED target of 2%. So the actual strain of inflation on most of society will remain even despite an inflation peak. In fact, If CPI prints at 0% every single month between now and December, we will still finish 2022 with 6.3% YoY inflation. Also, in 2000 and 2008, it wasn't until after USOIL lost its deviation zone is when the worst was seen in the economy. Remember again, all those that said Inflation is "Transitory", "Controlled", and "Peaking" were all dead wrong. Remember that despite the consensus and despite leadership, the SPX Year-To-Date Performance (In Real Terms) is the WORST since 1872. That may sound extreme but check for yourself (Source: BofA Global Investment Strategy, Bloomberg). Please keep in mind even if Markets continue to rally, DONT forget where we are and where we were. As everyone has said this would be the most anticipated Recession of all time, it will likely be when everyone either forgets about it or expects the worst is over, which is when the Recession actually hits. Stay Focused. To further understand more about the current Economy I will refer you to my last extensive post on the SPX which I will link here below: This post expands on things I do not touch on here and will give greater insight overall. Most information is complementary to each other from post to post, so the more you understand about one, the more you will understand about the other. If you've made it this far into the post I would like to Thank You immensely for taking the time to read the analysis. My goal is to expand thought and perspectives to hopefully give a greater understanding of the current situation. Please let me know if there are any questions, as I would be more than happy to answer or converse on the subject. Again, Thank you!
NoOneWhoIsSomeone

کنت أنتظر نشر تحدیث عن BTC لأن هناک تطورات دراماتیکیة فی هذا المجال. لقد رأینا أخیرًا الاستسلام الذی حددته على مدار الأشهر القلیلة الماضیة والآن حان الوقت لإعادة التقییم. هل وصلنا إلى قاع طویل الأجل، هل یتجه BTC إلى مستویات قیاسیة جدیدة قریبًا؟ من المرجح أن No.Crypto لأول مرة فی حیاته وجدت نفسها فی خضم أزمة اقتصادیة. لیست أزمة فی بلد واحد فقط، بل فی العالم بأسره. أدى هذا إلى انهیار LUNA، مما أثر على Three Arrows Capital لتصبح مفلسة، إلى جانب تجمید Celcius لجمیع الأصول وقفل جمیع رأس المال من أی شخص لدیه حساب. یمکنک تصنیف هذا على أنه FUD ولکننی سأذکرک أن هؤلاء هم قادة الصناعة. الرواد الذین کان من المفترض أن یقودوا تطور Crypto، لکنهم اختاروا الجشع على صحة المستقبل. هؤلاء هم فقط من نعرف عنهم، ومن المرجح أن تخلق التأثیرات المتتالیة waves لبعض الوقت فی المستقبل. لقد خسرنا مئات الملیارات فی هذه الکارثة. ویمثل ذلک القیمة السوقیة الإجمالیة هنا والتی وجدت نفسها عند المتوسط المتحرک لـ 200W مع انخفاض مذهل بنسبة 75%:ولم نصل بعد إلى "الرکود". وقد نمت التوقعات إلى احتمال 50% بأن الرکود أمر لا مفر منه. وللنظر إلى الموقف بموضوعیة، لن أدلی بأی توقعات hard، بل سأقدم معاییر واضحة للصعود أو الهبوط على المدى القصیر فی الوقت الحالی. إذا نظرت إلى الرسم البیانی أعلاه، فقد حددت قناة زرقاء مهمة جدًا لـ BTC. إذا تمکن السعر من الإغلاق فوق قاع القناة الزرقاء، فمن المحتمل أن یکون هناک صعود على المدى القصیر. إذا تمکن السعر من الإغلاق أسفل قاع القناة الزرقاء، فمن المحتمل أن یکون هناک هبوط على المدى القصیر. هناک طریقتان لرسم هذا الرسم البیانی، وکلاهما یمثلان نفس المستویات ولکنهما یشیران إلى أشیاء مختلفة قلیلاً:إذا لاحظت فی هذا الرسم البیانی، یمکنک أن ترى مدى سوء المکان BTC حالیًا. لم ینهار السعر من أسفل القناة الهابطة التی کان فیها فحسب، بل إنه الآن یعید اختبار هذه المنطقة هبوطیًا. ولکن مرة أخرى، تظل المعاییر کما هی. هذا هو الوقت الذی ستستمر فیه الأشیاء خارج عالم العملات المشفرة فی التأثیر على هذا المجال، لذا إذا کنت تبنی منظورک حالیًا على العناصر المتعلقة بالعملات المشفرة فقط، فستجد أن الأشهر القلیلة القادمة وما فوق ستکون مربکة للغایة. أدرک أننی ترکت هذا المنشور دون الإشارة إلى أن القوى خارج عالم العملات المشفرة ستستمر فی التأثیر على السوق، لذلک اعتقدت Id link ما قصدته بذلک. آمل أن یمنحک هذا منظورًا أکبر: کما ترى، لا یزال السعر معلقًا تحت المقاومة وهو مکان رهیب لبقاء BTC. وهذا یعنی فی الصورة الکبیرة أن أحجار الدومینو لا تزال جاهزة للاستمرار فی السقوط. لا یبدو أننا وصلنا إلى نهایة أی شیء، وما زلت أحاول فقط الإبحار فی المیاه. لقد مر بعض الوقت منذ منشوراتی القلیلة الأخیرة ولکن صدق أو لا تصدق، لم یتغیر الکثیر. إذا کان هناک أی شیء فقد ساءت الأمور قلیلاً مع انعکاس آخر لمتوسط سعر الفائدة الأمریکی 10 سنوات-متوسط سعر الفائدة الأمریکی 02 سنة والذی یضمن فی الأساس رکودًا کاملاً. نعم، لقد قرأت ذلک بشکل صحیح، فنحن لم "ندخل" الرکود رسمیًا بعد. أرى مرارًا وتکرارًا "القاع موجود" أو وقت "الارتفاع". أعتقد تمامًا أن وقت الأموال السهلة انتهى فی عام 2021. ما یتوقعه الناس بعد طفرة 2020، شوه التوقعات فی جمیع المجالات. إنها سوق غبیة مدفوعة بالمال مع محاولة التجزئة front الرکض فی کل انخفاض، لکن الشیء الذی یجب فهمه هو أن "الأموال الذکیة" الحقیقیة تعرف أن هذا یحدث، وبدلاً من محاربة السوق، فإنها تصطاد مشتری الانخفاضات بالتجزئة. إنهم یغریونهم، ثم یقضون علیهم، ویکررون ذلک. لا أحد یعرف إلى أین یتجه السوق، لکننا نعرف المشاعر والعادات البشریة. أردت فقط أن أقدم بضع کلمات للتحدیث لإظهار أین عقلیتی وأننی أقوم بتطویر المزید من التحلیل. فی وقت مثل الیوم حیث من المؤکد أننا سنسجل فی کتب التاریخ، لا أعتقد أن الکثیر من المنشورات تخدم أی عدالة. إن التفاصیل المهمة والمحددة للغایة هی التی تهم. ترقبوا!
NoOneWhoIsSomeone

Anyone who has followed me for a while has already seen some iteration of this chart, but I bring it up again today because it has proven to be one of the most reliable charts to date. It is essential to understand when we are looking at charts, sometimes it is not about the actual chart itself but rather what the data means and the implications. We are in unprecedented times. The FED is behind the curve and now they are trying to gain back control of the Inflation Train but there is only one problem; The train has already left the station. Prediction after prediction of Inflation is "Transitory", "Peaking", "Controlled". They even have gone as far to say Inflation was a "good" thing. https://www.washingtonpost.com/opinions/2021/07/22/republicans-are-scaremongering-about-inflation-derail-democratic-agenda/ https://www.forbes.com/sites/georgecalhoun/2021/05/01/the-inflation-scare-doesnt-match-reality/?sh=7bcc94c71049 https://www.cnbc.com/2021/06/26/inflation-looks-bad-now-but-its-pretty-much-sticking-to-the-script.html This one in particular used to be Titled "Why the inflation we're seeing now is a good thing" But they have since changed that to something more cryptic as if we the people are dumb: https://www.msnbc.com/opinion/how-covid-became-unlikely-hero-our-inflation-crisis-n1283443 I just wanted to establish that before I went any deeper. Credibility is not seen in today's world. Currently, Total Revolving Credit is at a historical all-time high by a long shot. (Please go check out a chart representing this data) It not only represents the hardship most are suffering but it solidifies the fact that most can't maintain their current lifestyle with cash. As financial situations grow tighter, it forces people to then start running their credit in the face of the "Recession". This is not only bad for now but it condemns the future as well. Because that problem is only solved by rapid economic deceleration or by propping the market back up with Easy Monetary Policy. But there is a critical issue here, the FED can't possibly pivot Dovish now. Their party has only just started. QE/Stimulus, paired with Macro cyclical patterns, and Geopolitical tensions force the FED to stay the course. If they pivot now, not only will no real problem be solved, but it will inherently make them worse. Back on the Credit Delima, we have also seen the sharpest credit impulse contraction in 10 years. Liquidity runs all markets, when liquidity is dried, it causes mayhem. Okay so what about USOIL and why is it on the chart? Well as you can see, each time USOIL has significantly deviated from its current trend, it has led to a recession. 6 Times in the last 20+ years has this perfectly signaled economic hardship. This time is no different. Even further still, 2 out of the last 3 times, it was not until after USOIL has peaked is when the most pain was to be had. Combine this with 50 Year High Inflation, War, FED hiking into a slowing economy, QT, Supply Chain shocks, Sanctions/Embargoes, Energy soaring, and Gas at $4-5 in every state in America for the first time in history. Ask yourself this, if this recipe isn't enough for concern, what exactly is? Continuing on, let's focus on a few other charts: First, let's just take a look at where SPX & NDQ currently stand: As you can see, both have only just now reached Mid-Channel and still have quite a ways until the bottom of the channel. Second, let's remind ourselves of the US10Y-US02Y Curve inversion that took place a few months back. This inversion has predicted the last 6+ Recessions, just as the exponential rise in Energy has. Here is my first post explaining this correlation with SPX: Here is an Updated View: As you can see, it may even be headed for a second Inversion which would likely be another huge red flag. Third, Lets look at the Tech Leader AAPL and see where it stands. AAPL represents the leader of the tech market and where AAPL goes, the market goes. Here is my most recent post: Fourth lets look at the DXY and consider where it stands. It currently is in the midst of a 30+ year breakout, further proving the economic hardship most are facing. Furthermore, in times of great fear and inflation, money is usually the last thing people want but yet here we see the opposite playing out. Complete deviation of a regular historical trend: And Fifth, let's just speculate on the worst possible outcome here, which I did a little while back when I Noticed Elon Musk somehow timed the exact top in the Market (See for yourself below): I thought his perfect timing was really strange and led to the credibility of his words. Although the chart seems extreme now, from a technical standpoint it absolutely is possible as I've laid out. Although it's important to consider the worst, it is critical you don't expect the worst. Many things can change between now and the end of the year which is why it is important to stay updated and pivot when needed. I can honestly go on about specific factors such as the housing market and the VC's/Hedge Funds controlling supply while cutting out the regular buyer. Not to mention companies like Zillow doing the same exact thing, basically acting like a Broker to the overall housing market. Cutting out an entire class of buyers because theoretically, they don't ever have to sell to regular families just trying to buy a home. Global food shocks from inflation make fertilizer unaffordable to harvest the right yield of crop. As well as the Ukraine War making it even more difficult. China causing supply chaos because they have locked down their country again, 2 years into the pandemic. This thesis is only valid in the scenario it takes far longer to tackle these challenges listed above. If the FED and the overall World Economy can begin to tame these challenges better than what we have seen thus far, things will begin to become more positive. No matter what, these challenges must be solved not only for the health of the economy but for the betterment of the people. If you've made it this far, I thank you immensely and you will be rewarded for putting in the effort now to understand the big picture. Leave any opinions below;As we have seen, Markets continue to weigh CPI expectations and a FED "Reversal" but price steadily ranges lower. It means in the big picture, the dominoes are still ready to keep falling. We do not seem to have reached the end of anything, and I'm still just trying to navigate the waters. It's been some time since my last few posts but believe it or not, not much has changed. If anything things have gotten a bit worse with yet another US10y-US02y inversion which basically guarantees a full-blown recession. Yes, you've read that right, we haven't even officially "Entered" the Recession yet. I see over and over "Bottom is in" or time for "Rally". I wholefully believe the time for easy money ended in 2021. What people have come to expect after the 2020 Boom, has tainted expectations across the board. It's a dumb money-driven market with retail trying to front run every dip, but the thing to understand is the real money "Smart money" knows this is happening, and rather than fighting the market, they are preying on retail dip buyers. They bait them in, and then they wipe them out, rinse and repeat. Nobody knows where the market is headed, but we do know human emotions and habits. Just wanted to give a few words for an update to show where my mindset is and that I'm developing more analysis. In a time like today where we are for sure going down in the history books, I do not believe a ton of posts serve anyone any justice. It's the important, very specific details that matter. It takes a long time to develop these points and structure them in a way that is useful for the many. More posts will be coming. Stay Tuned!
NoOneWhoIsSomeone

إذا وجدت نفسک تتساءل لماذا لم یفعل BTC شیئًا سوى التراجع وforth لمدة شهر تقریبًا الآن، فلا تبحث أکثر. یمثل هذا آخر بقایا الاتجاه الصعودی الحالی. لم یکن هذا الدعم الصامد هو حالتی الأساسیة لـ BTC حیث کنت أتوقع أن یجد السعر نفسه على الأقل عند 200 MAW لفترة طویلة الآن. هناک شیء مهم یجب ملاحظته وهو أن هذه القناة تعتمد فقط على اعتبار قاع کوفید نقطة صالحة على الرسم البیانی. أعتقد أنه یمکن تقدیم حجة مفادها أنه نظرًا لأنه کان حدثًا کاملاً مثل البجعة السوداء (قیمة شاذة)، فمن المعقول أن نأخذ النقطة الصالحة التالیة والتی ستکون هنا: کما ترى، فإنه یرسم صورة مختلفة تمامًا، ولکن مرة أخرى، أعتقد أن الصلاحیة متروکة للتفسیر هنا. هناک شیء واحد یجب أن أشیر إلیه وأعتقد أنه مهم جدًا وهو المقارنة مع موجات الصعود السابقة. إذا ألقیت نظرة على الرسم البیانی؛ فإنه یوضح لک الرفض القوی الذی کان لدى BTC قبل الاختراق مما أدى إلى انفجار القمة (مایو 2021). کل دورة فی الماضی أدت إلى ارتفاع مکافئ عندما تم کسر هذه القناة وعندما لم یحدث هذا هذه المرة، کان السوق مرتبکًا. اعتقد صناع السوق أنهم یستطیعون الضغط على المزید قلیلاً (وهو ما فعلوه) لأننا لم نر ذلک ینفجر من القمة و BTC ارتد مرة أخرى فی یولیو 2021. وجهة نظری العامة هنا هی أن هذا یوضح لنا أن هناک قمعًا حقیقیًا فی الأسواق. هناک قوى دوریة فی المزیج. شیء أعظم من سیاسة بنک الاحتیاطی الفیدرالی لأن تذکر، فهی مجرد ردة فعل. إذا لم یجبرهم السوق، فلن یتصرفوا أبدًا. لذا فهم مجرد بیدق على رقعة شطرنج کبیرة. أتحدث عن بنک الاحتیاطی الفیدرالی لأن سیاسته تؤثر على سوق الأسهم، مما یؤثر بدوره على العملات المشفرة. یبدو أن الکثیرین لا یعرفون هذا، لکنها نفس الکیانات الکبیرة التی تلعب فی کلا السوقین. نفس الأموال الکبیرة التی تسبق الأسهم، وأیضًا (Id یجادل بشکل أکثر دقة) العملات المشفرة. الاقتصاد العالمی فی حالة صعبة للغایة. بین التوترات الجیوسیاسیة، وقضایا سلسلة التورید، وارتفاع أسعار الطاقة (Gas عند 5.00 دولارات)، والتضخم الذی لا یزال مستعرًا، وأزمة الغذاء، وما إلى ذلک، تتأثر حیاة العدید من الناس حقًا. لا یستطیع العدید من الناس حتى تحمل تکالیف حیاتهم والحفاظ على سقف فوق رؤوسهم، ناهیک عن أولئک الذین ما زالوا یحاولون زیادة ائتمانهم إلى أقصى حد لمواکبة ذلک. بلغ إجمالی الائتمان المتجدد تاریخیًا أعلى مستوى له على الإطلاق (ابحث عنه). على مدار السنوات القلیلة الماضیة، کان هناک قدر غیر مسبوق من الأزمات. یتمکن الأغنیاء من الاستفادة من هذه الفرص ویعانی الفقراء من العواقب. لم تکن فجوة الثروة التی نراها الیوم أکبر من أی وقت مضى فی حیاتنا وبصراحة بعد ذلک. ستکون هناک عواقب لدفع ثمن فجوة الثروة هذه التی محت الطبقة المتوسطة تمامًا. ببساطة، کان من المدهش أن نرى ثبات الأسعار لفترة طویلة فی هذه المنطقة دون ارتفاع أو انخفاض. وهذا یُظهر مدى عدم الیقین الموجود. أستطیع أن أسوق حجة قویة تفسر لماذا لن نرى تحرکات قویة طویلة الأجل نحو الصعود لفترة طویلة، ولکن هذا لیس الغرض من هذه التدوینة. وسوف أعقب على ذلک تدوینة أخرى. أما الآن، فأنا أرید فقط أن یتحدث الرسم البیانی عن نفسه ویدافع عن قضیته دون ضجیج. وفی حین أتطرق إلى بعض الأمور التی أعتبرها مهمة، فأنا أدرک أن هذه تدوینة مطولة، ولکننی أعتقد أنه من المهم أن نوسع إدراکنا ونفهم الأساسیات الأوسع نطاقاً لأن کل أحجار الدومینو تسقط فی النهایة بالترتیب. وبمجرد أن تفهم هذا، یصبح من الأسهل رؤیة الصورة الکبیرة بدلاً من الصورة الصغیرة. والشیء الأخیر الذی سأقوله والذی أعتقد أنه الأکثر غرابة على الإطلاق، هو الانتباه إلى الجزء السفلی الأیسر من الرسم البیانی. هل لاحظت أن الفتیل الممتد کان فی الحادی والعشرین من نوفمبر/تشرین الثانی 2011 بالضبط؟ ألیس من الغریب حقاً أن یمثل أحد الفتیلین قمة وقاع هذه القناة بالضبط؟ لا أستطیع حقاً أن أفهم ذلک. على أیة حال، تحیاتی
NoOneWhoIsSomeone
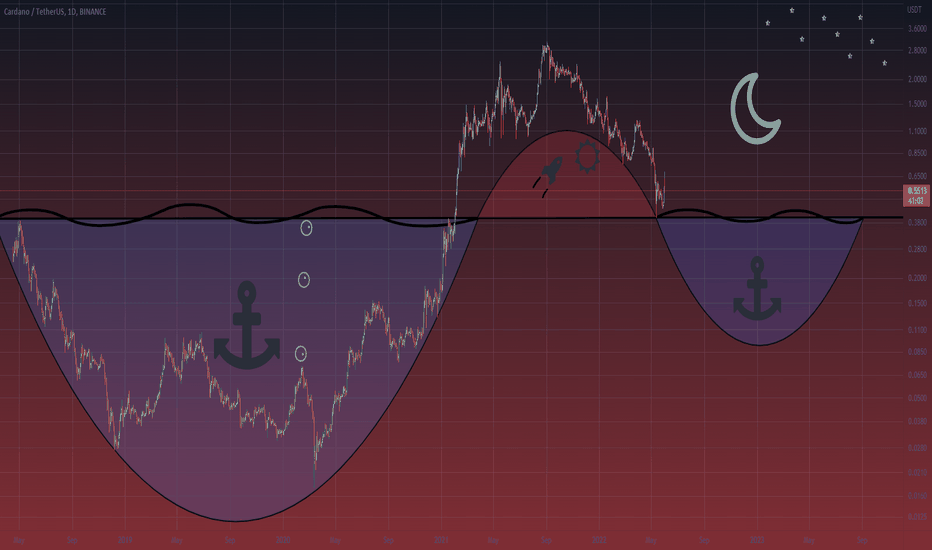
کما حدث مع إیکاروس، استمتع Cardano برحلته نحو الشمس. ولکن بنفس السرعة التی تأتی بها النشوة، تمر أیضًا. لقد انقلبت المشاعر تجاه ADA بلا شک على مدار العام الماضی. تحول هذا المشروع من أحد أکثر المشاریع المحبوبة إلى أحد أکثر المشاریع إثارة للشکوک. إذا ضاعت علامة (0.40 دولار) المشار إلیها فی الرسم البیانی، فهذا یعنی safe أن الشمس قد غربت وسیتعین على حاملی ADA ارتداء معدات الغوص الخاصة بهم. ستکون رحلة طویلة تحت الماء.
NoOneWhoIsSomeone

لقد لعب نمط الرأس والکتفین الواضح دورًا مشابهًا جدًا لسوق الدببة لعام 2018. فی المرة الأخیرة التی رأینا فیها هذا النوع من الانهیار، یمکننا أن نرى أن فتائل القاع کانت متشابهة جدًا ولم تشیر إلى قاع. یقع الدعم الأول عند 1450 دولارًا. الدعم الثانی، إذا رأینا رکودًا عالمیًا، هو 460 دولارًا. أعلم أن الهدف الثانی یبدو مستحیلًا ولکننی أعدک أنه إذا حدث رکود عالمی، فسوف یصبح واقعیًا بسرعة کبیرة. فی الوقت الحالی، نستهدف الدعم الأول فقط. آمل أن یساعدک هذا، حظًا سعیدًا! ما زلت واثقًا جدًا من هذا. یجب أن نتذکر أن هذا یستغرق أسابیع وحتى أشهرًا حتى یتم تنفیذه، لذا تظل الأهداف العامة کما هی. سنتطلع إلى التحدیث بشأن القیعان المحلیة المحتملة حیث سیحاول السعر الارتداد. فی النهایة، لا یقترب الاتجاه من التغییر على المدى المتوسط/الطویل.
NoOneWhoIsSomeone

هذا سیکون مجرد تحدیث قصیر المدى لـ BTC حیث نرى أخیرًا شکلًا منظمًا بعد حمام الدم الأخیر. هذا إعداد فنی بحت على LTF. إذا کنت تتساءل عن العنوان، فهو فی إشارة إلى علم الدب الذی جلبنا إلى هنا فی المقام الأول. ومع ذلک، ها نحن ذا مرة أخرى... آخر شیء یجب ملاحظته هنا هو أن BTC لم یصل أبدًا إلى قاع طویل الأجل بهذه الطریقة. سیکون لدی تحلیل متابعة لدعم هذا الادعاء. فی الوقت الحالی، فقط ثق فی خطوط الاتجاه فی الرسم البیانی. شارک بأی أفکار أدناه؛
NoOneWhoIsSomeone

الأسواق فی حالة بیع مفرط، وبقدر ما هی البیئة الکلیة سیئة، فإن الأمور لا تتجه نحو التصاعد فی هذه اللحظة بالذات. وأظن أننا سنستمر فی رؤیة الزخم یتأرجح نحو الارتفاع على المدى القصیر مع توجهنا إلى بقیة هذا الأسبوع. ومن الممکن أن نشهد تحرکًا خاطئًا یوم الاثنین، لکن التحلیل الفنی یشیر إلى فرصة عادلة للارتداد. والآن، هذا لا ینتقص من معنویاتی العامة على المدى المتوسط. لأنه إذا نظرت هنا، فإن الأمور على نطاق الاقتصاد الکلی لا تزال معرضة للخطر: هذا هو مؤشر ناسداکى الذی قاس عدد الأیام التی استغرقها مؤشر NDQ لإعادة اختبار 50ma شهریًا. لقد تجاوزنا الآن آخر مرة بـ 607 أیام. وهذا یقترن بالسعر الذی لا یزال یهبط فی منتصف القناة مما یشیر إلى اتجاه هبوطی على المدى المتوسط. انتبه أیضًا إلى مؤشر القوة النسبیة. یبدو الأمر وکأنه ارتفاع فی سوق الدببة کما هو معتاد. وهذا أیضًا سیناریو یوم القیامة بالنسبة لمؤشر ستاندرد آند بورز 5000: هذا هو عرض الاقتصاد الکلی للرجوع إلیه: أظن أنه مع استمرار السوق فی الارتفاع، سیظهر باول ویهدئ الأسواق مرة أخرى مع استمراره فی القتال من أجل استقرار الأسعار والحفاظ على موقف متشدد. فی الوقت الحالی، نرکب الموجة المحتملة لإعادة اختبار المستوى المفقود والانطلاق من هناک! یرجى التعبیر عن أی آراء أدناه؛
NoOneWhoIsSomeone

وبینما نقترب من مفترق طرق حاسم فیما یتعلق بالوجهة التی تتجه إلیها الأسواق، دعونا نلقی نظرة سریعة على کیفیة وصولنا إلى هنا. إلیکم منشور SPX الذی نشرته فی 23 مارس. وصل السعر أخیرًا إلى الدعم على الرسم البیانی. انظر بنفسک: الشیء الغریب هو أن NDQ (تم النشر فی 22 مارس) لم یصل إلى نفس النوع من الدعم طویل المدى: إذا قارنا ببساطة Boom 2020 VS Now:(2020 Boom) ~ تصحیح SPX بالفعل بنسبة 35٪ ~ انخفاض التضخم ~ الاقتصاد المتنامی ~ خفض بنک الاحتیاطی الفیدرالی أسعار الفائدة إلى 0٪ ~ برنامج التیسیر الکمی من بنک الاحتیاطی الفیدرالی ~ 10 أوراق شروط بنک الاحتیاطی الفیدرالی ~ وفرة السلع ~ لا حروب ~ لا عقوبات ~ لا یوجد جائحة ~ لا توجد أزمة غذاء عالمیة (الآن) ~ تصحیح SPX بنسبة 19٪ فقط ~ ارتفاع التضخم ~ تباطؤ الاقتصاد ~ رفع أسعار الفائدة من قبل بنک الاحتیاطی الفیدرالی (من المحتمل 8 زیادات) ~ QT من بنک الاحتیاطی الفیدرالی ~ لا توجد أوراق مصطلحات من بنک الاحتیاطی الفیدرالی ~ ندرة السلع ~ حرب روسیا / أوکرانیا ~ العقوبات ~ الوباء (الصین مع عدم وجود إغلاق لسیاسة کوفید) ~ أزمة الغذاء العالمیة الآن بعد أن اختبر السعر دعمًا لمدة 13 عامًا، حسنًا، الإجابة لیست دائمًا بهذه البساطة. إذا استمرت الأمور على هذا المسار نفسه أو حتى أسوأ، وبدأت فی الانهیار أکثر، فهذه توقعات معقولة جدًا إذا واجهت رکودًا عالمیًا. والأمر الأکثر إثارة للاهتمام، انظر إلى < 0> تغریدات Musk التی یبدو أنها قد جاءت فی توقیت مثالی. هل هذه صدفة غریبة حقًا أم أن لدیه إمکانیة الوصول إلى المعلومات التی لا نملکها؟ على أی حال، لتعزیز بعض النقاط، لدینا أیضًا طاقة مرتفعة أو بشکل أکثر تحدیدًا النفط. سأترک هذا هنا کمرجع. یشرح هذا المنشور الوضع جیدًا: هناک شیء آخر یجب مراعاته وهو العائدات الأمریکیة وارتباطها بسوق الأوراق المالیة: لقد شهدنا انعکاسًا فی العائدات وتزایدًا حادًا فی العائدات والذی کان بمثابة مقدمة لفترات الرکود الستة الأخیرة. آخر شیء شیئان یجب أن نترکهما هما أزمة الغذاء العالمیة وشیء أخیر یتعلق بعائدات سندات الخزانة الأمریکیة. وإلیک العقود الآجلة للقمح بالمقارنة مع ما قبل الأزمة المالیة العالمیة فی عام 2008: وعوائد سندات الخزانة الأمریکیة فیما یتعلق بالرکود/الانهیار السابق فی سوق الأسهم: هذا المنشور لیس بالضرورة تنبؤًا، بل مجرد اعتراف بإمکانیاته. إذا رأینا رکودًا عالمیًا، فهذه نظرة واقعیة للغایة فی رأیی. وإلیک التوقعات على المدى القصیر:
إخلاء المسؤولية
أي محتوى ومواد مدرجة في موقع Sahmeto وقنوات الاتصال الرسمية هي عبارة عن تجميع للآراء والتحليلات الشخصية وغير ملزمة. لا تشكل أي توصية للشراء أو البيع أو الدخول أو الخروج من سوق الأوراق المالية وسوق العملات المشفرة. كما أن جميع الأخبار والتحليلات المدرجة في الموقع والقنوات هي مجرد معلومات منشورة من مصادر رسمية وغير رسمية محلية وأجنبية، ومن الواضح أن مستخدمي المحتوى المذكور مسؤولون عن متابعة وضمان أصالة ودقة المواد. لذلك، مع إخلاء المسؤولية، يُعلن أن المسؤولية عن أي اتخاذ قرار وإجراء وأي ربح وخسارة محتملة في سوق رأس المال وسوق العملات المشفرة تقع على عاتق المتداول.