
MELANIA
Official Melania Meme
| تریدر | نوع سیگنال | حد سود/ضرر | زمان انتشار | مشاهده پیام |
|---|---|---|---|---|
لم يتم العثور على نتائج. | ||||
مخطط سعر Official Melania Meme
سود ثلاثة أشهر :
سیگنالهای Official Melania Meme
مرشح
فرز الرسالة بناءً على
نوع التاجر
الإطار الزمني

behdark
MELANIA Analysis (8H)
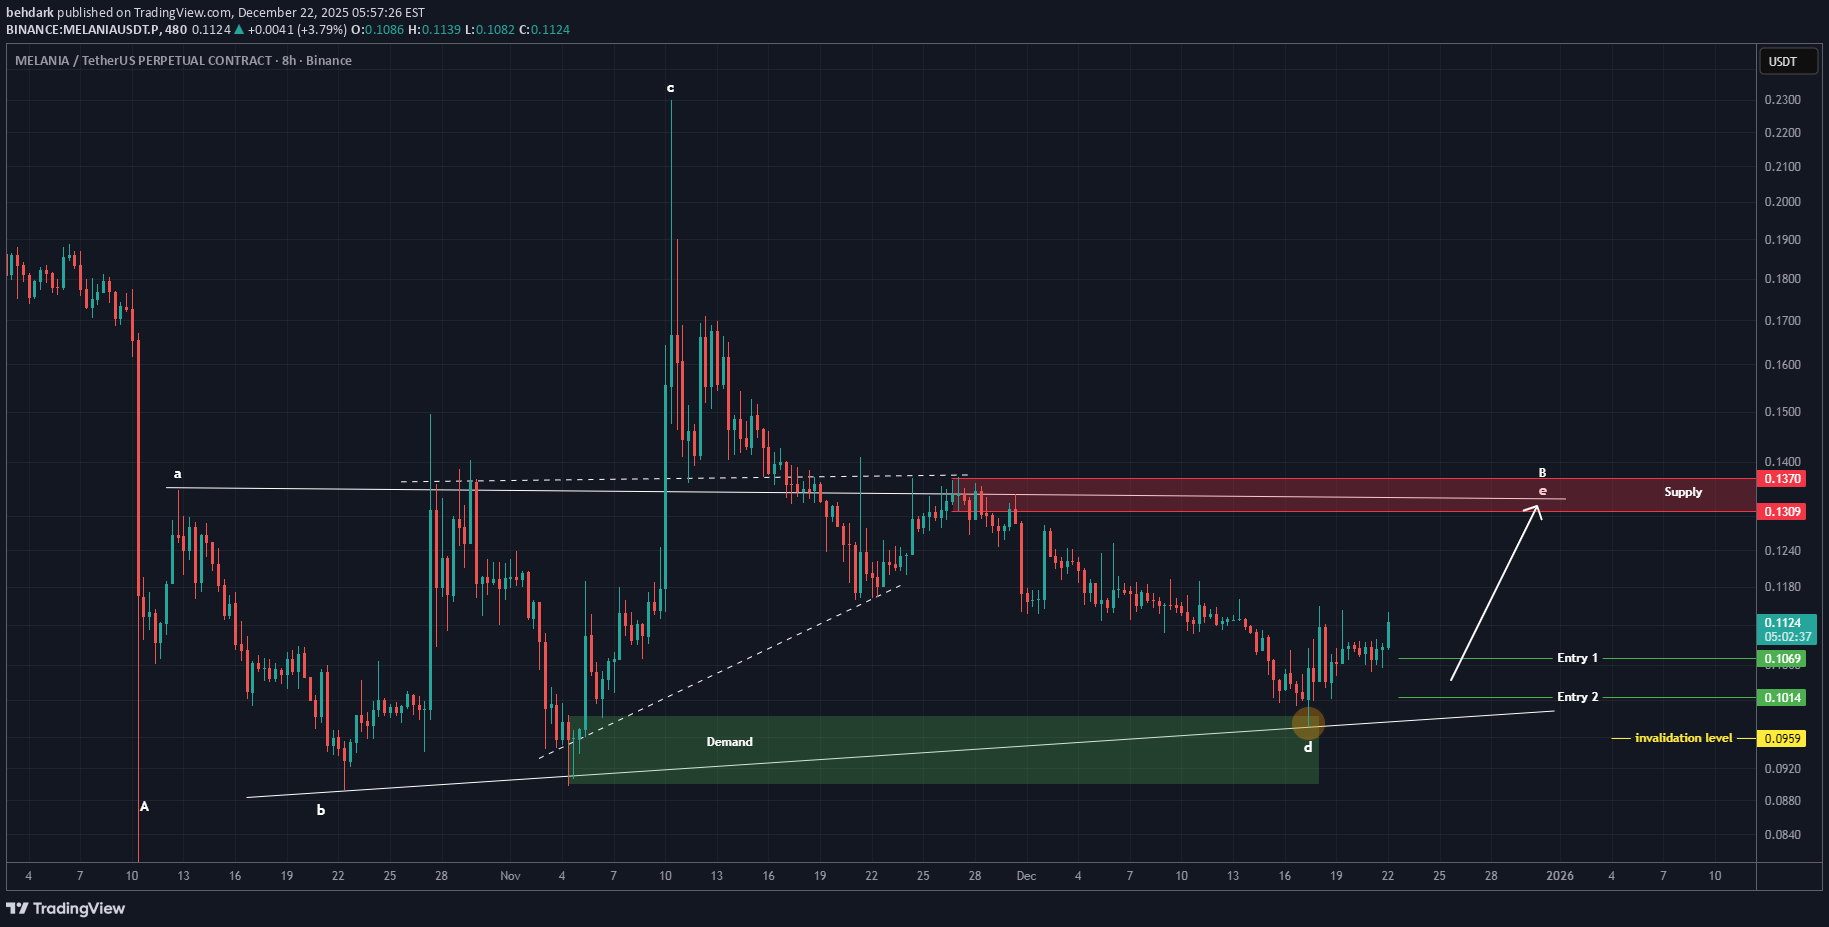
یبدو أن المثلث یتشکل، والموجة D لم تکتمل بعد. یمکن أن یشکل السعر اتجاهًا صعودیًا move للموجة E. لقد حددنا نقطتی دخول لهذه الموجة، والتی یجب إدخالها باستخدام DCA. یتم وضع علامة على الأهداف على الرسم البیانی. إغلاق شمعة الأربع ساعات تحت مستوى الإبطال سوف یبطل هذا التحلیل. بالنسبة لإدارة المخاطر، من فضلک لا تنسى وقف الخسارة وإدارة رأس المال عندما نصل إلى الهدف الأول، قم بتوفیر بعض الأرباح ثم قم بتغییر التوقف إلى الدخول التعلیق إذا کان لدیک أی أسئلة شکرا لک

asilturk
ملانیا (MELANIA): آیا این میم کوین پس از یک سال خواب، آماده انفجار است؟
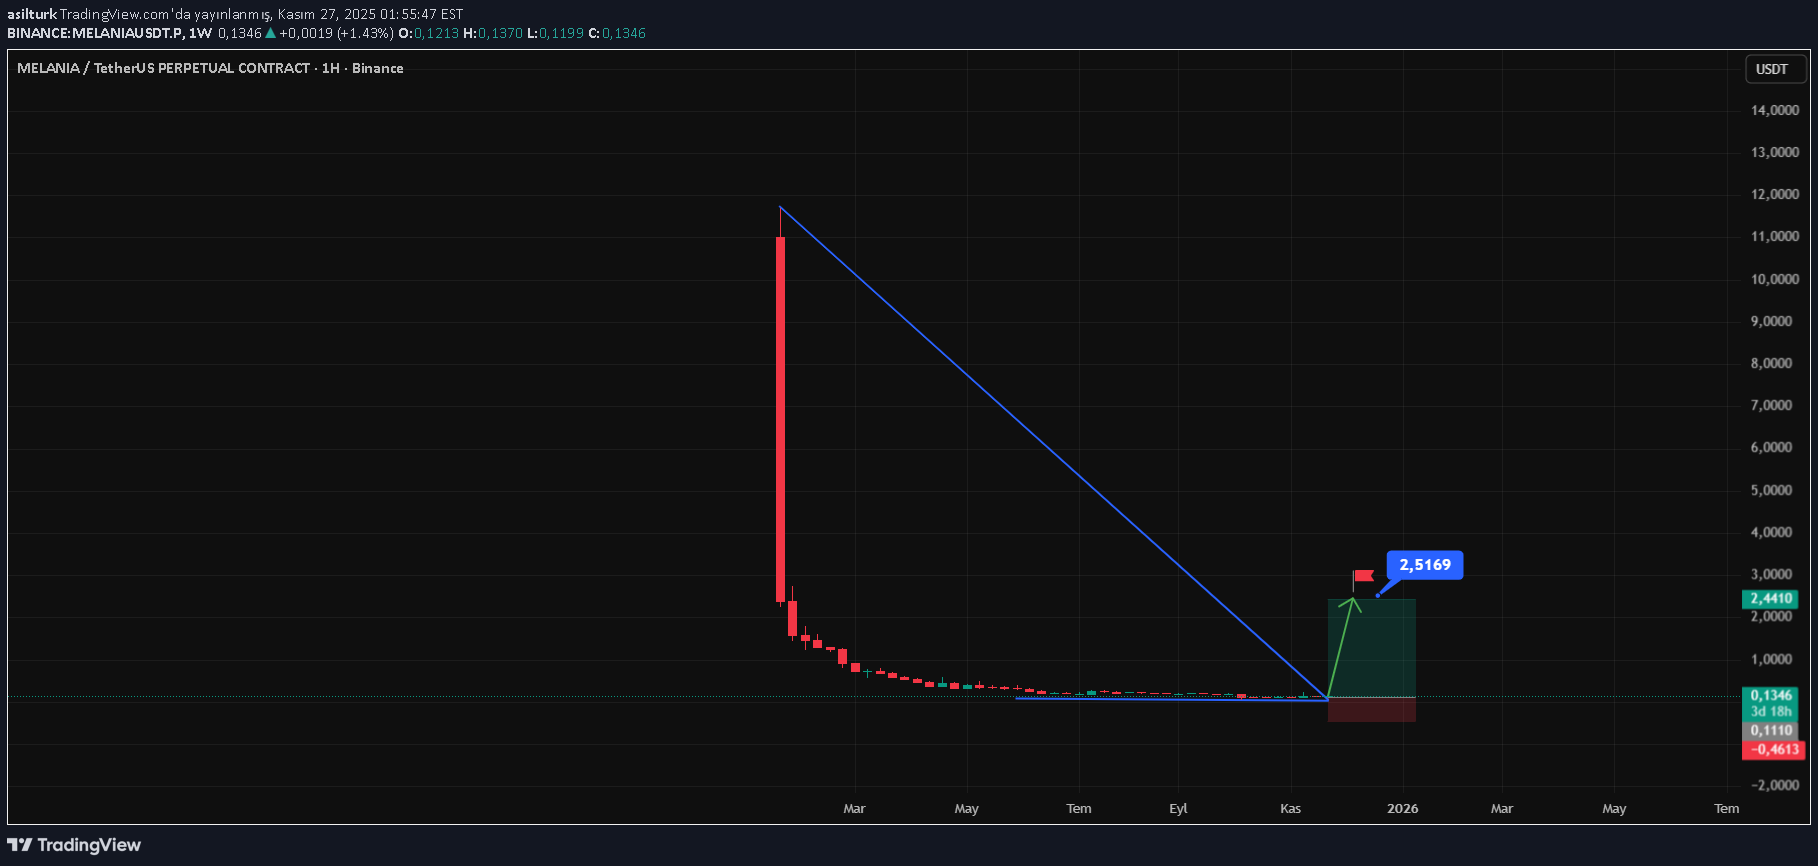
العملة المشفرة الأخرى التی سنضیفها إلى محفظتنا الیوم هی MELANIA بسعر 0.1350 سنتًا. القیمة السوقیة 135 ملیون دولار. التداول الفعلی هو 1 ملیار وحدة. وزن السیطرة على السوق هو 0.0041%. عندما نفحصها من الناحیة الفنیة، نرى أن العملة MELANIA المتداولة على شبکة SOL اختبرت النطاق السعری 11.69 دولارًا فی تاریخ العرض واستمرت فی الانخفاضات الحادة لمدة عام تقریبًا، متراجعة إلى أسعار 0.1360 سنت. نظرًا لأنها عملة Meme، فمن المؤکد أنه یمکن أن یکون هناک تحرکات حادة جدًا فی الأسعار صعودًا وهبوطًا. بعد کل شیء، من الضروری التذکیر بأنها عملة معدنیة meme. ومع ذلک، فقد تمکنا من ملاحظة تحرکات الأسعار التدریجیة والزیادات الحجمیة خلال الأسبوع الماضی. فی الأسبوع الماضی، الذی کان نائمًا لمدة عام، کان له نصیبه من الاتجاه الهبوطی العام، ولکن BTC أظهر مقاومة کبیرة فی أسعاره وتقلباته. السبب الرئیسی وراء مشارکة الرسم البیانی الأسبوعی هو أننی أعتقد أن أولئک الذین ینتظرون بتکلفة قدرها 11 دولارًا سیشهدون تصحیحات قاسیة فی الأیام القادمة لـ MELANIA، أولئک الذین یتحرکون فی نطاق السعر 0.1 سنت. ونتیجة لذلک، یمکننا القول أن المستثمرین على المدى المتوسط والطویل هم عند مستویات قابلة للاستثمار عند MELANIA، لکننی أوصی بشدة بإجراء عملیات شراء تدریجیة. أعتقد أنه سیکون من الصحیح الاستثمار بشکل تدریجی نظرًا لحرکاته الصعودیة والهبوطیة القویة جدًا.

Mihai_Iacob
چرا سرمایهگذاران کریپتو زود فراموش میکنند؟ شبیه به قماربازان کازینو!
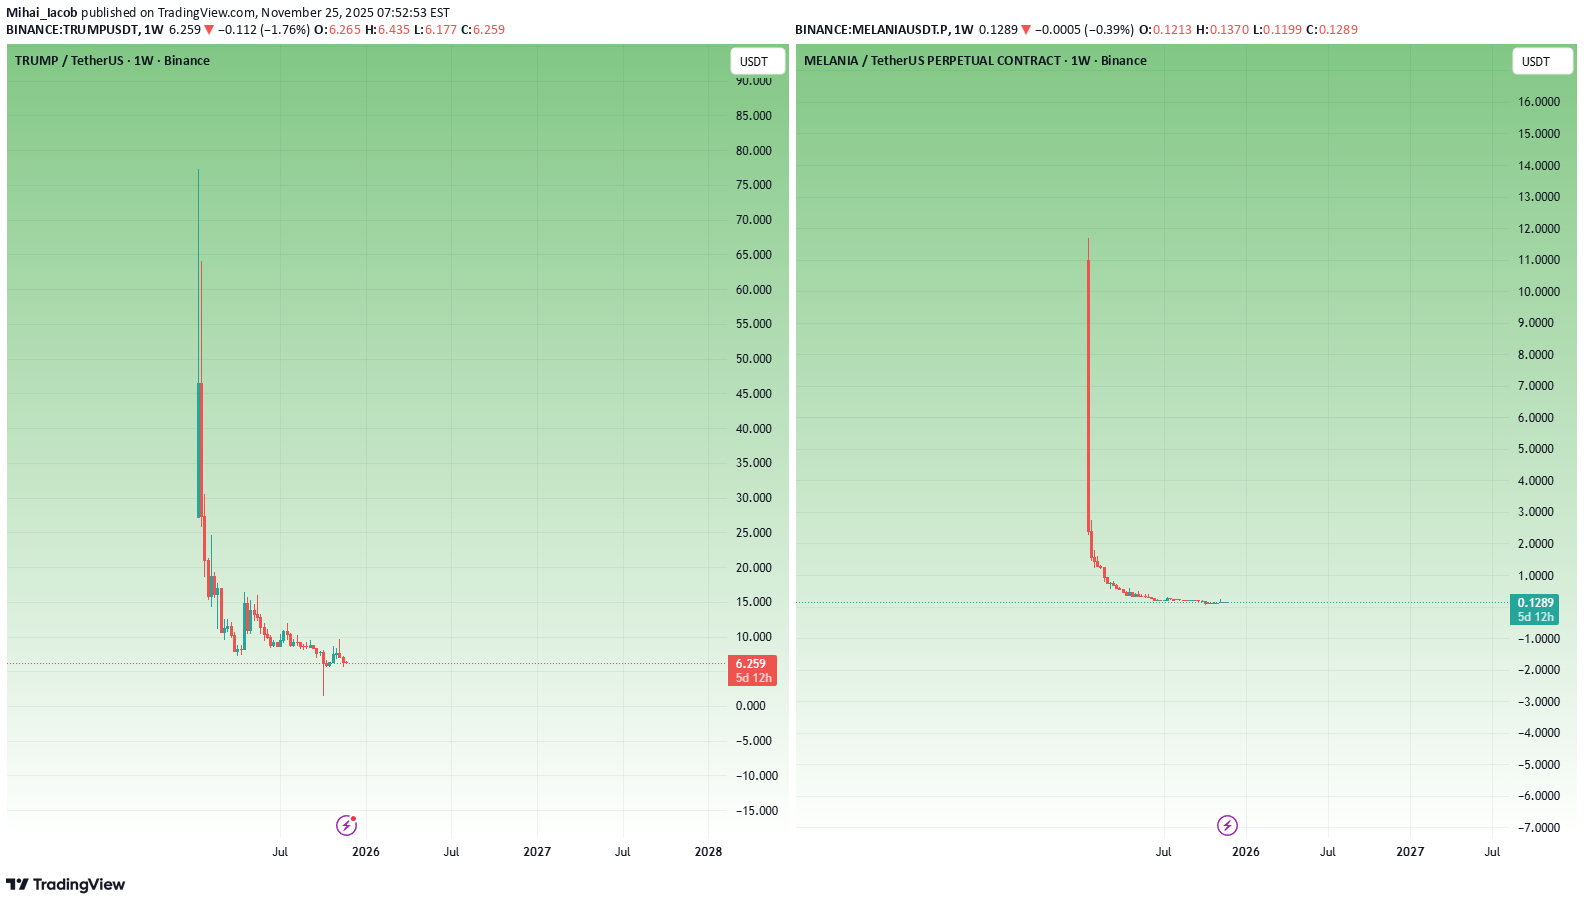
I’ve never been much of a gambler. I don’t chase roulette, I don’t play blackjack regularly, and casinos have never been my second home. But on the rare occasions when I did go—usually dragged by friends who actually like gambling—something strange happened to me. I ended up losing considerable amounts of money. - Not because I thought I’d win. - Not because I had a “system.” - Not because I felt lucky. It was the environment: - the lights - the noise - the adrenaline - the drinks - the atmosphere that hijacks logic And the next morning, the internal monologue was always the same: “See, idiot? Again you drank one too many and managed to lose a Hawaii vacation.” - The regret is real. - The pain is real. - The stupidity is, HOHO, WAY TOO REAL. But the disturbing part? Even though I don’t gamble… even though I don’t chase casinos… the environment alone was enough to override my reasoning. And if that can happen to someone who isn’t a gambler, imagine what happens to someone who willingly walks into a casino every day —because that’s exactly what crypto "investors" do. Crypto markets are casinos with better screens, countless memes, screaming influencers and worse odds. And "investors" forget far too quickly. Crypto "Investors" Forget Too Quickly — Just Like Casino Gamblers Who Keep Coming Back for More Crypto "investors" have one of the shortest memories in financial markets. - Not because they are stupid. - Not because they don’t care. - But because the entire crypto environment is engineered to erase pain and preserve hope — exactly like a casino. Put a gambler in a casino, and he forgets last night’s disaster the moment he sees the lights again. This comparison is not metaphorical. It is psychologically identical. Let’s break it down properly. 1. The Human Brain Is Not Built for Crypto — or Casinos Both environments share the same psychological architecture: - bright colors - fast feedback loops - uncertainty - intermittent rewards - emotional highs - catastrophic lows - near-wins that feel like wins - an illusion of control Neuroscience calls this: Intermittent Reinforcement The most addictive reward structure ever discovered. Slot machines are built on it. Most crypto charts mimic it. Volatility fuels it. When rewards arrive unpredictably: - dopamine spikes - memory of losses fades - the brain overvalues the next opportunity - the pain of the past gets overwritten - the hope of future reward dominates This is why gamblers return. And this is why crypto "investors" buy the same s..ts. 2. The Crypto Cycle Erases Memory by Design After every bull run for an obscure coin: - big money is made (by insiders) - screenshots are posted - what if you have bought with 100usd appear - influencers multiply - everyone becomes a “trading wizard” - Twitter becomes an ego playground - greed replaces rationality After every strong bear move: - portfolios crash 90-95% - people swear “never again” - Telegram groups die - influencers delete posts - conviction collapses - despair dominates But then… When a new "narrative" appears: - Everything resets. - Crypto "investors" forget instantly. No other financial market resets memory this fast. - In stocks, a crash leaves scars. - In forex, blown accounts create caution. - In real estate, downturns shape behavior for years. But in crypto? The new "narative"/ the new hyped coin erases the old one like chalk on a board. 3. The TrumpCoin & MelaniaCoin Episode (Just an Example): The Best Proof That Crypto Traders Forget Too Quickly TrumpCoin and MelaniaCoin didn’t have real value. They weren’t serious projects. They weren’t even clever memes. They were psychological traps built on celebrity gravity. People bought because: - the names were big - the media amplified the narrative - the symbolism felt powerful - the story was exciting And the wipeout was brutal. But the key point is: traders forgot instantly. Within weeks, they were already hunting for: - “the next TrumpCoin” - “the next politician meme” - “the next celebrity pump” - “the next token with a ‘name’ behind it” - "the next 100x" "the next, the next, the next" and is always the same - Not the next valuable project. - Not the next real innovation. - Not the next sustainable investment. No. The next symbol. This is not market behavior. This is casino relapse psychology. 4. These Coins Didn’t Fail Because They Were Memes —They Failed Because They Were Nothing TrumpCoin & MelaniaCoin ( Again, is just an example) pretended to matter because the names mattered. - Traders didn’t buy utility. - They bought a fantasy. The same way gamblers believe a “lucky table” changes their odds. In crypto, people believe: - the celebrity matters - the narrative matters - the hype matters Reality doesn’t. 5. Why Crypto "Investors" Don’t Learn: Because They Don’t Remember Crypto "investors" are not stupid. They are forgetful. They forget the months of pain and remember only the few happy moments. They forget: - drawdowns - stress - panic - illusions - scams - broken promises - influencers lies They remember: - one good run - one moonshot - one dream This is why most altcoins and memes thrive. Not because they deserve to. But because forgetting resets demand every time. 6. The Industry Is Designed to Exploit This Amnesia If traders remembered: - Luna - FTX - SafeMoon - ICO (2017) crashes - NFT (2021) collapses - Meme mania recently …the most of the altcoin sector would evaporate overnight. But "investors" forget —so altcoins with a "nice" story resurrect. Like slot machines resetting after every gambler walks away. 7. The Cure: You Don’t Need Better Tools — You Need a Better Memory The greatest edge in crypto is not fancy indicators, bots to be the first in, or whatever invention comes next. It’s remembering. Remember: - why you lost - how you lost - which narrative fooled you - how the market humiliated you - what the casino environment does to your brain - how celebrity tokens wiped people out Crypto trading requires memory, not optimism. Conclusion: Crypto "Investors" Forget Too Quickly —And That’s Why They Keep Losing Crypto "investors" don’t think like REAL investors. They think like gamblers: - emotional - hopeful - impulsive - forgetful convinced “this time will be different” The latest meme mania proved this perfectly. Crypto is not dangerous because it is volatile. Crypto is dangerous because it erases your memory. The "investor" who forgets loses. The "investor" who remembers wins. Because in crypto: The moment you stop forgetting is the moment you finally start winning. P.S. (A Necessary Clarification, Said Gently — and Honestly) Throughout this article I used the word “investors” in quotation marks — and it wasn’t an accident. Most of the people who call themselves investors in crypto are not actually investing. They are speculating, chasing, hoping, and gambling on meme coins and obscure altcoins purely because “they have 100x potential.” Let’s be honest: - buying a token named after a frog - or a coin launched yesterday by anonymous developers - or a “next big narrative” pump with zero product - or a celebrity meme coin - or something that exists only on Twitter…is not investing. It’s gambling dressed in nice vocabulary. And that’s okay — as long as you know what it is. Also, to be clear: When I critique “altcoins,” I am not talking about all of them. There are real infrastructure projects, real protocols, real technology, and real builders out there. But let’s not pretend: 90% of altcoins exist for hype, for extraction, for speculation, and for the dopamine of “maybe this one will moon.” I’m talking about those coins — the ones that behave like slot machines and survive only because traders forget too quickly. If this article made you uncomfortable, good. Sometimes the truth has to sting before it can help.

CryptoVhagar
آیا ریزش میلینا تمام شد؟ پیشبینی حرکت برگشتی و فرصتهای خرید!
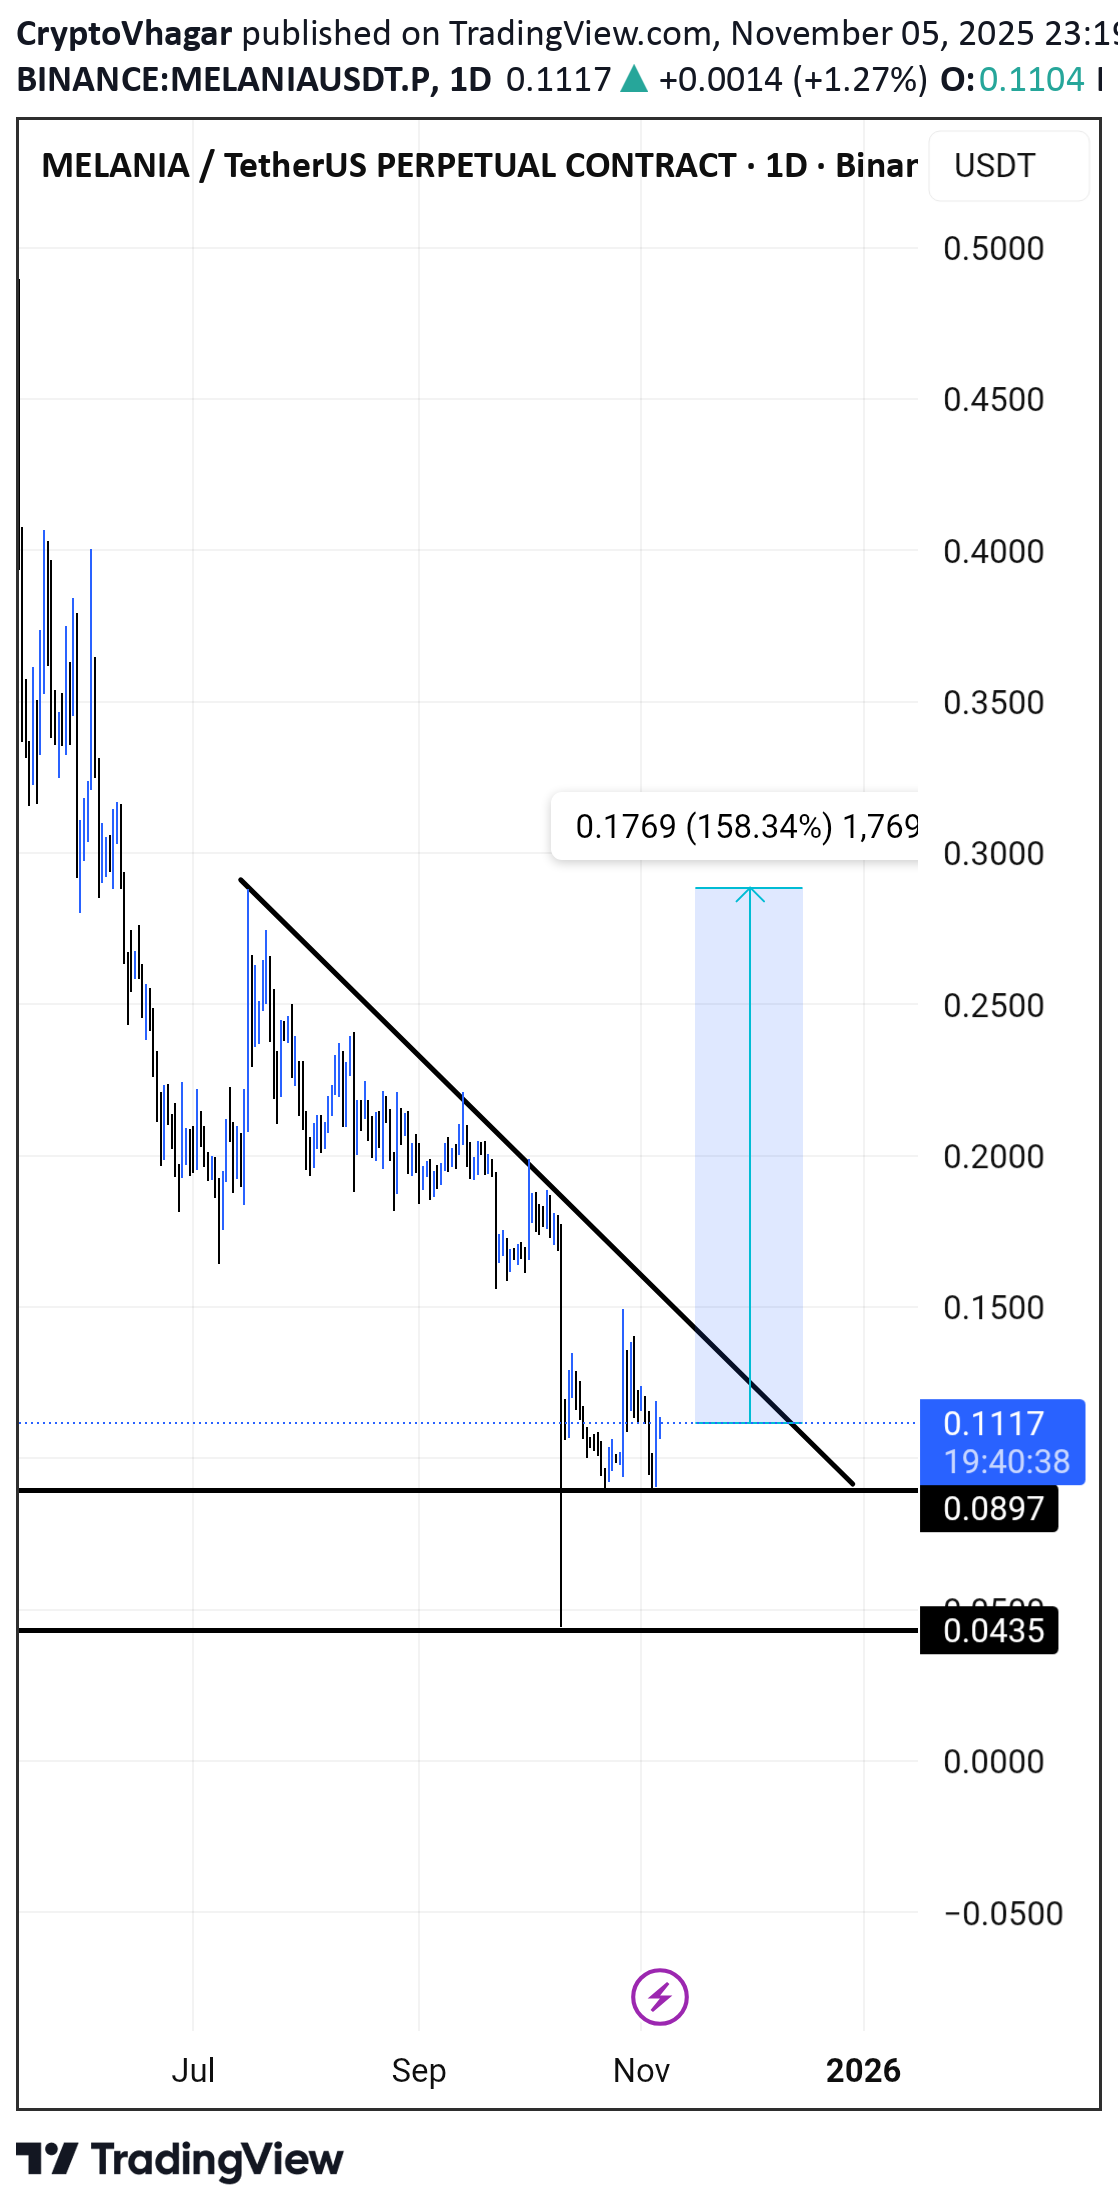
Melania انخفض کثیرًا. أعتقد أن القاع فی انعکاس سیحدث.

SevenStarBuySell
سیگنال فروش داغ در ملانیا: آیا وقت خروج است؟ (تحلیل با اندیکاتور 7 ستاره)
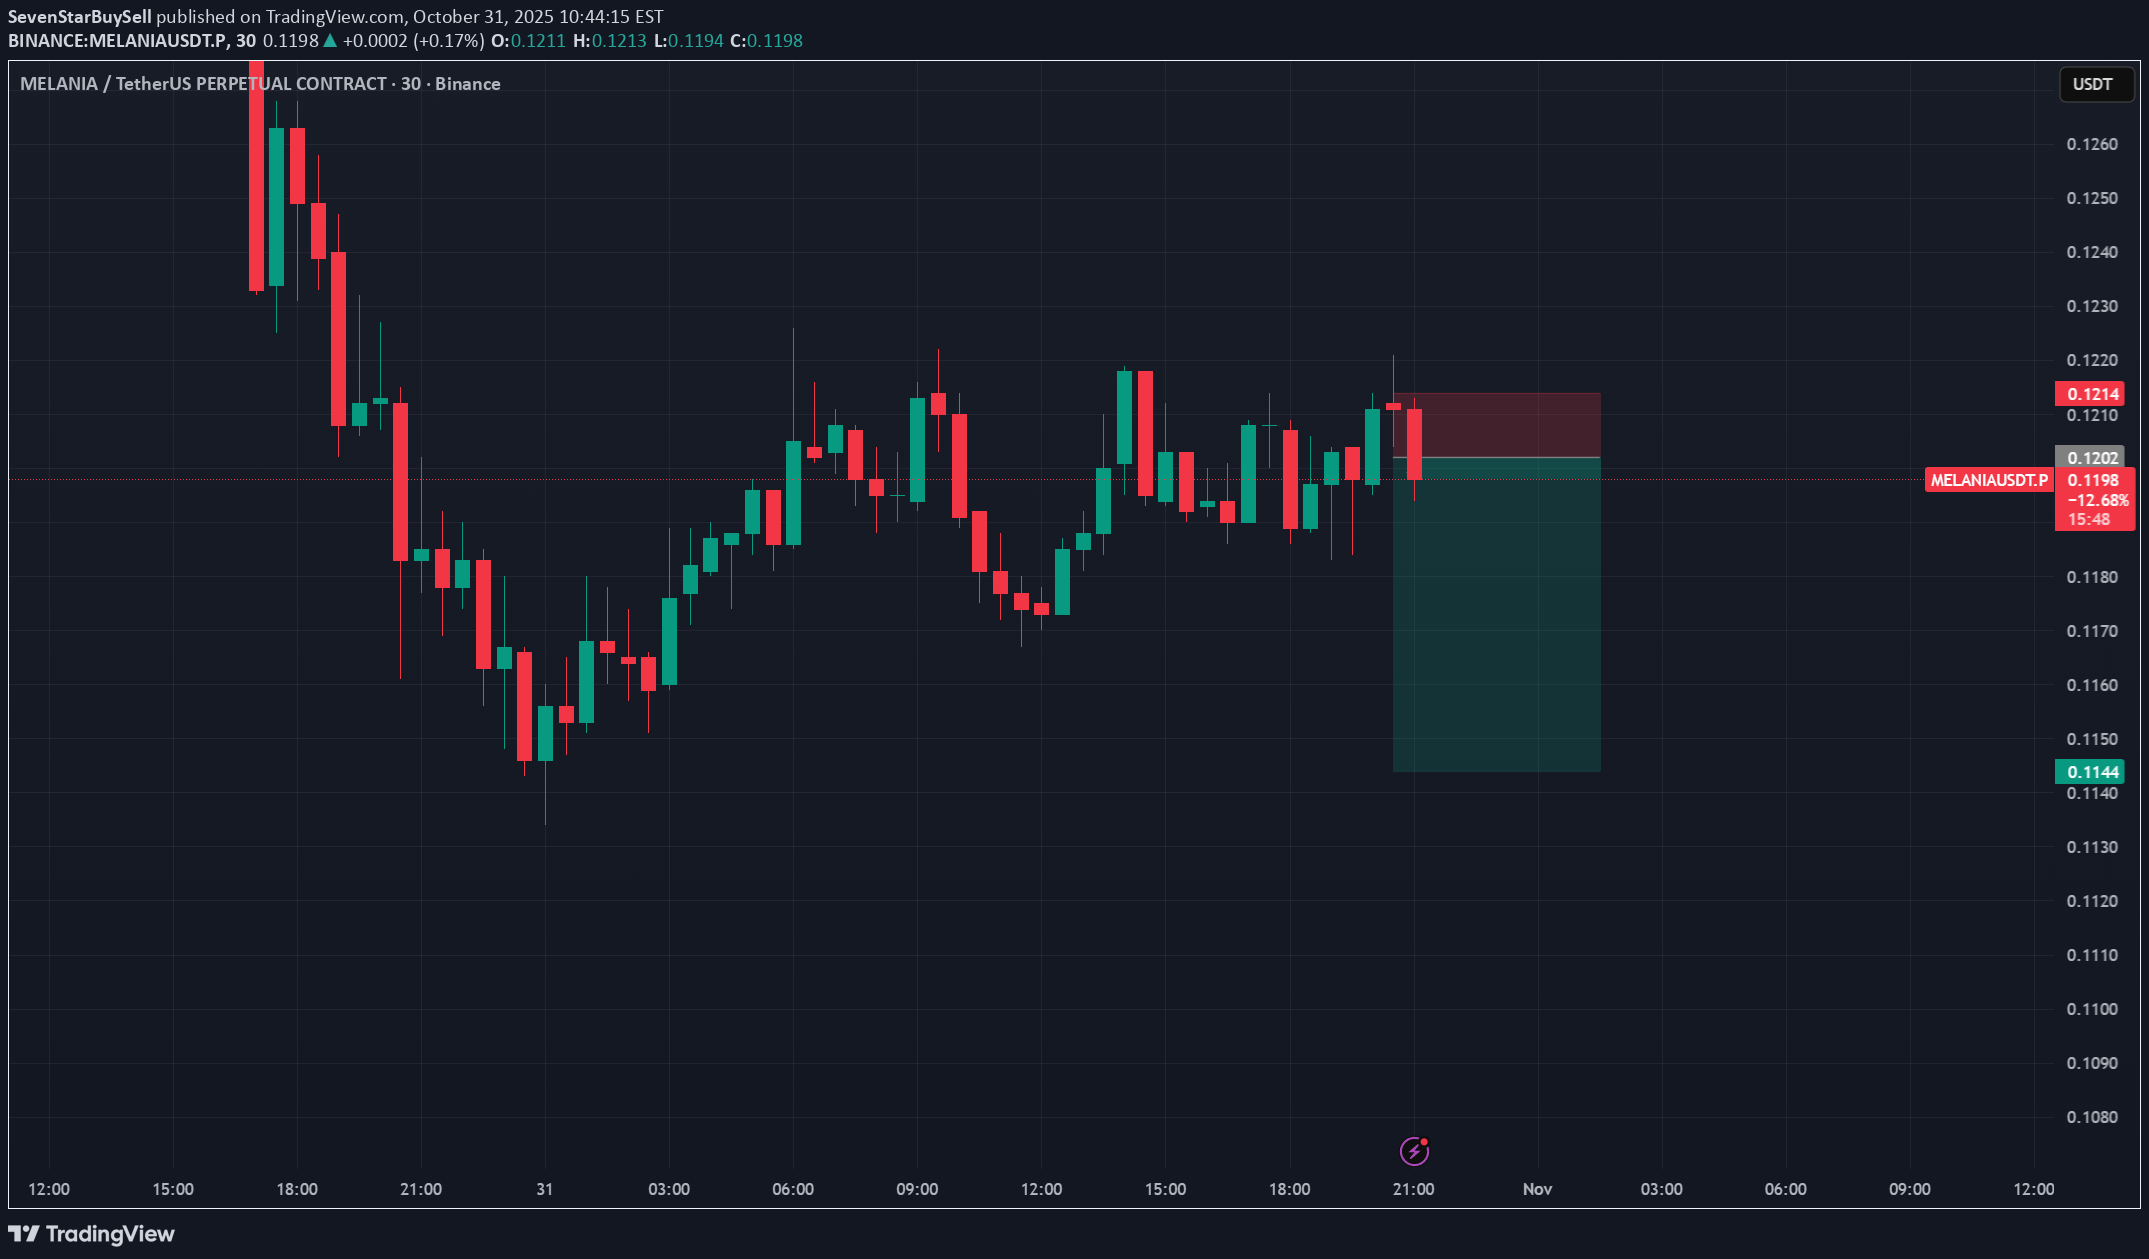
لدینا طباعة بیع فی Melania وفقًا لمؤشر البیع والشراء ذو الـ 7 نجوم. دعونا نرى کیف تلعب بها. الأهداف على الرسوم البیانیة. للوصول إلى المؤشر یمکنک الاتصال. أنا. دی وای أو آر
SevenStarBuySell
سیگنال شگفتانگیز در ملانیا: آیا ریزش قطعی است؟ (پیشبینی فوری)
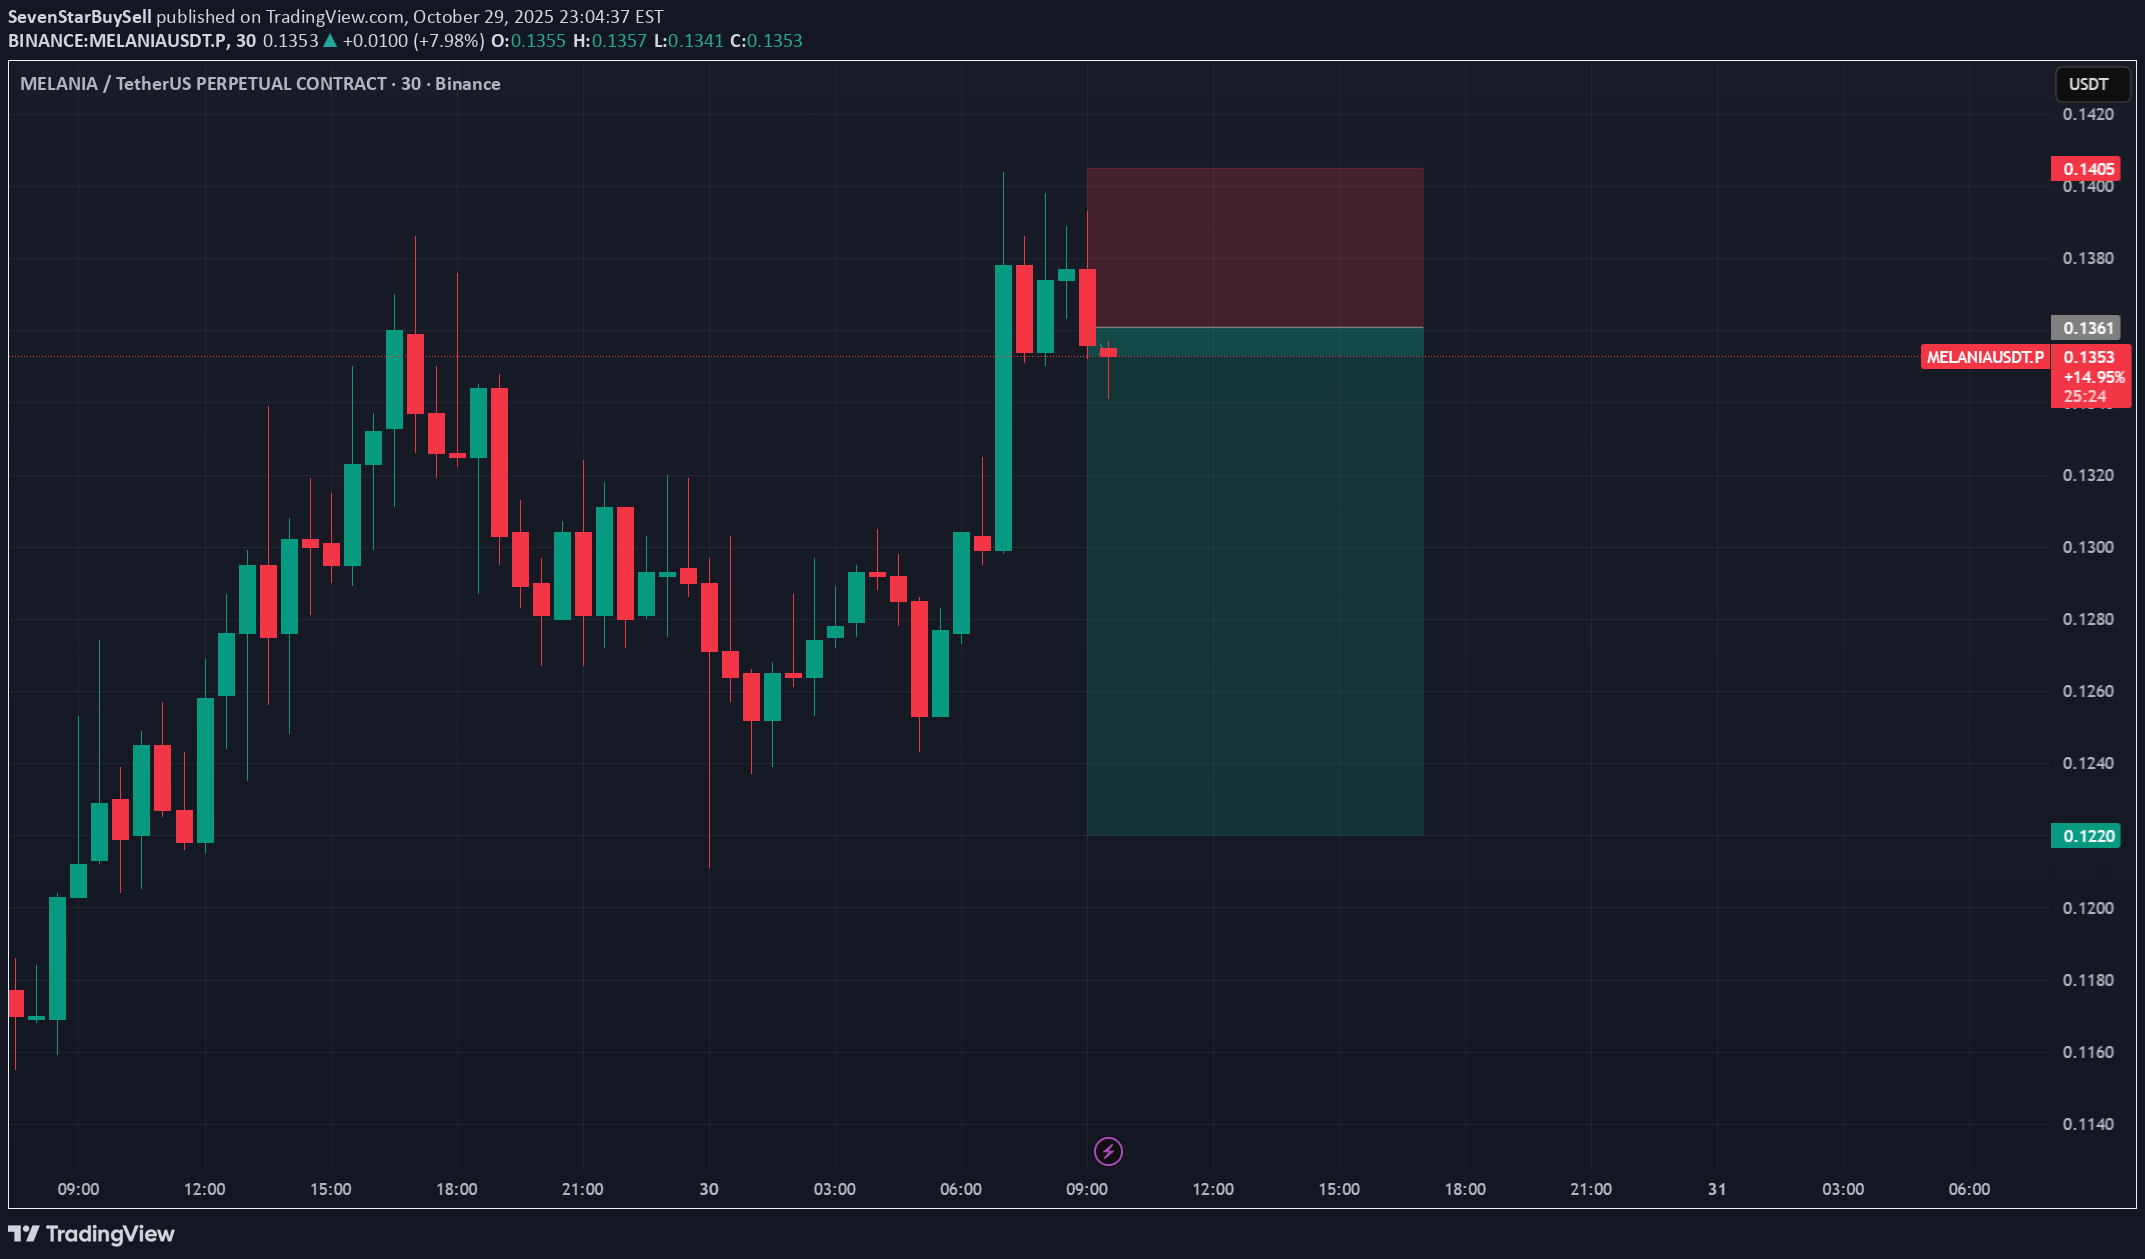
لدینا طباعة قصیرة فی Melania وفقًا لمؤشرنا ذو الـ 7 نجوم. دعونا نرى کیف تلعب بها. للوصول المبکر إلى إشاراتنا، یمکنک استخدام مؤشرنا. دیور

MasterAnanda
Melania Meme · 877% Profits Potential & Technical Analysis

بعد 22 أبریل ، یبدأ حجم التداول فی الارتفاع ، hard. Melaniausdt یبدأ النسب النهائی. 8 یولیو یصادف أسفل الاتجاه الهبوطی ومرة أخرى یرتفع حجم التداول ، hard. ترتفع عالیة حقًا ولکن لا یزال ، جانبیًا. لیس العمل الصعودی القوی للغایة ولکن على الأقل ذهب الاتجاه الهبوطی. أمس ، 25 أغسطس ؛ ینتج Melaniausdt أدنى مستوى أعلى مقارنةً بشهر یولیو ، ومرة أخرى یبدأ حجم تداول صدیقی العزیز والقارئ. حقا قوی. نحن مستعدون لموجة صاعدة جدیدة. یتحرک Melaniausdt فوق EMA8 و EMA34 الیوم على الإطار الزمنی الیومی. یمکن أن یؤدی إعداد المخطط هذا إلى بعض النتائج الجیدة. هذا هو بالضبط ما نحب أن نجده على الرسم البیانی. أول شیء هو أسعار منخفضة ، یحدث الإجراء بالقرب من الدعم. هذا إیجابی هنا ولدینا أدنى مستوى أعلى. لا نرید فقط أسعار منخفضة ولکننا نرید أن نرى إشارات الاسترداد وإشارات الانعکاس وإشارات التأکید. »إشارة الاسترداد هی أعلى منخفضة. إشارة الانعکاس هی move أعلى من المتوسطات المتحرکة وإشارة التأکید هی حجم الارتفاع. هذا مزیج قوی. یمکن أن تصل الموجة الصعودیة المتوسطة القوة إلى هدف 1.26 دولار لإمکانیة 487 ٪ من الأرباح. یمکن أن یرتفع Melaniausdt بسهولة. یمکنک أن تلاحظ على الرسم البیانی هدفًا عند 2.10 دولار مقابل 877 ٪. هناک مجال للمزید ، هذا فقط منتصف المدة. أنا أعرض فقط جزء من المخطط. ناماستی.

Crypto-by-PRIME
Melania / USDT : Buy every dip

لقد نجحت Melania/USDT بنجاح فوق خط الاتجاه التنازلی ، مما یؤکد الاختراق. یشیر هذا التحول إلى a التحرک الصعودی ، حیث یهدف السعر الآن إلى الهدف التالی عند 0.40 دولار. یشیر الاختراق إلى تغییر a فی معنویات السوق ، وإذا استمر السعر فی التمسک بهذا المستوى ، فقد نرى المزید من الأعلى movement. ضمان إدارة المخاطر المناسبة مع تطور الاتجاه.

SpartaBTC
MELANIA Main Trend. Memes with high hype and risk. July 17, 2025
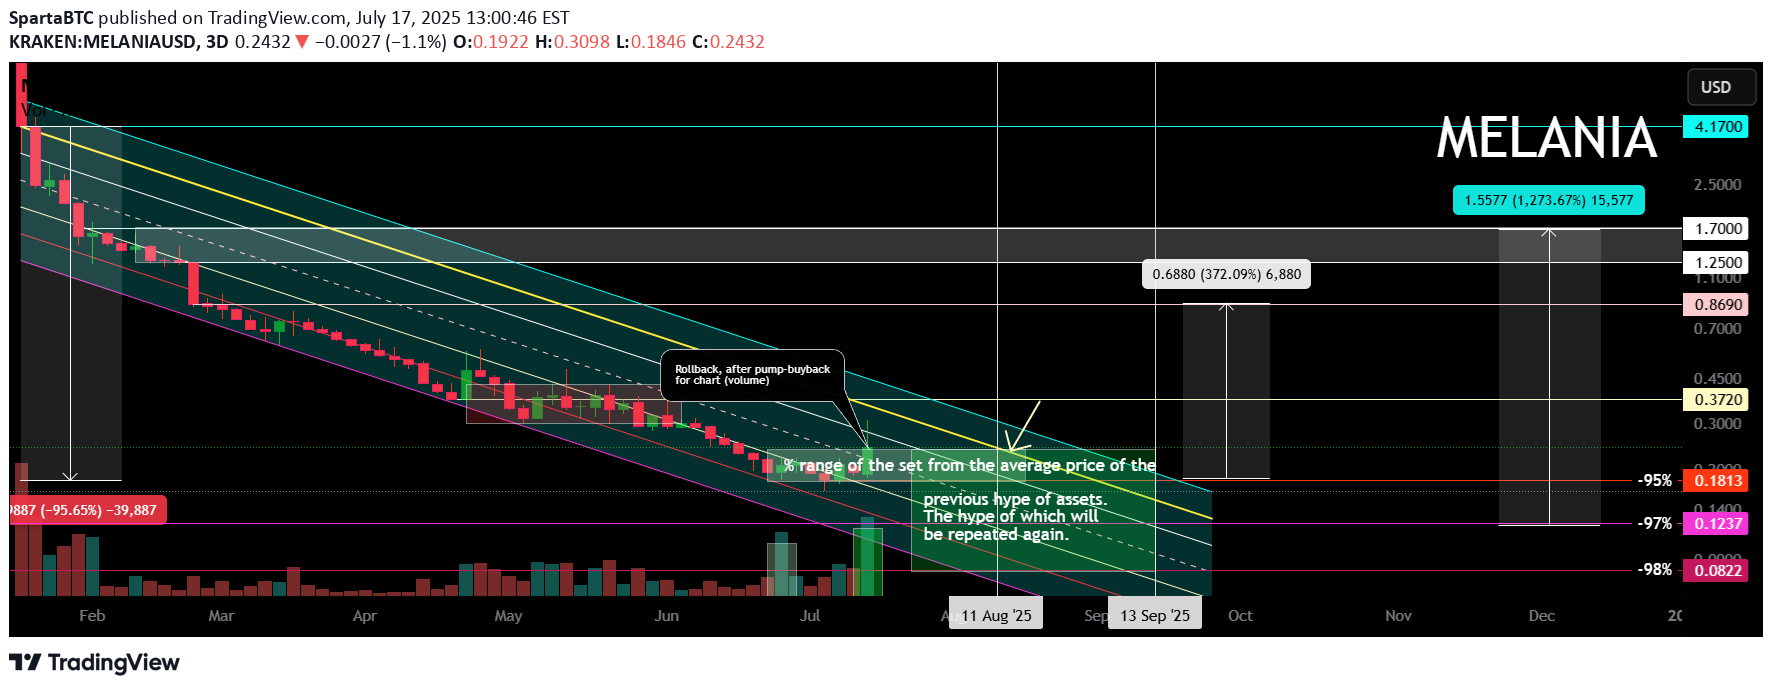
الاتجاه الرئیسی. الإطار الزمنی 3 أیام (أقل لیست ضروریة). أظهرت مستویات مشروطة (مناطق بالقرب منها) ، ونسب انخفاض من الحد الأقصى (ملاحظة ، لقد أظهرت من المنطقة حیث بدأت البیع بالتجزئة الرئیسیة لـ "المستثمرین المتأثرین" فی الاتصال ، أی أن الحد الأقصى أقل بکثیر من المخطط). لاحظ الآن أن الحجم الکبیر المشروط "یدخل" ، یتم عرضه على مخطط السعر (هذا مهم) ، بدأ الضغط الجانبی. الاندفاع المحلی والتراجع الآن فی الوقت الحالی. کما أظهرت ٪ کبیرة (عن قصد) للتوجه ، من الحد الأدنى إلى الحد الأقصى للمناطق. على أصول الضجیج هذه ، کقاعدة ، یظهر القاعدة متوسطة الأجل-على المدى الطویل (تم شراؤها فی المنطقة الیمنى) دخلًا کبیرًا. جمیع المناطق المستویة مشروطة ، بسبب السیولة ، ولکن على الأرجح "یلعب" السعر بعد انهیار الاتجاه الهبوطی فی هذا النطاق ، وموسم آخر alt (الذی لا یلاحظ الکثیرون بسبب الانهیار البطیء لآرائهم ، والأخبار القش ، والأهداف غیر الکافیة). بالنسبة لی ، أعلى من هذه ٪ الضخمة (منطقة المقاومة ، أو ما یصل إلى 0.869 ، حتى لا تضیع الوقت) ، یجب أن تتخلص من هذه المیم ، أو یجب أن تکون النسبة المئویة من الموقف السابق ضئیلًا بالفعل (5-10 ٪). هناک مناطق للضجیج ، وهناک مناطق ذات مکاسب محتملة (تتلاشى الضجیج ، والفائدة ، ونسبة کبیرة من الحد الأقصى). على هذه الأصول من "التداول الیدوی" ، حیث لا قیمة للعملة المشفرة ، فإنها تُباع دائمًا شیئًا فشیئًا (لا یفهم الکثیرون هذا) ، ولکن من أجل البیع ، تحتاج أحیانًا إلى تحقیق الاهتمام ، و "غرس الأمل" فی "المستثمرین المخدعاء سابقًا" الذین یرغبون فی الخروج على الأقل فی حیرة (من غیر المحتمل أن یحدث). فی الوقت المناسب ، یتم ضخ 1-2 تغریدات - بیانات من "القوى التی تکون" - بسبب انخفاض السیولة بنسبة مئویة کبیرة. على هذه العملات المشفرة ، لا تحتاج إلى تخمین "القاع" أو الحد الأقصى. یتشکل التسعیر بشکل مختلف هنا ، حیث لا یوجد عرض/طلب حقیقی ، فائدة ، ولکن فقط علم النفس و "ضرب الفوز بالجائزة الکبرى" من مدمنی المقامرة. کن أکثر ذکاء. تنویع هذه الأصول ، وتوزیع المخاطر مقدمًا. قم بإجراء عملیات الشراء/المبیعات وفقًا للخطة ، بدون عواطف. عندما یرتفع السعر ، تعتقد أنه سیکون أعلى بکثیر ، ولکن حتى لو کان الأمر کذلک ، یجب أن تبیع حجمًا معینًا فی بعض المناطق المخططة ، دون أی عواطف أو شعور بالربح المفقود. وبالمثل ، عندما ینخفض السعر ، یکون الناس مدفوعین بالخوف ویرفضون الشراء ، وربما کانت هذه الحد الأدنى للخوف. متوسط سعر المجموعة وإعادة التعیین مهم. لا توجد حاجة إلى الحد الأدنى والحد الأقصى. کن صبورًا ومتسقًا فی أفعالک وخططک.

TehLamboX
$MELANIA | Descending Channel Breakout Confirmed
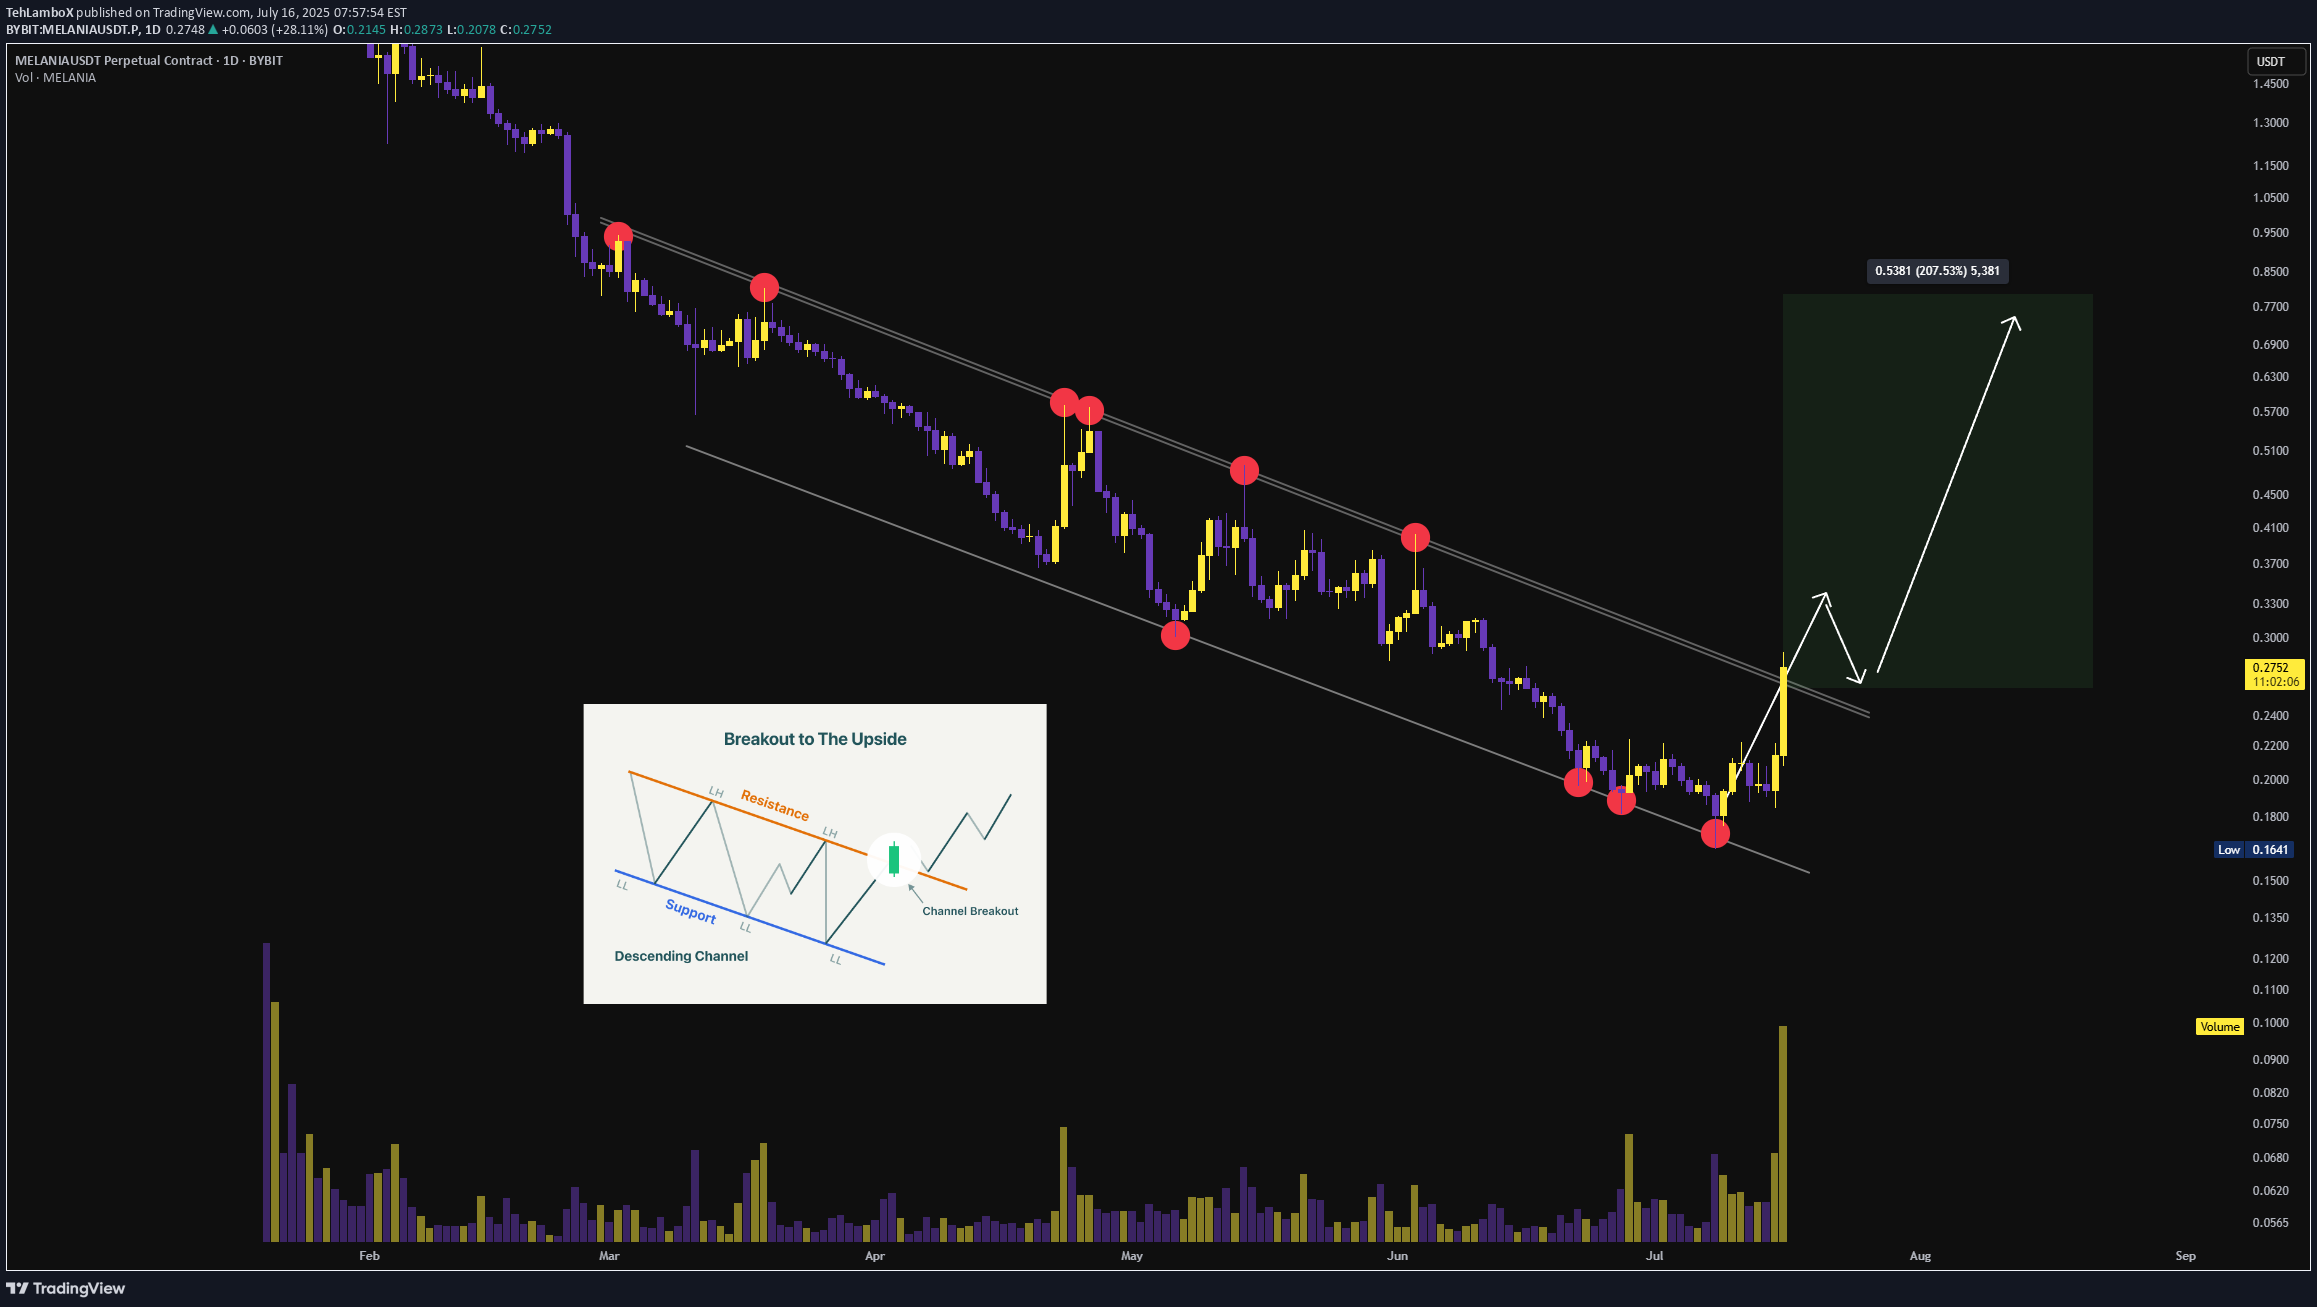
بعد شهور من الضغط داخل قناة متساقطة محترمة ، قام #MELANIA بطباعة استراحة عالیة الحجم فوق مقاومة القناة-مما یؤکد بنیة الانعکاس مع توسع زخم قوی. 🔍 التأکید الفنی: • اندلاع من مقاومة الاتجاه الهبوطی على المدى الطویل • لمسات نظیفة متعددة على حدود القناة (بنیة صالحة) • شمعة صعدیة مع تأکید حجمی • یشیر إجراء السعر إلى إعادة اختبار محتملة قبل الاستمرار 🎯 الأهداف الصعودیة بناءً على التحرک المقاس وتوقعات FIB: → 0.40 دولار (منطقة المحور الهیکلی) → 0.50 دولار (التقاء العرض) → 0.80 دولار (إسقاط ارتفاع القناة) راقب إعادة اختبار Breakout Zone لتأکید الاستمرار
إخلاء المسؤولية
أي محتوى ومواد مدرجة في موقع Sahmeto وقنوات الاتصال الرسمية هي عبارة عن تجميع للآراء والتحليلات الشخصية وغير ملزمة. لا تشكل أي توصية للشراء أو البيع أو الدخول أو الخروج من سوق الأوراق المالية وسوق العملات المشفرة. كما أن جميع الأخبار والتحليلات المدرجة في الموقع والقنوات هي مجرد معلومات منشورة من مصادر رسمية وغير رسمية محلية وأجنبية، ومن الواضح أن مستخدمي المحتوى المذكور مسؤولون عن متابعة وضمان أصالة ودقة المواد. لذلك، مع إخلاء المسؤولية، يُعلن أن المسؤولية عن أي اتخاذ قرار وإجراء وأي ربح وخسارة محتملة في سوق رأس المال وسوق العملات المشفرة تقع على عاتق المتداول.