
GOOGLX
GOOGLX Alphabet tokenized stock (xStock)
| تریدر | نوع سیگنال | حد سود/ضرر | زمان انتشار | مشاهده پیام |
|---|---|---|---|---|
 EPSMomentumالرتبة: 1071 | خرید | حد سود: تعیین نشده حد ضرر: تعیین نشده | 6/11/2025 | |
 TopgOptionsالرتبة: 191 | خرید | حد سود: تعیین نشده حد ضرر: تعیین نشده | 29/10/2025 |
مخطط سعر GOOGLX Alphabet tokenized stock (xStock)
سود ثلاثة أشهر :
سیگنالهای GOOGLX Alphabet tokenized stock (xStock)
مرشح
فرز الرسالة بناءً على
نوع التاجر
الإطار الزمني

تحلیل جامع: روندهای اصلی بیت کوین، اتریوم و استیبل کوینها در بازار کریپتو
1. Bitcoin Trends Bitcoin (BTC), the world’s first and most widely recognized cryptocurrency, remains the benchmark for the entire digital asset market. Several recent trends shape its behavior: A. Institutional Adoption Accelerates Institutional involvement has grown consistently, driven by exchange-traded products, corporate investments, and hedge funds using Bitcoin as an alternative asset. The approval of spot Bitcoin ETFs in major economies (primarily the US and a growing list of other countries) has created new channels of capital inflow. These funds have attracted billions of dollars in assets under management, making Bitcoin more accessible to traditional investors. B. Bitcoin as a Macro-Driven Asset Bitcoin is increasingly treated like a risk-on macro asset influenced by: Global interest rates Inflation expectations U.S. Federal Reserve monetary policy Liquidity cycles During periods of rate cuts or economic uncertainty, Bitcoin often attracts attention as “digital gold” or a hedge against currency debasement. Conversely, when rates rise and liquidity tightens, BTC experiences downward pressure. C. Halving Cycles and Supply Shock Bitcoin operates on a fixed supply of 21 million coins, with block rewards halving every four years. Each halving reduces the rate of new BTC entering the market. Historically, these events lead to: Reduced selling pressure from miners Increased scarcity-driven demand Potential long-term bullish cycles Even after each halving, the narrative of Bitcoin as a scarce, deflationary asset strengthens. D. Growing Role in Global Money Transfers Bitcoin usage in cross-border payments has surged due to: Lower transaction fees via the Lightning Network Faster settlement times Limited dependency on traditional banking systems This trend is especially prominent in countries facing currency crisis, inflation, or capital controls. E. Market Maturity and Reduced Volatility Compared to earlier years, Bitcoin’s volatility has begun to moderate as liquidity increases and institutional participation grows. This does not eliminate major price swings, but BTC is gradually moving toward being a more established asset class. 2. Ethereum Trends Ethereum (ETH) dominates the smart contract and decentralized application ecosystem. It serves as the backbone for decentralized finance (DeFi), NFTs, tokenization, and much more. Ethereum trends include: A. Transition to Proof of Stake (PoS) The successful transition from Proof of Work (PoW) to Proof of Stake (PoS)—known as the Merge—has permanently shifted Ethereum’s energy consumption and security model. The PoS upgrade has: Reduced energy usage by ~99% Made staking a core yield-generating activity Enhanced network security through validator decentralization ETH staking continues to grow, locking a significant portion of supply away from active circulation. B. Surge in Ethereum Layer-2 Ecosystems Ethereum’s scalability challenges led to the rise of Layer-2 chains like: Arbitrum Optimism Base zkSync StarkNet These chains: Reduce transaction fees Increase processing speed Expand Ethereum’s usability for retail users The long-term trend is toward Ethereum becoming the settlement layer while L2s handle high-volume activity. C. Tokenization of Real-World Assets (RWA) One of the fastest-growing sectors on Ethereum is asset tokenization. Institutions are issuing blockchain-based representations of: Government bonds Real estate Corporate debt Money-market funds Tokenized U.S. Treasury products on Ethereum have grown rapidly, showing real institutional use beyond speculation. D. Ethereum as the Base Layer for DeFi Even after market cycles and volatility, Ethereum remains the dominant chain for: Lending protocols (Aave, Compound) Decentralized exchanges (Uniswap, Curve) Price oracles (Chainlink) Yield staking Total Value Locked (TVL) tends to rise and fall with overall market sentiment, but Ethereum consistently holds the largest share. E. Shift Toward Deflationary Supply After EIP-1559 introduced base fee burning, Ethereum sometimes becomes deflationary, meaning more ETH is burned than issued—especially during periods of high network activity. This creates a long-term bullish supply dynamic similar to Bitcoin’s scarcity. 3. Stablecoin Trends Stablecoins are the foundation of global crypto liquidity. They provide stability, enable global transactions, and serve as a bridge between traditional finance (TradFi) and decentralised finance (DeFi). A. Rapid Growth in Market Capitalization Stablecoins like USDT, USDC, and emerging decentralized alternatives have seen strong growth. They are increasingly used for: Trading pairs on crypto exchanges Remittances Yield generation On-chain settlement DeFi collateral USDT continues to dominate due to its wide availability and high adoption in cross-border markets. B. Regulatory Tightening and Transparency Governments worldwide are enforcing stricter oversight of stablecoins. The aim is to ensure: 1:1 reserve backing Independent audits Stronger disclosure requirements These regulations help institutional adoption and reduce risks associated with opaque issuers. C. Rise of On-chain Payments Stablecoins are rapidly emerging as a global payments infrastructure. Businesses and fintech companies increasingly use stablecoins for: Payroll B2B transfers E-commerce Cross-border settlements Their speed, low cost, and 24/7 availability make them an attractive alternative to SWIFT. D. Competition from CBDCs Central banks globally are experimenting with Central Bank Digital Currencies (CBDCs). Although CBDCs will coexist with stablecoins, they may compete in retail and wholesale payments. Stablecoins, however, retain the advantage of flexibility, programmability, and cross-chain mobility. E. Decentralized Stablecoins Return Decentralized options like DAI and FRAX are evolving to become more resilient. The trend is toward: Overcollateralized models Multi-asset backing Algorithmic governance with strong safety features This helps reduce dependence on centralized issuers. 4. Combined Crypto Market Themes A. Institutionalization of Crypto Bitcoin, Ethereum, and stablecoins together form the backbone for large institutions entering the market. Their maturity and regulatory clarity provide confidence for long-term investment. B. Integration with Traditional Finance Crypto is increasingly merging with traditional financial rails: Tokenized stocks Tokenized treasury bonds Crypto payment cards Stablecoin-powered banking services C. Market Cycles Driven by Liquidity Crypto markets remain heavily influenced by global liquidity. When monetary conditions ease, capital flows into BTC and ETH first, then spreads to altcoins. D. On-Chain User Growth Wallet creation, transaction counts, staking participation, and L2 adoption are rising steadily. Crypto is shifting from speculation to real-world usage. Conclusion Bitcoin, Ethereum, and stablecoins represent the three fundamental pillars of the modern cryptocurrency ecosystem. Bitcoin leads as a global digital store of value, Ethereum powers decentralized applications and financial innovation, while stablecoins act as the liquidity engine for global on-chain activity. Together, these sectors continue to grow due to institutional adoption, technological advancements, and increased global demand for decentralized alternatives to traditional financial systems. As regulatory clarity emerges and more real-world uses develop, these assets are positioned to drive the next phase of crypto market expansion.

quantsignals
پیشبینی صعودی گوگل (GOOGL): سطوح ورود کلیدی برای تریدهای کوتاهمدت
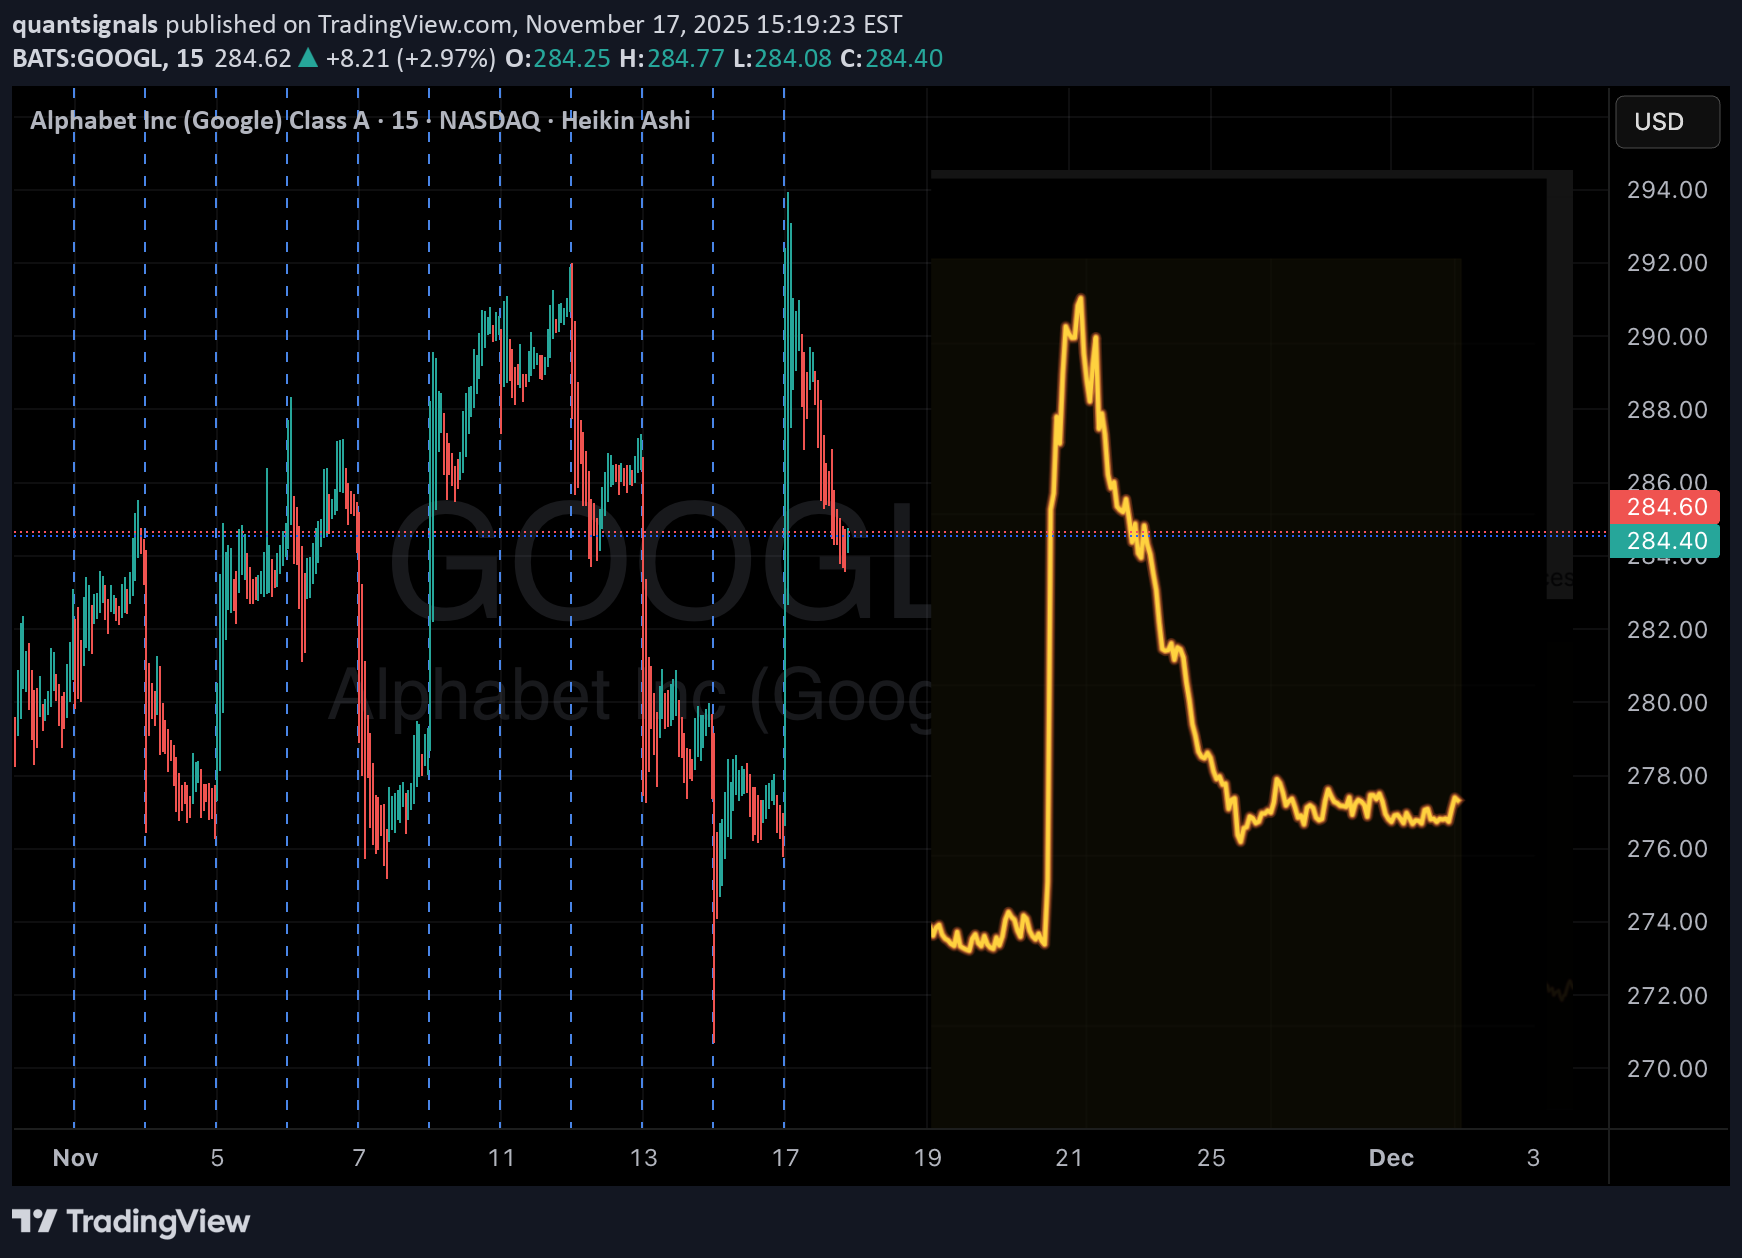
المؤشر: جوجل التاریخ: 2025-11-17 الاتجاه: صاعد الثقة: 64.5% – 69.8% التقلب: 14.4% – 38.3% إشارة التجارة رقم 1 الاتجاه: طویل الدخول: 286.07 دولارًا الهدف: 287.63 دولارًا وقف الخسارة: 281.78 دولارًا المتوقع Move: +0.68% إشارة التجارة رقم 2 الاتجاه: طویل الدخول: 284.14 دولارًا الهدف: 287.47 دولارًا وقف الخسارة: 279.88 دولارًا المتوقع Move: +1.47% ملخص التحلیل: تظهر کاتی AI اتجاهًا صعودیًا على کلا الإشارتین بثقة معتدلة. تُظهر الأهداف قصیرة المدى لمدة 30 دقیقة تراجعات طفیفة خلال الیوم (285.71 دولارًا / 286.90 دولارًا) قبل الاستمرار. تتراوح التقلبات بین 14.4% – 38.3%، مما یشیر إلى احتمال حدوث تقلبات خلال الیوم. إدارة المخاطر المقترحة: الحفاظ على حجم مرکز صغیر، ومراقبة وقف الخسارة عن کثب. الملاحظات الرئیسیة: تشیر کلتا الإشارتین إلى زخم صعودی تدریجی مع اتجاه صعودی متواضع. مثالی للمتداولین الذین یبحثون عن التعرض الطویل الأجل قصیر المدى بما یتماشى مع الاتجاه AI. راقب الانعکاسات خلال الیوم؛ توفر مستویات وقف الخسارة نقاط خروج رئیسیة.

ContraryTrader
تحلیل تکنیکال گوگل: هشدار فروش! سقوط سنگین در راه است؟
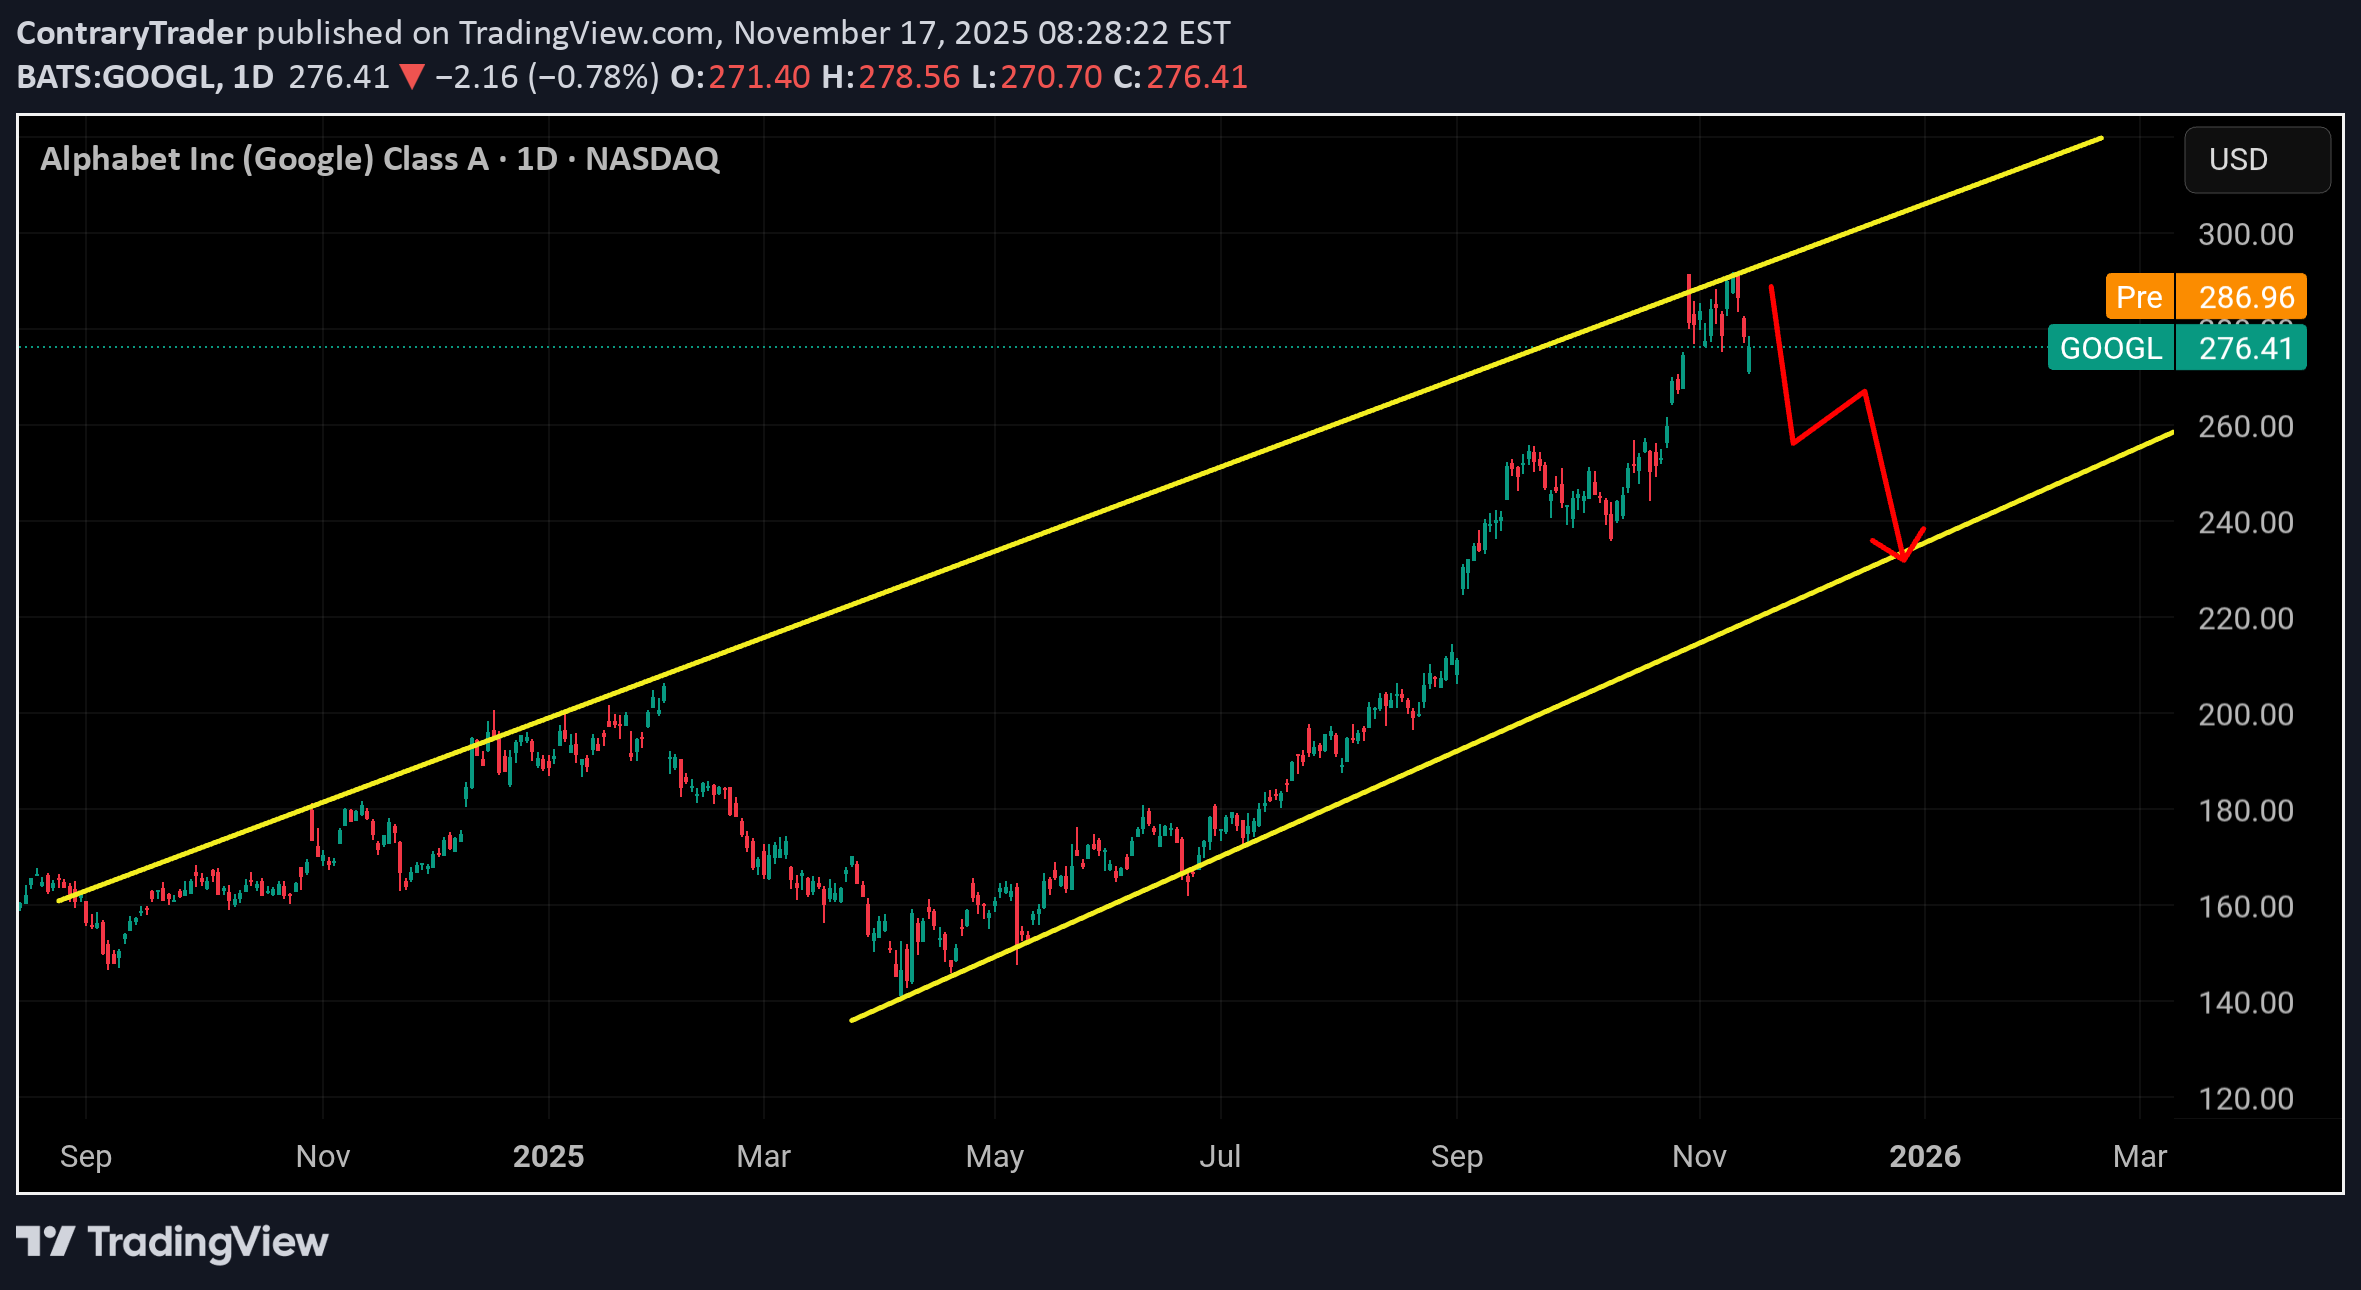
أنهى Googl اجتیاحًا هبوطیًا أسبوعیًا إنها الأولى منذ مارس 2025 یمتد حالیا 25٪ من 20sma الأسبوعی .. آخر 3 مرات امتدت googl بعد 20sma أکثر من 16٪ یحدث السحب منفصل تمامًا عن Bollingerband الشهری؛ هذا علم red ضخم! أنت لا تطارد طویلاً هنا ولکن تذکر أنه یتعین علیک التداول فی الإطار الزمنی الذی تقوم بتحلیله. نظرًا لأن هذا قد تم شراؤه شهریًا ولا أعتقد أن هذا سیستمر حتى دیسمبر، یجب أن یکون لشورتک ما بین 45 إلى 60 یومًا کحد أدنى عند انتهاء الصلاحیة. أتوقع تراجعًا إلى 240-255 خلال 30-45 یومًا القادمة لأغراض الدخول، سوف تبحث عن دخول بالقرب من 290.. وتکون على استعداد لإضافة صفقات بیع تصل إلى 300 مع وقف الخسارة فوق 300. الهدف الأول سیکون 270 ثم 250 تحته

DEXWireNews
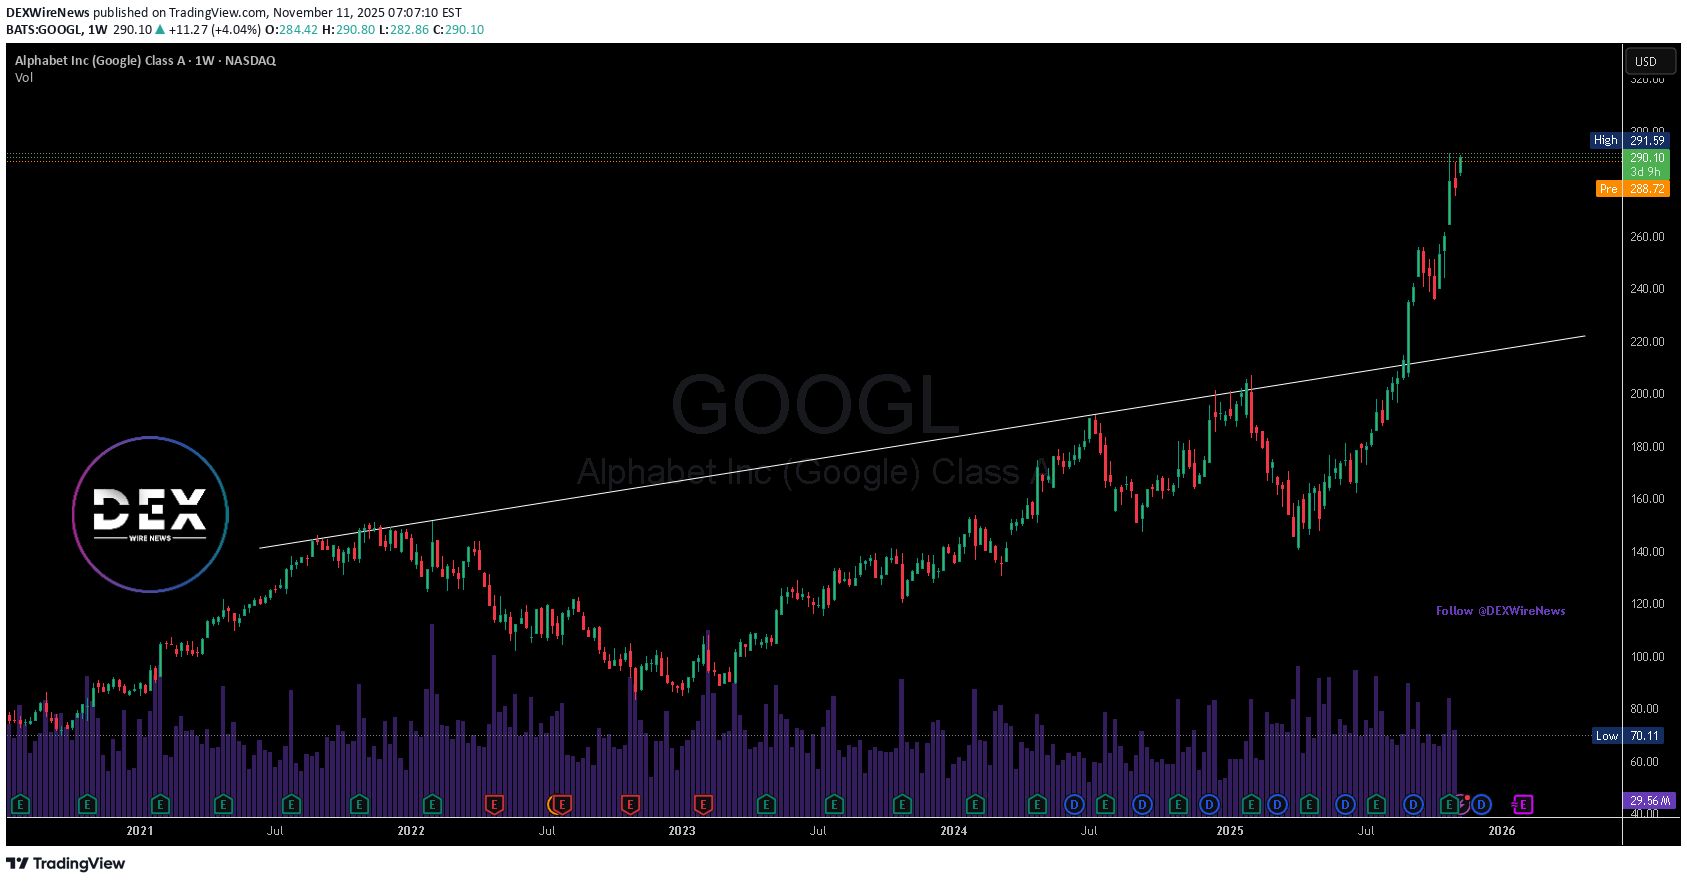
جریمه سنگین گوگل: دادگاه آلمان غول جستجو را مجازات کرد، اما آینده سهام GOOG همچنان صعودی است!
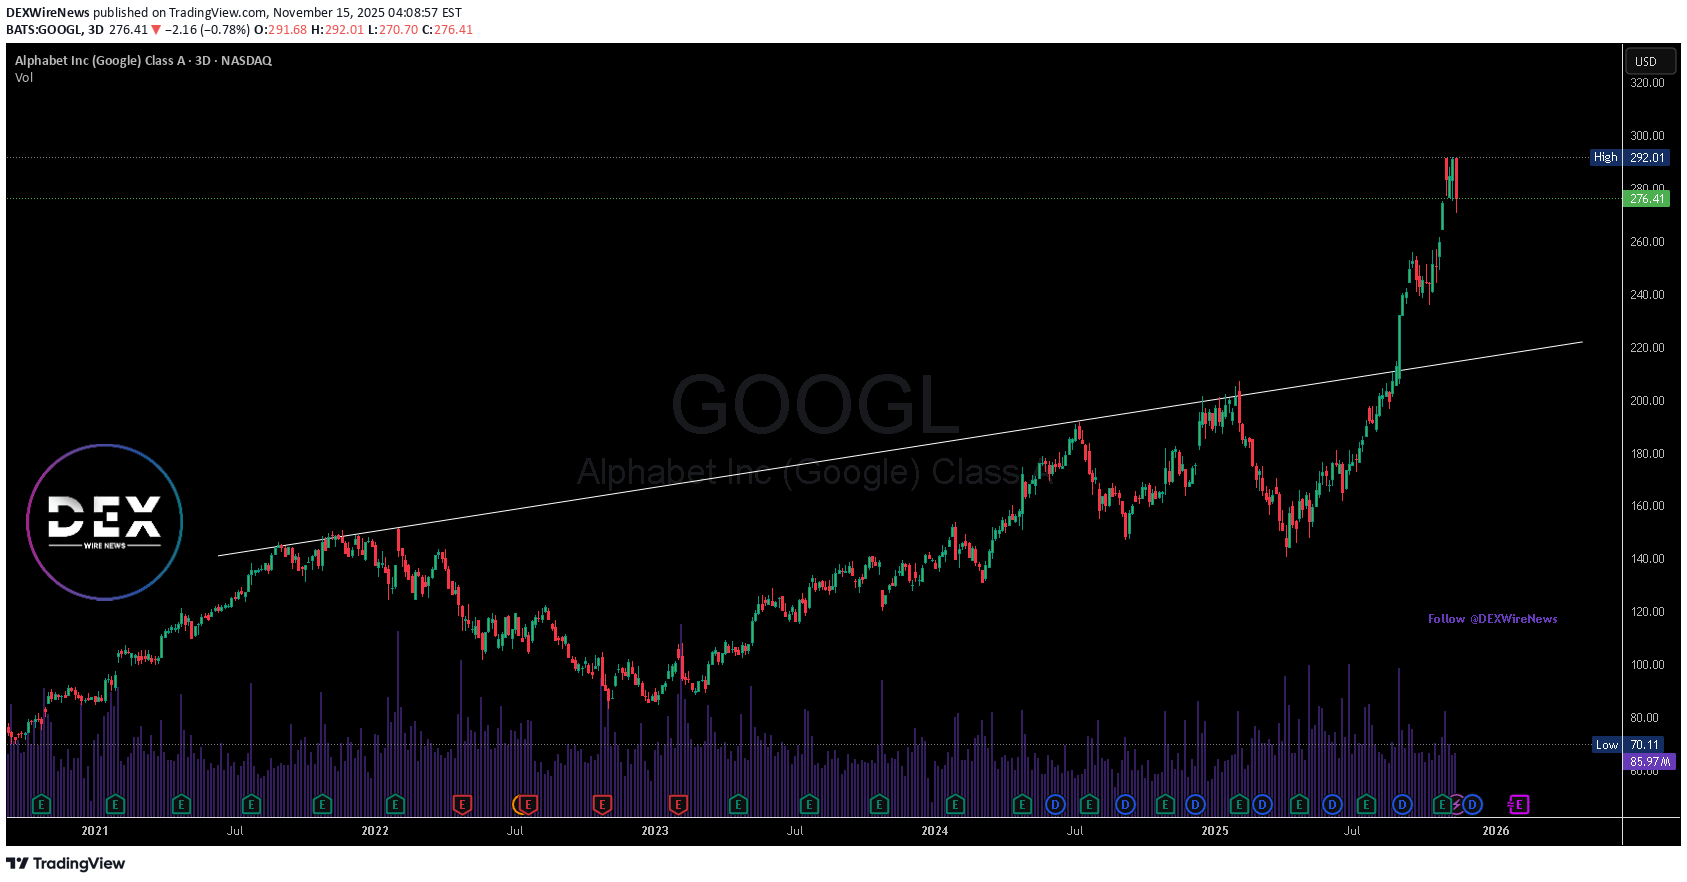
تعرضت شرکة Google (GOOG) لانتکاسة قانونیة بعد أن أمرت محکمة فی برلین الشرکة بدفع 573 ملیون یورو (666 ملیون دولار) کتعویضات لمنصتین ألمانیتین لمقارنة الأسعار. تنبع القضیة من نزاعات طویلة الأمد لمکافحة الاحتکار مرتبطة بممارسة جوجل المزعومة لتفضیل خدمة التسوق الخاصة بها على المنافسین - وهی قضیة عاقبتها المفوضیة الأوروبیة فی البدایة فی عام 2017 بغرامة قدرها 2.4 ملیار یورو. منحت المحکمة شرکة Idealo بمبلغ 374 ملیون یورو بالإضافة إلى 91 ملیون یورو کفوائد، بینما ستحصل شرکة Producto GmbH على 89.7 ملیون یورو بالإضافة إلى 17.7 ملیون یورو کفوائد. وقالت الشرکتان إن هیمنة جوجل على البحث حدت من ظهورهما، مما کلفهما سنوات من فقدان الإیرادات. وعلى الرغم من سرورها برفض جزء کبیر من مبلغ 3.3 ملیار یورو الذی طلبته شرکة إیدیالو فی الأصل، إلا أن جوجل تؤکد أنها لا توافق على الحکم وسوف تستأنف. وتصر الشرکة على أن علاج عام 2017 قد عالج المخاوف وأن مراقبة الاتحاد الأوروبی تدعم هذا الرأی. ومع ذلک، خلص قضاة برلین إلى أن التغییرات التی أجرتها جوجل لم تکن کافیة للقضاء على الضرر التنافسی ــ حتى بعد عام 2017. وهذه هی المرة الأولى التی تعلن فیها محکمة أوروبیة وطنیة صراحة أن العلاج الذی قدمته جوجل فشل فی إنهاء إساءة الاستخدام، مما قد یفتح الباب لملیارات أخرى فی دعاوى لاحقة فی جمیع أنحاء أوروبا. قد یدفع المدعون من أجل تسویات أکبر، مما یجعل هذا بمثابة ریاح قانونیة معاکسة لشرکة Alphabet. التوقعات الفنیة على الرغم من الأخبار القانونیة، لا یزال مخطط GOOG صعودیًا من الناحیة الهیکلیة. کان السهم فی اتجاه صعودی ثابت، مدعومًا بمستویات منخفضة مرتفعة ثابتة وطلب قوی عبر التکنولوجیا. فی الآونة الأخیرة، اخترق السعر خط الاتجاه الرئیسی، مما یشیر إلى تجدد الزخم الصعودی. شهدت GOOG تراجعًا یوم الجمعة مع ظهور العناوین الرئیسیة، لکن الاتجاه الأوسع لا یزال سلیمًا. وطالما ظل السهم فوق منطقة الاختراق وخط الاتجاه، یظل الاستمرار الصعودی هو التحیز السائد مع دخول المشترین عند الانخفاضات.

largepetrol
گوگل با شاخص TrenVantage LITE: صعود ادامهدار یا سقوط قریبالوقوع؟
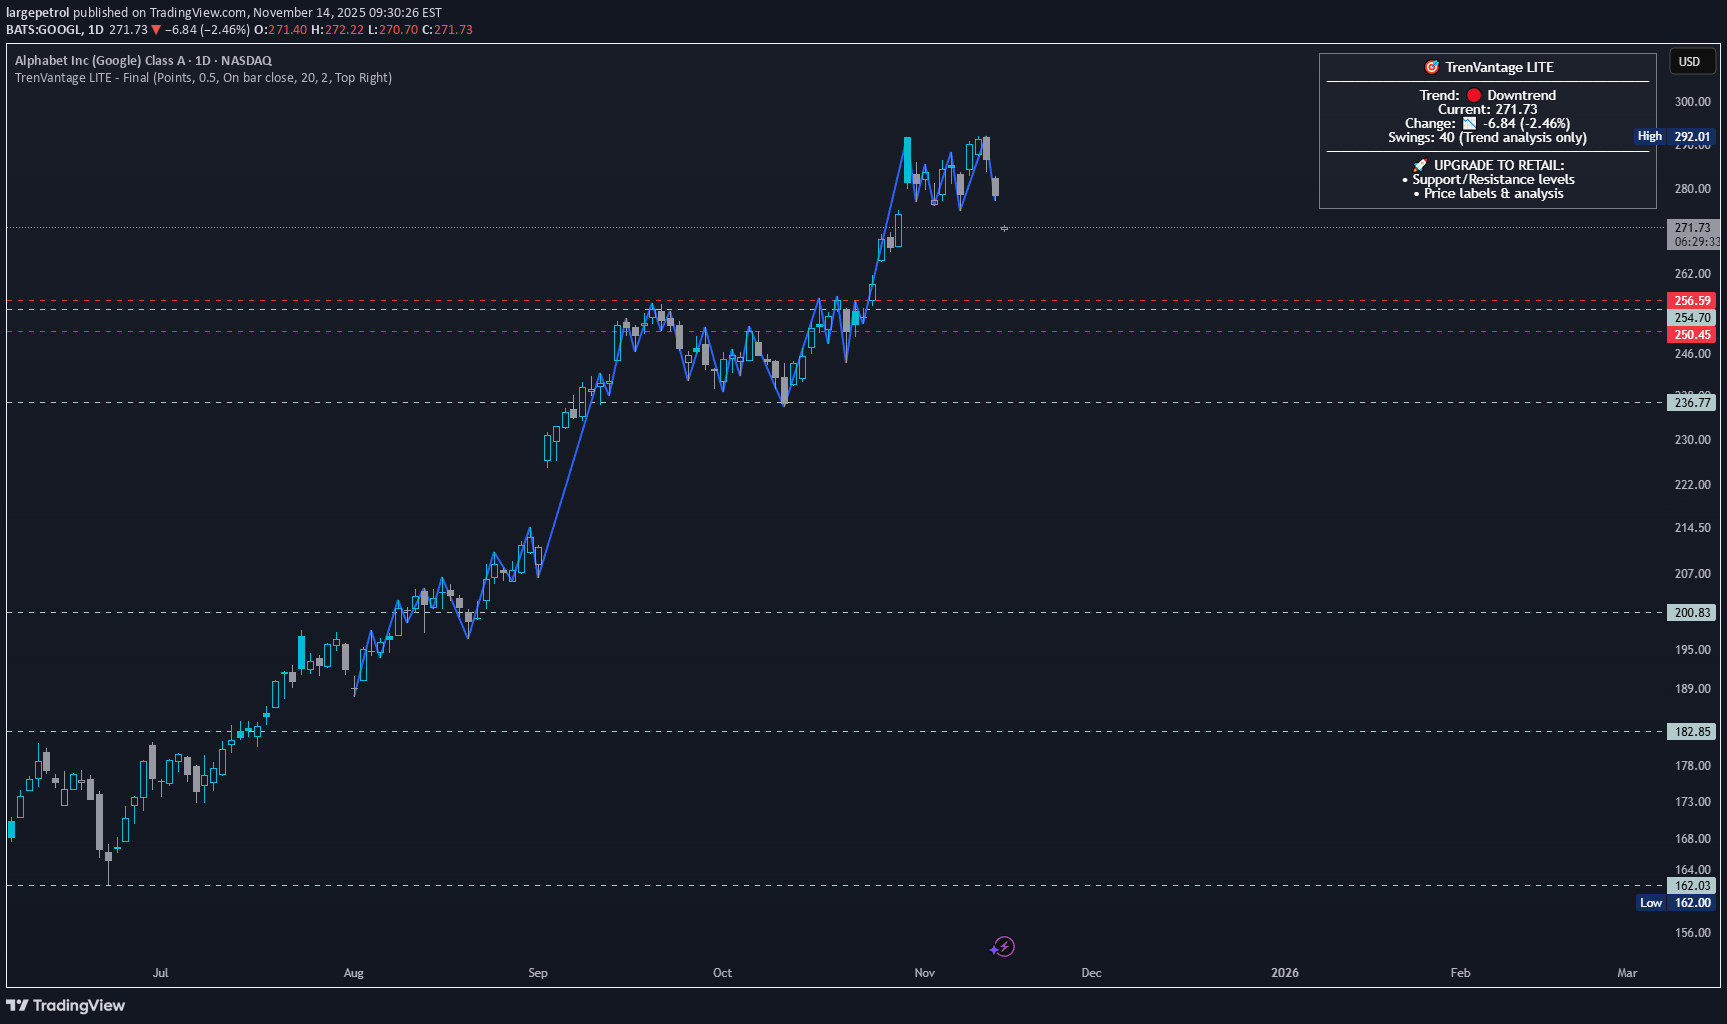
نظرة سریعة على جوجل الرائدة فی مجال التکنولوجیا هنا باستخدام مؤشر TrenVantage LITE. حالیًا فی اتجاه صعودی کما نرى، ولکن هناک خطر هبوطی کبیر للتراجع. الجدول الزمنی هو بضعة أشهر، ولکن إذا بدأ فی التعثر، راقب هذه المستویات

گوگل از کانال 2007 خارج شد؛ آیا سقوط در راه است؟
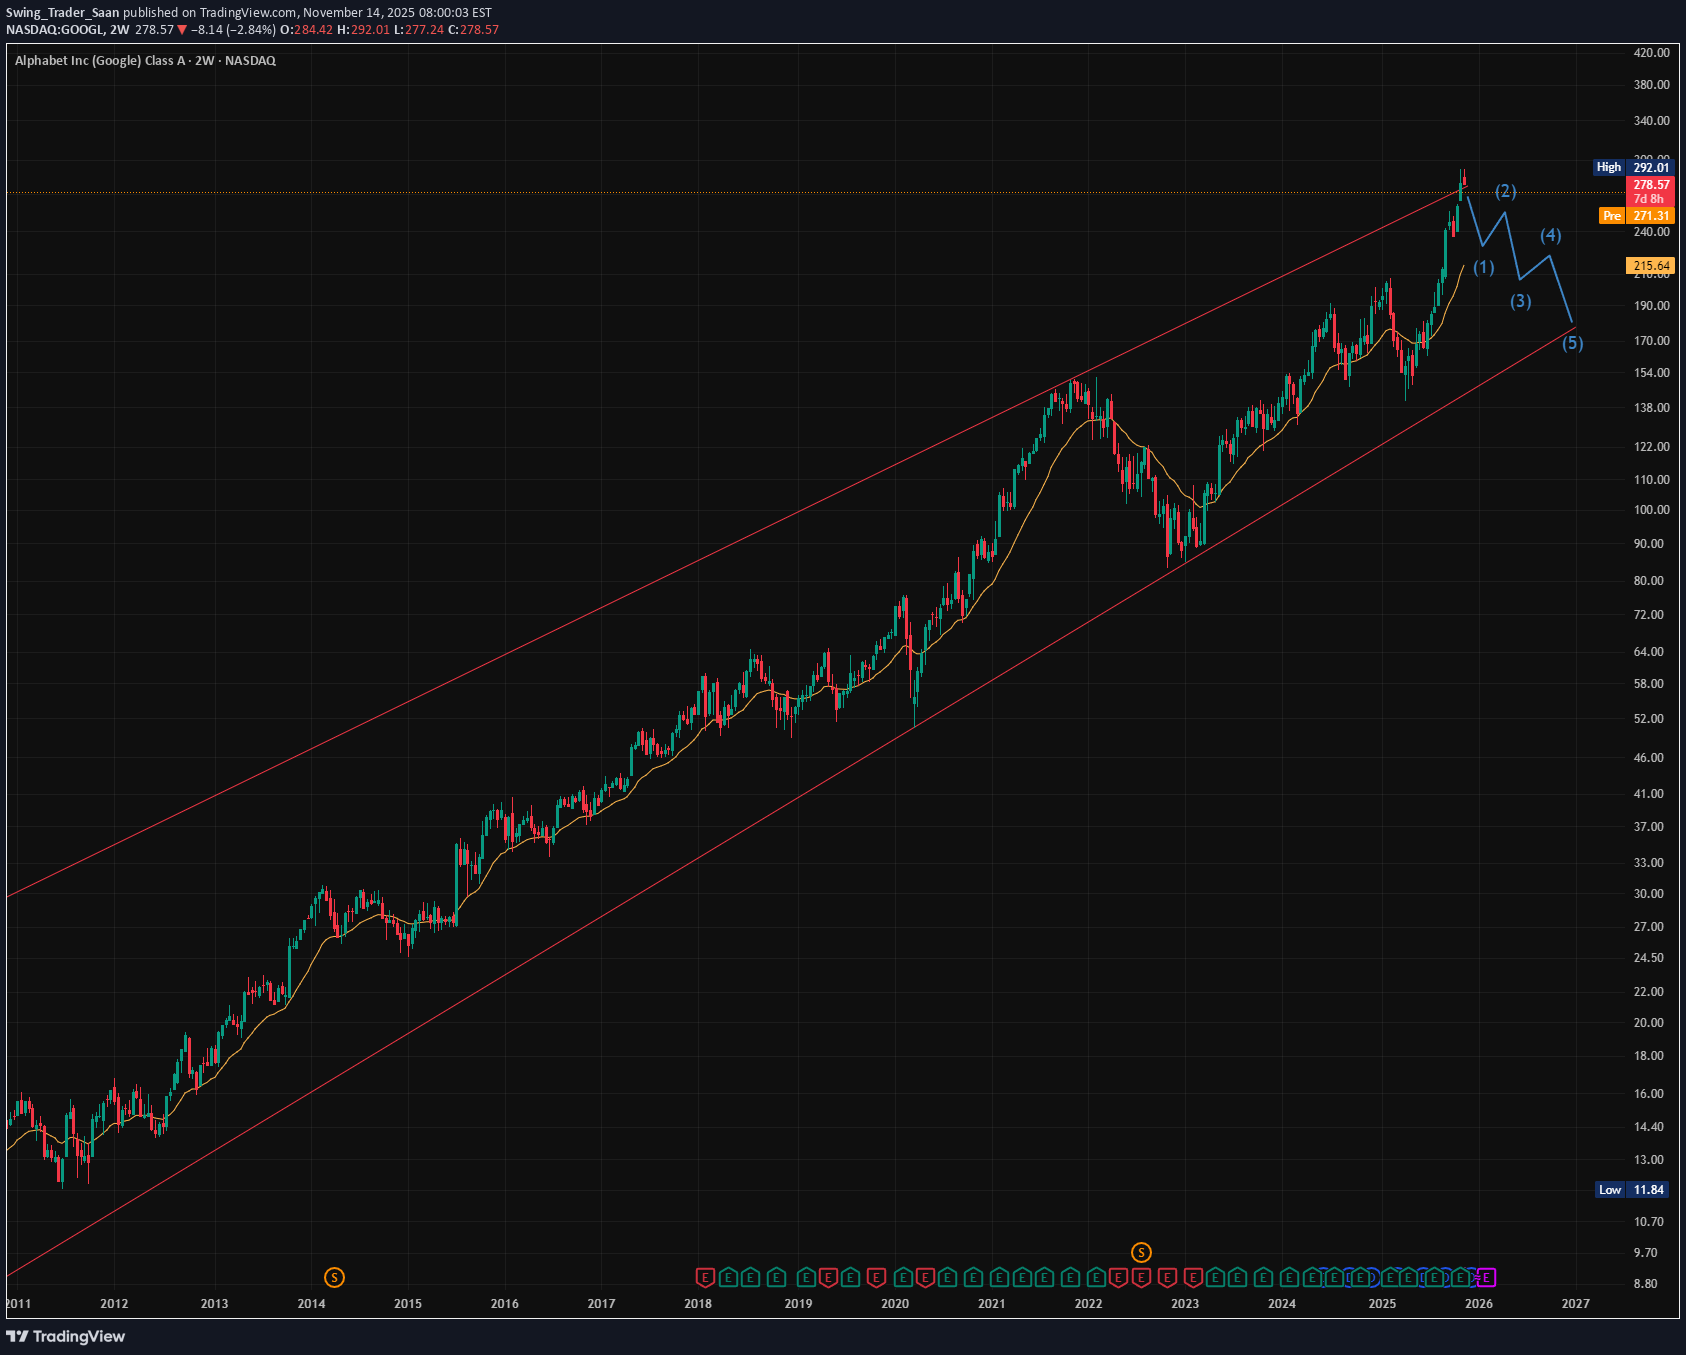
عادةً عندما تتجاوز القنوات الحد المسموح به، نعود (على الأقل) إلى الجانب الآخر من القناة: جوجل جاسوس
DEXWireNews
سرمایهگذاری ۶ میلیارد دلاری گوگل در آلمان؛ آیا سهام GOOGL از مرز ۳۰۰ دلار عبور میکند؟
ارتفعت شرکة Alphabet Inc. (NASDAQ: GOOGL) إلى مستویات قیاسیة جدیدة هذا الأسبوع حیث ظهرت تقاریر تفید بأن Google تخطط لاستثمار ما یقرب من 5 ملیار یورو (5.8 ملیار دولار) فی ألمانیا لتوسیع مرکزها data وبصمتها التحتیة. وبحسب المصادر التی نقلتها رویترز، تتضمن الخطة بناء مرکز جدید فی دیتزینباخ بالقرب من فرانکفورت، وتوسیع منشأة موجودة فی هاناو. ویعزز کلا المشروعین التزام جوجل المتنامی تجاه أکبر اقتصاد فی أوروبا ودفعها على المدى الطویل نحو الذکاء الاصطناعی والابتکار المحاید للمناخ. یمثل هذا الاستثمار أحد أهم استثمارات Google فی أوروبا، حیث یتماشى مع استراتیجیتها الأوسع لتعزیز data قوة المعالجة والاستدامة. ومن المقرر عقد مؤتمر صحفی یوم الثلاثاء، حیث من المتوقع أن یقدم وزیر المالیة الألمانی لارس کلینجبیل تفاصیل إضافیة. وینظر المحللون إلى هذا التوسع باعتباره إشارة قویة إلى الثقة فی الاقتصاد الرقمی فی أوروبا والتحول القائم على الذکاء الاصطناعی. على الصعید الفنی، کان سهم Google یسیر فی اتجاه صعودی قوی، حیث وصل مؤخرًا إلى حوالی 290 دولارًا بعد اختراق المقاومة طویلة المدى. یُظهر الزخم الصعودی القلیل من علامات التباطؤ، حیث یتطلع المتداولون إلى المستوى النفسی الرئیسی عند 300 دولار باعتباره الهدف التالی major. یظل هیکل الحجم والاتجاه داعمًا، حیث یعمل خط الاتجاه الصاعد کمنطقة دعم محتملة فی حالة الارتداد. قد یؤدی الارتداد من تلک المنطقة إلى زیادة الاستمرار نحو مستویات قیاسیة جدیدة. ومع وجود أساسیات قویة مدعومة باستثمارات أوروبیة major وإعداد فنی صعودی، یبدو أن جوجل مستعدة لتوسیع ارتفاعها. سوف یراقب المستثمرون ما إذا کان هذا الزخم یمکن أن یدفع GOOGL إلى ما هو أبعد من 300 دولار، وهو أقل من 5 دولار یمکن أن یشیر إلى الفصل التالی من النمو لأحد عمالقة التکنولوجیا الرائدین فی العالم.
ترید فرکانس بالا: راز سودآوری از شکافهای زمانی بازارهای جهانی
Introduction High-Frequency Trading (HFT) has transformed global financial markets by introducing ultra-fast algorithmic strategies that execute thousands of trades in microseconds. With advancements in technology, fiber optics, and low-latency infrastructure, HFT firms continuously search for even the smallest market inefficiencies. One of the lesser-known but increasingly significant strategies in HFT is the exploitation of time zone gaps—leveraging differences in trading hours across global markets to gain arbitrage opportunities. As global financial systems operate around the clock, markets in Asia, Europe, and North America function in different time zones. This asynchronous operation creates brief windows—known as time zone gaps—where information, price movements, or sentiment from one region can be exploited before it fully reflects in another. HFT algorithms capitalize on these moments to generate profit, often within fractions of a second. Understanding Time Zone Gaps Time zone gaps arise because not all markets operate simultaneously. For example: Asian markets (like Tokyo, Hong Kong, or Singapore) open first. European markets (like London or Frankfurt) open after Asia closes. North American markets (like New York or Toronto) open last. Between these openings and closings, there exist periods of overlap (such as the London-New York overlap) and non-overlap windows, when one region’s market reacts to information while another remains closed. These non-overlap periods create price differentials—temporary inefficiencies in related assets, currencies, or commodities. For instance, if U.S. stocks close higher due to strong tech earnings, Asian futures or ETFs linked to the same companies might open higher the next morning. HFT systems exploit these predictable movements during the microseconds after Asian markets open, before manual traders can respond. Mechanism of Exploitation HFT firms deploy advanced cross-market arbitrage algorithms to identify and act on price discrepancies caused by time zone differences. The process generally follows these steps: Global Data Synchronization HFT systems continuously monitor data feeds from exchanges worldwide. They record closing prices, index movements, commodity futures, and currency pairs. Predictive Modeling Algorithms use machine learning and statistical models to predict how an asset in one market should move when another related market opens. For example, if the S&P 500 rises by 2% overnight, the Nikkei 225 futures might be expected to rise proportionally. Latency Arbitrage Execution The key lies in speed. HFT systems execute trades the instant a market opens—often milliseconds before conventional traders—taking positions in stocks, ETFs, or derivatives that are likely to adjust based on global cues. Market Neutral Positions These trades are often market neutral, meaning they do not depend on overall market direction. Instead, they rely on capturing the small, temporary mispricing between two correlated assets across time zones. Exit Strategy Once the market adjusts (usually within seconds or minutes), HFT systems exit positions, locking in profits from the price convergence. Examples of Time Zone Arbitrage Equity Index Futures Consider futures contracts on the Nikkei 225 and S&P 500. When the U.S. market closes with a strong rally, HFT systems anticipate that Japanese futures will open higher. They buy Nikkei futures moments before the Tokyo Stock Exchange opens, profiting from the predictable uptick. Currency Pairs (FX Market) Although the forex market operates 24/5, liquidity fluctuates with regional business hours. HFTs exploit cross-currency correlations—for example, between USD/JPY and EUR/USD—when one region’s liquidity dries up, creating a slight pricing lag before another market compensates. Commodity Markets Oil or gold futures traded in New York often influence Asian commodity prices the next morning. HFT algorithms scan U.S. closing data and place instant orders on Asian commodity exchanges at open, capitalizing on the delayed reaction. ETF vs. Underlying Asset Arbitrage Exchange-Traded Funds (ETFs) that track international markets (like “iShares MSCI Japan ETF” listed in New York) can diverge from their underlying asset prices when the foreign market is closed. HFT systems arbitrage these gaps as soon as the foreign market reopens. Technological Infrastructure Behind HFT To exploit time zone gaps effectively, HFT firms invest heavily in technology, as speed and precision are critical. Key components include: Low-Latency Networks: Fiber-optic or microwave communication links that transmit data across continents in milliseconds. Co-Location Services: Placing servers physically close to exchange data centers to reduce transmission delay. Predictive Algorithms: AI and machine learning models trained on years of cross-market data to forecast short-term movements. Real-Time Analytics: Systems capable of processing terabytes of financial data per second for instant decision-making. Smart Order Routing (SOR): Algorithms that determine the optimal exchange and timing for order execution across markets. Advantages of Exploiting Time Zone Gaps Arbitrage Efficiency – Profiting from predictable market reactions without directional risk. Liquidity Provision – HFT often adds liquidity to markets during low-volume periods. Price Discovery – By quickly integrating global information, HFT helps align asset prices across time zones. Diversification of Opportunities – Allows firms to operate continuously, taking advantage of 24-hour trading across the globe. Challenges and Risks While profitable, exploiting time zone gaps comes with significant risks and operational hurdles: Technological Costs The infrastructure required for global, low-latency trading is extremely expensive. Only large institutions can afford these systems. Regulatory Scrutiny Different regions have different trading regulations. Ensuring compliance across jurisdictions (e.g., the U.S. SEC vs. Japan’s FSA) is complex and risky. Market Fragmentation Data synchronization across multiple time zones can lead to inaccuracies due to latency or bandwidth issues, resulting in potential trading losses. Competition As more HFTs target the same inefficiencies, profit margins shrink rapidly. The competition becomes a “race to zero” in terms of latency. Flash Crashes and Instability Rapid algorithmic trading across interconnected markets can amplify volatility. A shock in one market can instantly ripple across others, causing flash crashes. Regulatory and Ethical Considerations Global regulators have expressed concern that exploiting time zone gaps might create unfair advantages for technologically advanced firms. Critics argue that HFTs manipulate speed rather than true economic value. To address this, some exchanges have introduced speed bumps or randomized order delays to reduce the impact of latency-based strategies. Moreover, cross-border coordination is limited. Without harmonized regulation, firms can operate in regulatory “gray zones,” exploiting markets with weaker oversight. This has led to ongoing debates about transparency, fairness, and market stability. The Future of HFT in Global Time Zone Trading The evolution of global markets suggests that HFT will continue to refine time zone gap strategies. Key future trends include: AI-Powered Prediction Models: Advanced neural networks will better anticipate inter-market reactions, making time zone exploitation even more precise. Quantum Computing: Future breakthroughs in computational speed could make latency arbitrage almost instantaneous. 24/7 Trading Models: As more markets (like cryptocurrencies) adopt round-the-clock trading, traditional time zone gaps may shrink, pushing HFTs to adapt. Regulatory Convergence: International cooperation could create unified frameworks, balancing innovation with market integrity. Conclusion High-Frequency Trading’s ability to exploit time zone gaps showcases how technology, data, and speed converge in modern finance. By leveraging global time differences, HFT firms transform tiny inefficiencies into consistent profits. While such strategies enhance liquidity and price discovery, they also raise concerns about market fairness, systemic risk, and unequal access to technology. In essence, exploiting time zone gaps represents both the brilliance and the fragility of today’s interconnected markets—a reflection of how milliseconds can define success in a 24-hour global trading ecosystem.

The-Thief
گوگل (GOOGL) تا مقاومت 320 دوام میآورد؟ استراتژی خرید لایهای!
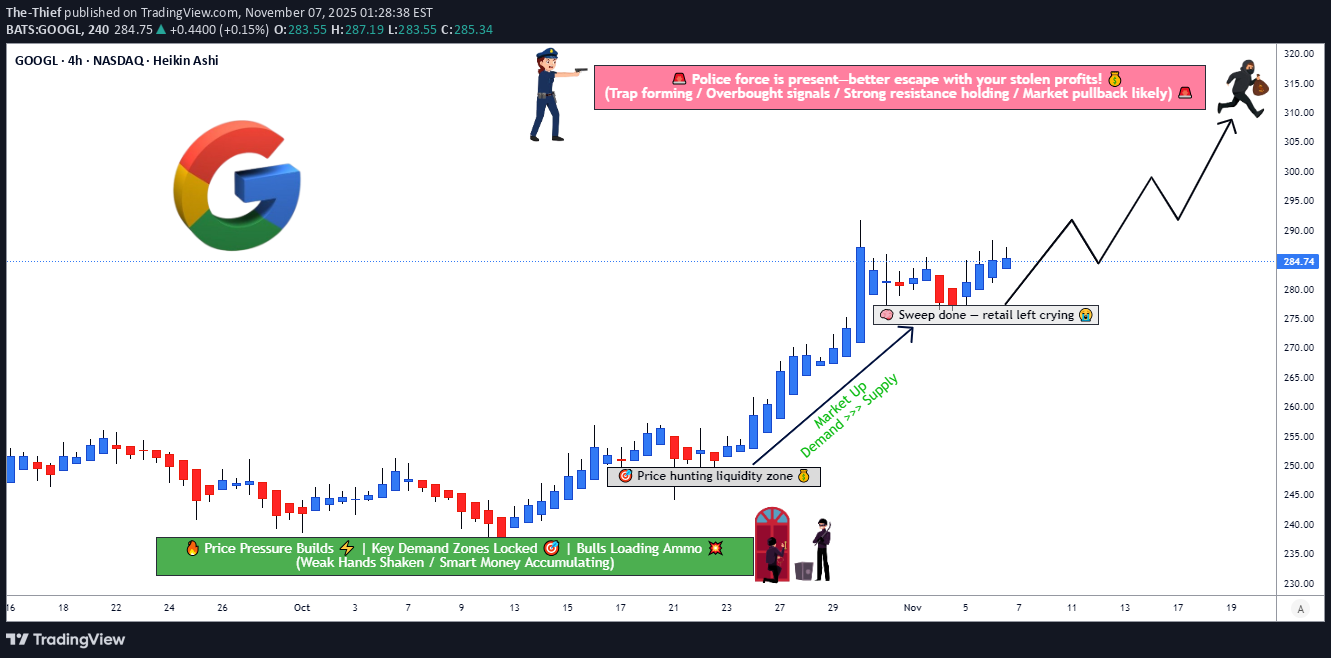
🎯 سرقة GOOGL: خطة الهروب من عملیة الأبجدیة 💰 شرکة ألفابیت (ناسداک) - تجارة متأرجحة | استراتیجیة دخول متعددة الطبقات 📊 الإعداد المشاعر: 🟢 صاعد | الإطار الزمنی: التجارة المتأرجحة | مستوى الخطورة: متوسط 🎲 استراتیجیة الدخول: "طبقات اللص" تراکم الشراء الاستراتیجی متعدد المستویات باستخدام أوامر الحد نهج طبقة تلو طبقة: 🔵 Layer 1: 270.00 دولارًا (الإدخال المبدئی - المرکز 30%) 🔵 Layer 2: 275.00 دولارًا (منطقة الدعم - مرکز 35%) 🔵 Layer 3: 280.00 دولارًا (منشئ القوة - مرکز 35%) لماذا یعمل هذا؟ تعمل الإدخالات المتعددة على تقلیل أساس متوسط التکلفة وتسمح بأقصى قدر من کفاءة رأس المال. إذا رفض السعر الارتفاع، فقد حصلت على عملیات تعبئة فی المناطق المنخفضة. إذا کان یضخ، فأنت بالفعل فی الداخل! 💡 🛑 حمایة من إیقاف الخسارة Hard التوقف: 🚨 265.00 دولارًا (أسفل هیکل الدعم) ویمثل هذا خطرًا بنسبة 1.9% من Layer إدخال واحد - إدارة المخاطر المنضبطة فی أفضل حالاتها. ⚠️ الإقرار بالمخاطر: وقف الخسارة، قواعدک. نحن تجار، ولسنا مستشارین مالیین. قم بالتعدیل بناءً على قدرتک على تحمل المخاطر وحجم الحساب. هذه مشارکة للإستراتیجیة التعلیمیة، ولیست نصیحة مالیة شخصیة. 🎖️ أهداف الربح وطرق الهروب الهدف الأساسی: 📈 310.00 دولارًا تشکیل منطقة مقاومة قویة ظروف ذروة الشراء تتطور الإجراء: احصل على أرباح تتراوح من 50 إلى 60% هنا الهدف الثانوی: 🏆 320.00 دولارًا منطقة حاجز الشرطة (المقاومة الشدیدة) احتمالیة فخ عالیة عند هذا المستوى الإجراء: قم بتوسیع النطاق المتبقی بنسبة 40-50% أو قم بتشدید نقاط الوقف للوصول إلى نقطة التعادل فلسفة الخروج: الجشع یقتل التجار. جنی الأرباح بشکل منهجی. أفضل التجارة هی التی تنام فیها جیدًا فی اللیل. 😴 ⚠️ ملاحظة الربح: أهدافک، توقیتک. یتم الخروج بناءً على ظروف السوق وتأکید الحجم ومستوى راحتک. 🔗 الأزواج ذات الصلة بالشاشة (مراقبة الارتباط) 🔵 MSFT 📱 — الارتباط العالی (قطاع التکنولوجیا) | إذا انهار MSFT، تواجه GOOGL ریاحًا معاکسة فی القطاع. راقب إشارات التباعد هنا أولاً. 🔵 QQQ 🔺 — 0.85+ ارتباط (ناسداک-100) | ضعف QQQ = إشارة انسحاب GOOGL المحتملة. هذا هو فحص صحة قطاعک قبل الدخول. 🔵 آی دبلیو إم 📊 — الارتباط العکسی (خطر الدوران) | قوة راسل 2000 = أموال النمو التی تترک الشرکات الکبرى. إذا ضخت الشرکات الصغیرة الحجم، فقد تهدأ التکنولوجیا. 🔵 TLT 💳 — وکیل سعر الفائدة | ارتفاع السندات = الضغط التکنولوجی؛ السندات المتساقطة = صدیقة للتکنولوجیا. تتدفق سیاسة بنک الاحتیاطی الفیدرالی مباشرة من هنا. 🔵 VIX 😰 — مؤشر التقلب | ارتفاع VIX = العزوف عن المخاطرة، وتصفیة GOOGL المحتملة. أعلى من 20 = تقلیل تعرض الموضع. البصیرة الأساسیة: شاهد QQQ وMSFT أولاً. إنهم طائر الکناری الخاص بک فی منجم الفحم. إذا کان القطاع ضعیفًا، فأعد النظر فی قناعة الدخول الخاصة بک. 🚨 💎 ملخص الإستراتیجیة ✅تحیز صاعد مع تراکم منضبط متعدد الدخول ✅ المخاطر المحددة مع توقف hard عند 265 دولارًا ✅ عملیات جنی الأرباح على مراحل لتأمین المکاسب بشکل منهجی ✅ الوعی بالارتباط یمنع دوران القطاع المفاجئ 🎬 الأفکار النهائیة تذکر: هذه هی استراتیجیة Thief Strategy™ — وهی عبارة عن إطار تعلیمی ممتع للتداول المتأرجح، ولیست نصیحة مالیة. التجارة على مسؤولیتک الخاصة. یجب أن یعکس حجم المرکز ووقف الخسائر وأهداف الربح وضعک الفرید وتحمل المخاطر وحجم الحساب. لا تعمل السرقة إلا إذا هربت من الأرباح. لا ننشغل عقد الحقیبة! 💼🚪 ✨ إذا وجدت قیمة فی تحلیلی، فإن التعزیز 👍 و 🚀 موضع تقدیر کبیر - فهو یساعدنی على مشارکة المزید من الإعدادات مع المجتمع! #GOOGL #AlphabetInc #SwingTrade #TechAnalogy #TradingStrategy #NASDAQ #TradingIdeas #MultiLayers #RiskManagement #Bullish #ThiefStrategy #TradingCommunity #TradingView #Technical #StockMarket
EPSMomentum
پیشبینی صعودی گوگل (GOOGL) پس از گزارش درآمد: دقت ۷۹٪!
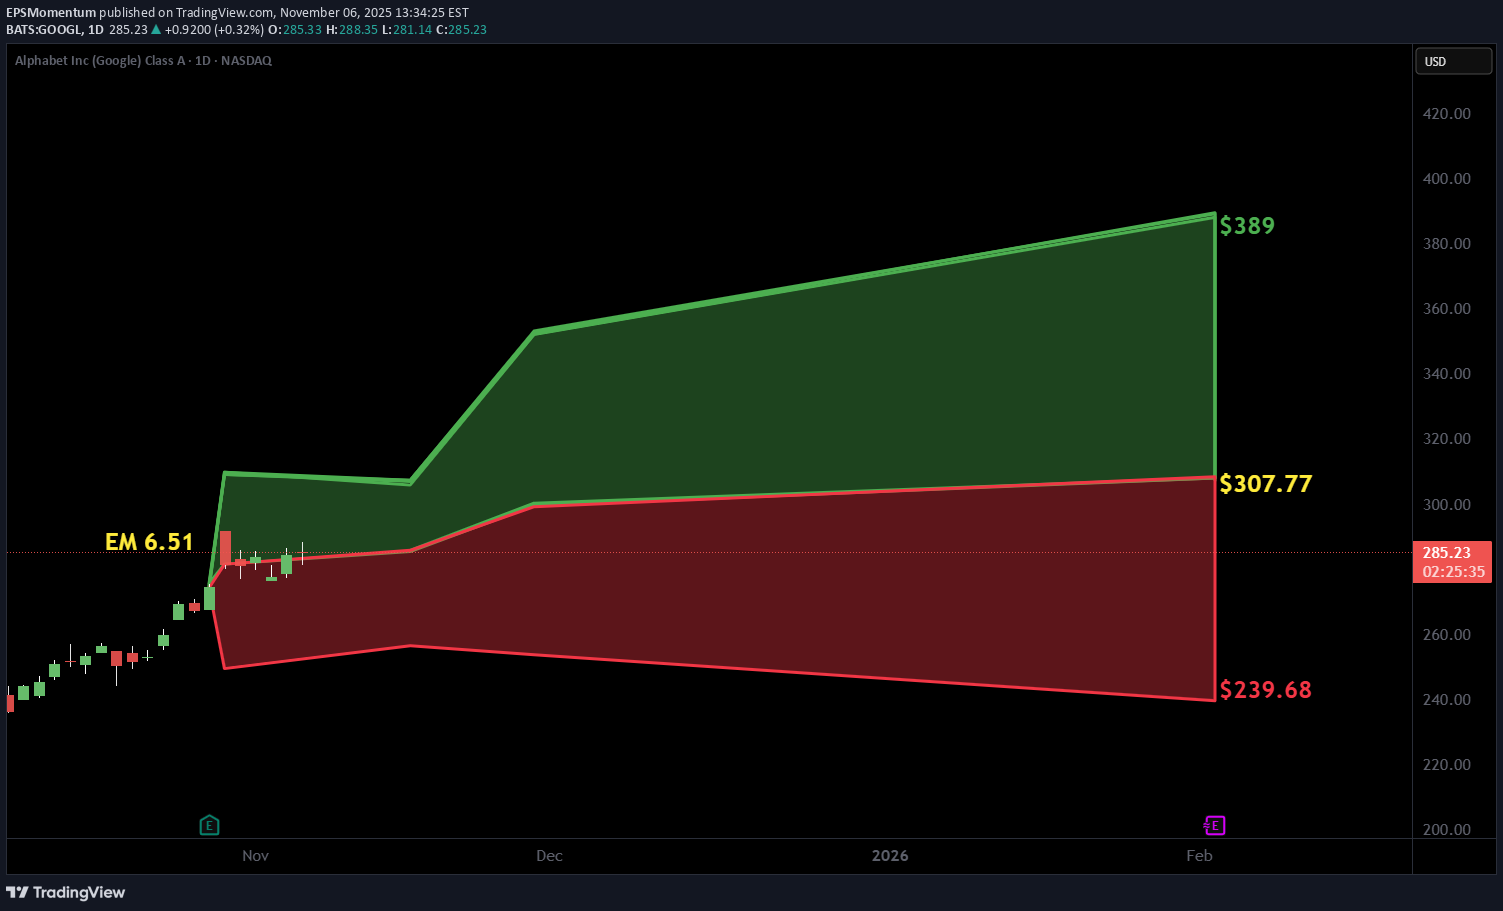
توقع PEAD توقعات صعودیة لـ جوجل بعد رد فعل إیجابی بعد إعلان أرباحها، مما وضع السهم فی drift A بدقة متوقعة تبلغ 78.95%.
إخلاء المسؤولية
أي محتوى ومواد مدرجة في موقع Sahmeto وقنوات الاتصال الرسمية هي عبارة عن تجميع للآراء والتحليلات الشخصية وغير ملزمة. لا تشكل أي توصية للشراء أو البيع أو الدخول أو الخروج من سوق الأوراق المالية وسوق العملات المشفرة. كما أن جميع الأخبار والتحليلات المدرجة في الموقع والقنوات هي مجرد معلومات منشورة من مصادر رسمية وغير رسمية محلية وأجنبية، ومن الواضح أن مستخدمي المحتوى المذكور مسؤولون عن متابعة وضمان أصالة ودقة المواد. لذلك، مع إخلاء المسؤولية، يُعلن أن المسؤولية عن أي اتخاذ قرار وإجراء وأي ربح وخسارة محتملة في سوق رأس المال وسوق العملات المشفرة تقع على عاتق المتداول.