
trader-123456
@t_trader-123456

Ne tavsiye etmek istersiniz?
önceki makale
پیام های تریدر
filtre
Chainlink

Ayrışmaya bakıldığında zirve rallisi tahmin etmek ve kısa pozisyon açmak kolaydı.
Coinbase
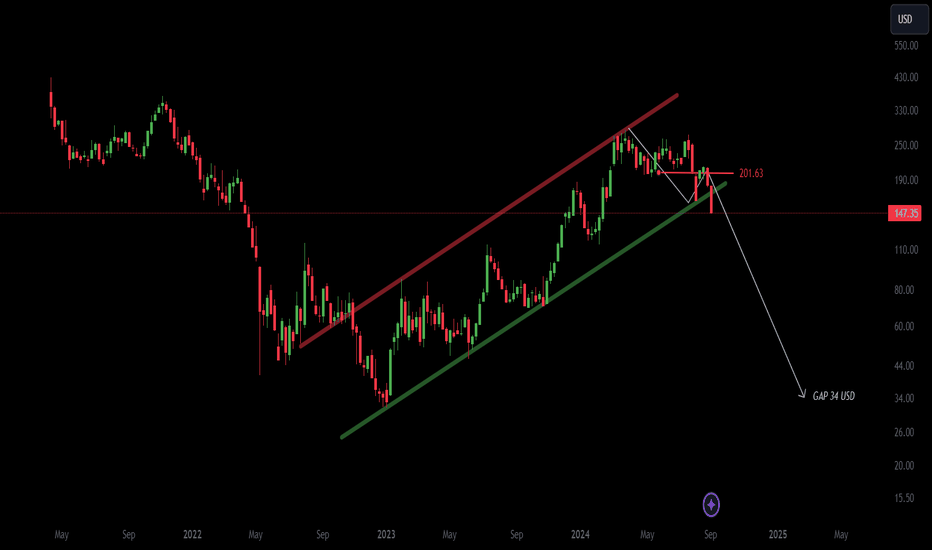
Şu anda klasik bir Eylül ayı tuzağı devam ediyor olabilir. Ancak 200 USD'nin üzerinde bir kapanma yoksa ve sonraki aylarda para perakendecilerden akmaya başlamaz. Bu yüzden muhtemelen düşecek, aşırı hedef 34USD'lik bir boşluk.
MEME COIN PEPE

Eğer bir aydır mavi alanda PEPE'ın yaptığını düşündüğüm iki şema arasında seçim yapmak zorunda kalsaydım, kesinlikle dağıtım şeması olurdu. Şu anda kırılmış olan alt ana trend çizgisi bile pek iyimser görünmüyor. Büyük oyunculardan çılgın alıcıların eline geçen tokenların en büyük hareketi mantıksal olarak mani aşamasında gerçekleşti ve geri kalanının bu ayki dağıtım sırasında gerçekleştiğini düşünüyorum. Bu şemanın kaç kez tekrarlandığını bilmiyorum ve her zaman insanları değersiz tokenlarla baş başa bıraktı. Hiçbir ticaret tavsiyesi yok, fiyat özel olarak yayınlanan bir haberden dolayı artabilir, ancak daha sonra başladığı yere gelmesi çok olasıdır. Shitcoin koleksiyonundan bir tane daha. Güncel değer 0.00008221 Yorum: Pepe kurbağa desteğin üzerinden geri atlamaya çalıştı ancak başarısız oldu. Bu bir kurbağa, bu yüzden sıçrayacak ve muhtemelen bir taş gibi düşmeyecek. LUNC ayrıca son ret olarak belirlediğim noktadan itibaren 340 gün boyunca düşüş yaşadı, ardından güzel bir -%87 düştü.Yorum: Kurbağa ilk hedefe ulaştı.Yorum: PEPE Kurbağa desteğin altından geçti. Önceki desteği test edebilir ve direnç olarak onaylayabilir, ardından muhtemelen bir sonraki hedefe sıçrayacaktır.Yorum: Akıllı para dağıtım için likidite sağladığınız için size teşekkür ediyor.Yorum: Pepe Kurbağa desteğin üzerinden baktı ancak hemen bir çekiçle vuruldu. Tam olarak 1 Eylül'deki fikre göreYorum:
CARDANO

ADA için uzun vadeli planım, ama yarının ne getireceğini bile bilmiyorum. İnvalidasyon, sarı çizgi kırıldığı zamandır, eğer yeterli hacim ile test ve satın alma varsa, bunu birikim aşamasının nihai sonu olarak görürüm.
LITECOIN

LTC'de tarih tekerrür ederse, yakında pompalamaya başlayacak. Elbette, yolculuktan önce ay çocuklarını emmek için yeşile bir fitil atabilir, ancak bu bayrak desenindeki fakeot sayısı son altı ayda inanılmaz sayılara ulaştı, bu yüzden bir tane daha saçma olurdu. Bu ticaret için değil, sadece benim fikrim. Belki bu sefer farklı olur :) Yorum: Amca Wyckoff'a göre, LTC düşüşün başlamasından hemen önce B aşamasında olmalı, elbette soru yöntemin doğru uygulanıp uygulanmadığı, ancak mantıklı olurdu, LTC trend çizgisinin üzerinde kalmadı ve geri düştü ve boğaları çekeceği yer tam olarak burası değil ve şu anda bunun bir ayı tuzağı olduğunu düşünmüyorum. Likidite için Haziran 2022 minimumunun altına inmek ve yeni bir yolculuğa başlamak mantıklı olurdu. Sadece zaman gösterecek.Yorum: LTC yarıya indi ve fiyat düşüyor (varsayılan). Hiçbir haberi takip etmiyorum ama bir yerde LTC köpekbalıkları ve yunusların (büyük oyuncular) 14 Haziran'dan beri agresif bir şekilde LTC (205.400 LTC) stokladığına dair bir boğa raporu gördüm. Ve yarılanmadan sonra bunun artmasını bekliyorlar, bu kadar sermayesi olan insanların LTC yarılanmasının tarihsel olarak bir satış sinyali olduğunu görmeyecek kadar aptal olduğuna inanmıyorum. Ancak, ne yaptıklarını çok iyi biliyorlar, sadece yarılanma öncesi yükselişe binmek ve klasik olarak yukarıdaki perakendecilere satmak istediler. LTC devam edecek ve belirsiz sinyaller verecek, 77$'ın altında bir kapanış belirleyici olacak. Yol boyunca LTC'i yakalayacak mıyım? Kesinlikle hayır, ben huzurlu bir uykuyu tercih ederim. Yıl sonuna kadar bekleyeceğim ve LTC'un ilgi alanıma girip girmediğine bakacağım, girmezse evet mümkün, spekülasyon yapabileceğim başka bir şey bulurum, strese girmem.Yorum: 14 Haziran civarında agresif bir şekilde LTC stoklayan büyük oyuncuların cüzdanlarına bakmak ve Temmuz başında cüzdanların boşalıp boşalmadığına bakmak ilginç olurdu. Eğer herhangi biriniz nerede arayacağınızı biliyorsanız, lütfen yorumlara yazın. Teşekkürler.Yorum: LTC kritik bir alanda. Ancak her durumda, hedefin potansiyel olarak sadece önümüzdeki aylarda, yarın değil, bekliyorum. Şu anda -%32, bu nedenle geçici bir geri çekilme kesinlikle mümkün. Piyasanın maker likiditeyi kimden aldığına bağlı, kısa pozisyonlar ve ardından uzun pozisyonlar, mevcut piyasa bununla ilgili.Yorum: Şimdiye kadar, Bay Wyckoff'un haklı olduğu anlaşılıyor. Geride bıraktıklarınız için teşekkür ederim.Yorum: LTC, kısa pozisyonların tasfiyesinin ardından piyasanın yükseliş eğilimi göstermesiyle faz c'ye girmek için doğru alanda olabilir. Zirveye hızlı bir vuruştan ziyade, Mart ayındaki fikirde öngördüğüm gibi tam teşekküllü bir dip oluşumu görmeyi tercih ederim.Yorum: LTC, düşüş noktasını belirlediğim son gönderimden bu yana şu anda %10 düştü.Yorum:Yorum: 7 Kasım'da LTC'in 77$'a dokunduktan sonra düşmeye başlayacağını yazmıştım, oldu ve henüz yukarı çıkmak istemiyor gibi görünüyor. Hala Haziran 2022'deki en düşük seviyenin altında bir hedefle düşüş bayrağı ve Wyckoff dağıtım modelinin gerçekleşeceğini düşünüyorum.Yorum: En az iki haftalık mumun 0,5'in üzerinde geçerli bir kapanışı bu fikri geçici olarak askıya alabilir veya hatta iptal edebilir. Buna karşılık, 60 doların altında bir kapanış satış dalgasını ve C Fazı'nın başlamasını tetikleyebilir.
ETH

Vitaliku'nun eşkenar dörtgeni çok uzun bir boğa tuzağı gösterdi. Ancak şu anda bir sonraki büyük pompalama için güç topluyor, en büyük direnç altında boğa olmayacağım, bu asla olmayacak. 2000$'ın üzerine güçlü bir şekilde kırın ve destek olarak test edin, sonra biraz boğa koşusundan bahsedebiliriz.Yorum: Vitalik'in roketi atmosfere girdi, geri sayım şu anda devam ediyor. Yıldızlara uçuş süresi geçici olarak 300 gün olarak planlandı. Uçuş için yakıt sağlayacak alıcılar varsa ne kadar yükseğe çıkacağı basit. İptal hala basit, roketi 2000 USD'nin üzerine bırakın ve yeni bir fırlatma rampası olarak onaylayın.Yorum: Bir piyasanın maker bu kadar fazla yatırım yapmış sahibi olan bir altcoini fırlatması mantıklı değil. Roket çok aşırı yüklenmiş, bir sonraki boğa piyasasında yeni bir projeyi abartmak ve boş kalkış yapmak daha iyi. Bu sadece benim fikrim ve yanılıyor olabilirim.Yorum: Şimdiye kadar, burada tekrar olmaması için hiçbir neden göremiyorum. Perakendecilerin ceplerinden zenginlerin ceplerine gerçek paranın ($) klasik bir hareketi.Yorum: Her yerde doların felaket sonu hakkında makaleler varsa ve bunlar sizi kripto çöpüne yatırım yapmaya teşvik ediyorsa. Yani tam tersini yapmanız gerekir.
ETH - Bull Trap

Piyasa maker 2018 senaryosunu tekrarlıyor, trend çizgisini aşmak boğaları cezbediyor ve sonra onları uçuruma atıyor.Yorum: Yorumlarda short'un hedefinin ne olduğuyla ilgili sorular alıyorum, bunu buraya yazacağım böylece bir kereden fazla yazmak zorunda kalmayacağım, cevabım bilmiyorum. Bir yıl önce bir çift dip ve 3500 dolara uzun bir fikir oluşturdum, burada bir boğa tuzağı kurulacak ve ardından 1000 dolara kısa bir pozisyon açılacaktı, oradaki durumu tahmin etmek oldukça kolaydı ve eğer biri küçük bir çocuktan alınmış gibi görünen bu planı tam olarak takip etseydi, uzun zaman önce Karayipler'de balinalarla yüzebilirdi ve burada short veya long ile uğraşmak zorunda kalmazdı. Bir rekt alacağımı yazmanıza bile gerek yok, çünkü mevcut piyasada pozisyonum yok, bu yüzden bahis yapmazsam mantıksal olarak kaybedemem. ETH ne kadar yanlış hamle gösterirse göstersin, önümüzdeki aylarda patlama aşamasına düşme riski yüksek. Bu plan iyi gitmezse potansiyel olarak tehlikeli bölgeler konusunda uyarmaya çalışıyordum, evet bazen mucizeler olur ama ben mucizelere inanmam... Uyarıldı boğa tuzağı $3500 ve kısa $1000 ✔ Uyarıldı kısa $2700 ✔ Uyarıldı kısa $2000 ✔ Uyarıldı kısa $1750 (birleştirme) ✔ Uyarıldı kısa $1670 ✔ Balinaların 1000 civarında biriktiğine ve roketin fırlatılmaya hazır olduğuna ikna olduysanız, o zaman aya mutlu uçuşlar.Yorum: Ay çocukları için roketin beklediğimden biraz daha fazla havalandığını itiraf etmeliyim ama fikrimi henüz değiştirmedim. Roket bu tehlikeli bölgeden uçmalı.Yorum: 1400'ün altında bir kırılma olursa, 1200 civarında bir destek testi bekliyorum. Kırmızı bölgeye geri döndüğümüzde, bu yukarı hareketin sadece bir tuzak olduğu doğrulandı.Yorum: Füze tehlikeli bölgenin üzerinden uçmadı. (log. grafik) Desteğin altına geri döndü, yukarı yönlü momentum kısa pozisyonları tasfiye etmek için işe yarayabilir. Ancak piyasa şu anda daha yükseğe doğru gidiyor, bu yüzden bu daha az olası. Her durumda, yukarıdaki seviyeler geçerli bir şekilde temizlenmezse, girmeyi düşünmenin bir anlamı yok.Yorum: Bu piyasada sadece trend çizgisini kırmanız gerektiğini ve boğa koşusunun geldiğini düşünüyorsanız, o zaman işlemlerinizde bol şans.Yorum: Kırılan destekten bir reddedilme ve ardından 1200 desteğinin test edilmesini bekliyorum.Yorum: Yükselen kama tekrar test edildi, ETH için hala boğa piyasası yok. Fiyatı düşürüp sonra geri getirmek boğa piyasası değildir. Kaç tüccar muhtemelen stop loss'u aktive etti ve kaç kişi satmaya zorlandı. Daha sonra mümkün olduğunca az tüccarın satın alması ve birkaç saat içinde tekrar pompalaması için sahte bir destek kırılması yapın, böylece birçok tüccarın satın almaya vakti olmaz. Piyasa maker iyi oynuyor. Reddedildiğinde, önceki hedefe geri dönüş bekliyorum. Yorum: Ayılar için kurulum şimdiye kadar iyi görünüyor. Yükselen kamada sadece sahte bir kırılma olmuş gibi görünüyor, bu nedenle aşağıdaki ayıları kandırdığı gibi, büyük olasılıkla yukarıdaki boğaları da kandıracaktır. Günlük mum alt trend çizgisinin altında kapanırsa, kısa bir satış olasılığı yüksektir. 1800'ün üzerinde geçerli bir kapanış bu fikri geçersiz kılacaktır. Yorum: Önce ayıları, sonra boğaları kandırın. Bu ayı piyasası rallisi için zaman tükeniyor.
Litecoin

Litecoin Many traders are bullish on LTC due to the halving. It reminds me a bit of the situation when he was at 100USD and it was just before the crash. I'm not saying it will happen again here, but the risk in this area will be high. I like LTC, I would easily put it 1st of all coins. LTC reliably serves exactly the purpose for which it was created. I just keep getting the feeling that the whales still haven't reached their destination. I expected the LTC to start the descent earlier, but maybe this is the target destination for the whales where they are just doing the distribution for +100% profit and then start the migration to the plankton rich area. I have no idea if it will happen, but if you choose a part of the profit at this point or set a stop loss appropriately and do not enter leveraged long positions here, I think it will be reasonable.Comment: I didn't expect LTC to go this far, so I don't dare to guess if it's the end or if his favorite ending 30% pump will follow.Comment: LTC is currently exactly in the area where the big decline followed in May, this may not happen again, but a test of the trend line in the 82 USD area is likely.Comment: LTC is at a decision point. The ascending channel has not yet been broken. If the channel holds, the bulls will head for $120, but at the moment it is quite uncertain, LTC is at a point with a possible 100% profit for 28 days, if the distribution took place, there is a risk that it currently gives a chance to buy on support and subsequently there will be a breakthrough under. But this will be confirmed after the lower trend line is broken and confirmed as resistance. If this happens, I expect a subsequent significant downward movement.Comment: LTC potential bearish flag in log. chart. Bulls lose strength, after 50 days they return to the same place, for bullish continuation it is necessary to break above the red zone. I don't want to say that it's impossible, because LTC has surprised me several times, but I have to admit that there are a lot of obstacles. If the line is broken in the 75 USD area and confirmed as resistance, a bearish flag can play out.Comment: A breakout of LTC below an ascending channel, if previous support is confirmed as resistance, can create a descending channel into the demand zone.Comment: Bears are strong, currently trying to break the support in the log. chart.Comment: LTC immediately broke through the descending channel that I prepared for him there, I expect further decline. Watch out for the SP500Comment:Trade activeComment: Just as I expected, rejection from the broken descending channel.Comment: There is a good chance that the bulls will take the $60 area for a while and there will be a temporary pullback, but this is crypto, so I have an idea in reserve for the extreme case that the bears manage to break below $60, followed by a decline to the previous low. The whales re-suck the plankton and create a double bottom (attracts the bulls). Bear flag test (+50%).Comment: Middle path at breaking 60 usd and the same potential 50% profit.Comment: The LTC may currently be in the end zone if the rejection occurs. I don't think he would have given the people trapped above a chance to leave without loss. Only a valid breakout back above the trendline will invalidate this idea.Comment: Looks like rally time is running out. If the bulls fail to break through the resistance and close there, then LTC will not levitate here. I think the bears will head for the June low area. If there was a drop even lower, I consider it a premium price for the next cycle.Comment: LTC is probably preparing for a false breakout from the descending channel. A subsequent liquidation of the short positions can make his favorite 40% finish. Buyers after a break through resistance will provide liquidity for distribution.
BTC

BTC BTC Lots of people expect 20K and want to shop there. If that happens, I expect a nice reflection there (maybe 40%), but precisely because the 20k tech was a very predictable bottom, I expect a correction even lower. The correction will be fast (not like 2018). Due to the rapid recovery (stock exchanges and miners also need to eat something). Not the financial board. Just for fun.Comment:Comment:Comment:Comment:Comment:Comment:Comment:Comment:Comment:Comment:Comment:Comment: The sand continues to pour down.Trade activeComment:Comment:Comment:Comment:Comment:Trade activeComment:Comment:Comment:Comment:Comment: On retest, there was a break above support (new resistance), there was a quick rejection. On closing under, I expect target number 1.Comment:Comment: Many traders see a triangle test on BTC and believe in an upward continuation. Yes, there is a small chance. Rather, I see a bearish flag that could reach the 14K area and failure to recapture 20K could result in a final capitulation. There is still greed in the market, we are not at the bottom.Comment:Comment: In a bull run BTC goes significantly above its true value, in a bear market it goes below its true value. This cycle will be no different.Comment:Comment:Comment:Comment:Comment:Comment: I use Litecoin as an indicator of what stage the crypto market is in because it's not a shitcoin or a meme coin. So there is no noise around. There hasn't been a close this long (50 days) below major support since 2017. If it fails to close above the (valid) support, I expect a more than 50% downward correction by early September at the latest.Comment: Created just to imagine if BTC kept repeating the same cycle.Comment:Comment: My LTC indicator is still confirming my opinion on the crypto market. If there is no turnaround, I see a good chance of reaching the finish line.Comment:Comment:Comment: The sand started pouring down a few days later than I expected.Comment:Comment: Current situation on LTC vs BTCTrade activeComment: We are getting close to our target, watching the area of the June low.Comment:Comment: I created this chart sometime in June, the current situation there looks like this. BTC is at a crucial phase.Comment: When the stock market starts trading and it is confirmed that the SP 500 is currently in the Bull Trap, BTC will follow.Comment: The chart clearly shows that there has been no change in the market yet, LTC is still under support (unless there is a valid close above $65), the current situation seems to me to be set up for the big players starting to come back into the market and can short it . Its simple whoever tried to catch the bottom will likely provide liquidity, LTC is 60% higher than the low and that would be an incentive for the big players to dump it now. I still see more than a -50% drop in BTC and LTC before the market turns around.Comment:Comment:Trade activeComment: Sorry for bringing LUNC garbage to the profile for BTC, but to give you an idea of how the cycle works, here is an illustrative example, the cycle compressed into 30 days. People never learn. It will happen again and again.Comment: In the previous post I warned that the stock exchange will confirm the bull trap and BTC will follow suit. But crypto players are already starting to have a good estimate on the market and preferred to send it down earlier.Comment: BTC has broken below the Real Value, if it will not be able to get back (Valid), the Blow off Phase can be triggered.Comment:Comment:Comment: BTC Hourglass is about to make another sand fall, they have worked reliably so far. Unless the BTC hourglass fails, but it has no complex mechanism, just sand.Comment: It looks like the market maker used his favorite 6% pump as bait again, there was already a lot of fear in the market, so some greed needs to be instilled again. It can fall from the pump, but there is also the possibility of going sideways, where traders are trapped before the breaking point. Simultaneously with SP 500, where I correctly determined the place for the end of the Bear Market Rally and the point for the Bull Trap.Comment:Comment: I made a small update to the June 6th idea. A few lines on a graph often give a better estimate than a hundred indicators. Simple things often work well.Comment: So far everything is according to plan, the rocket is fueling and the Moon Boys are boarding.Comment:Comment: The Apollo 1 rocket finishes fueling on the LC-34 launch pad. There will be several days of pre-flight testing. After rocket engine ignition there may be a slight jump upwards. Subsequently, a fatal malfunction with a subsequent accident is likely to occur.Comment: I uploaded Elon to the BTC page because he had a lot to do with BTC. He used exactly the right moment in the BTC chart and released a positive news for BTC to hype the market and trigger a stronger mania phase. Elon has a sense for simple design and the Tesla chart follows a simple formula. From the point I marked back in August, Tesla has already written off -30%.Comment: Don't be easily lured in, it often looks bullish right before a crash.Comment: No matter what false moves occur, I still believe that -50% drop on BTC is inevitably coming.Comment: The Apollo 1 rocket completed pre-flight tests and fired its engine. As I expected, there was a slight bounce, fueled by the liquidation of short positions. It is currently in an area that attracts many bulls, if a large number of them pile up on board, the rocket will overload and likely crash.Comment: Here are the situations I guessed correctly, but past success doesn't guarantee anything in the future, so it's possible I'm wrong on this point. But the way up doesn't make sense to me right now, not in this way. I don't believe the market maker wouldn't go down first. It is as tempting to him as a sweet shop to a small child.Comment: I wondered what this cycle would look like without manipulation and without the use of trading bots that create fake trades (some exchanges have fake trade volume of up to 95%). Is the moment approaching when most bots will receive a SELL command? We'll see.Comment: Watch out for a bear hug on Monday so it's not your last :) Only a valid close above the short zone can change the situation.Comment: The Apollo 1 rocket overloaded and lost the important flight level of 19600, the next flight level is 18000, there I assume that there will be an effort to gain altitude back up, but if the attempt fails and it will fall below. Houston we have a problem.Comment:Comment: The Apollo 1 rocket has dropped below another flight level of 18,000 and here it has trouble regaining altitude because it is already in the atmosphere where there are dust particles of sand and sand is not good in a rocket engine.Comment: The Apollo 1 rocket is still having trouble breaking out of the sandy atmosphere. A repeated fakeout is possible, but it would be embarrassing from the market maker. I believe many bulls would still be enticed, but repeating the joke is no longer funny.Comment: I recently uploaded a Tesla graph here, so let's see how it follows the route. From the beginning of the route, the Tesla should have covered -50%, it almost reached the target -46%, but I think it will only charge the battery a little and finish the journey down.Comment: I posted this fakeout alert on October 29th, it was playing well. I currently see the possibility of a descending triangle. If a market maker looks at their order books and sees a lot of short positions, there may be a smaller draw to liquidate them before going down.Comment: The market maker activated his popular 6% bait.Comment: I added another short zone, we'll see if it goes as easily as last time or if the market maker is preparing a surprise for us here.Comment:Comment:Comment:Comment:Comment: Whenever the rocket left the BTC hourglass atmosphere, it was only for distribution purposes. It was always enough to enter a short and the success rate was 100%. There will be a moment when the rocket leaves the clock permanently and takes off, but I'm not sure it will be this moment, I can also imagine a false start and subsequent crash about the R.V.Comment: Tesla is slowly reaching its target. From the point I determined in September, right now -50%.Comment: The touch is over, the market maker is currently looking for shocking news for the market, or he will have to make it himself and then use it as a trigger for the dump.Comment: The Apollo I rocket is still preparing to fly to the 10K region. The whales rescheduled their Apollo 7 flight for the simple reason that there are still many traders who are hungrily buying every dip and running DCA at 50K, 40K, 30K, 20K and other nonsense... so they have to wait until the retailers are out of money and then hit the real bottom where the whales buy and we patient. FOMO must be suppressed at the ATH, but also on the way down.Comment: In February I created an idea called (Bull Trap on BTC ?). Playing well so far, history repeats itself. Here I created an idea - Bull Trap on BTC in 2025? It is likely to happen, the market is made by people and people do not change.Comment: One of the ways whales could get fuel for their Apollo 7 rocket.Comment: It's possible that I'm already too bearish, but I don't like traps. First I'll see if the bulls stay alive.Comment: I see that the market is absurdly bullish again. It is currently under resistance, yes, the line is not a wall, but so far there has been no crossing and, above all, no valid closing above, so it is not entirely reasonable to enter at this point. As a reminder, I'll re-upload similar situations where the market was ridiculously greed.Comment: BTC is currently testing its golden vein, if it is rejected it would finally go to the final bottom. It would be about time.Comment: The market was set to go down, realistically it would currently be in the 13700 area, but the whales stepped in and liquidated the short positions. This market is funny, one person or a small number of individuals who have a lot of capital can win over the rest of the market. The green candle, which subsequently formed only due to the liquidation of short positions, acts as a magnet and subsequently absorbed a lot of moonboys due to FOMO. But it's FOMO pushed too far against market belief, so nothing healthy and I don't know if it's sustainable. He is currently in the danger zone, so nothing is decided. I don't know how this liquidation of short positions and then trying to trigger FOMO will play out, if it turns into a bear market rally, it is possible. But I am still convinced that the real bottom will come later. And these green candles only confirm it to me, because if it still looks bearish and only goes down, it is very easy to wait to buy, but few people can stand such growth anymore and jump in. And the bottom is not for everyone, the vast majority have to lose for the minority to take such large and meaningless percentage increases that are in the crypt. Moonboys think money grows on trees in crypto, but crypto doesn't produce any money. If you have a profit, someone on the other side had a loss.Comment: For a few more days, the moonboys will provide liquidity to the whales to make the distribution. After the 18K support is broken and then confirmed as resistance, I expect a return to the original trend.Comment:Comment: Be careful here and don't succumb to FOMO because there isn't a reason to be yet. BTC is in a dangerous area where rejection may occur soon or a bit higher. If there is a valid breakout above and you close above it, it makes sense to look at it again. But right now, all it takes is one bad news and the market collapses like a house of cards.Comment: Bulls should be more bullish here, it is necessary to break above resistance and then break above 25K to open the way to 30K. If the market maker sees weakness, he will use the hammer. This eventual rally is quite uncertain for me, so I will patiently wait below for a rejection here, at 25K and or above. There is a good chance it will come back, and if it doesn't, I can live with not being a BTC shrimp.Comment: Many bulls are already calling for a new bull run, but I think such a call is ridiculous and very premature. So far nothing bullish has happened, according to history there has always been growth before a crash. It stands to reason that if you need to get liquidity for distribution, you need to convince traders that we are going up. I even think that in the next bullrun, BTC will not cross its ATH for the first time in history, because if it were to reach the 100K area, surely everyone would want to take at least some of that profit there and that is not possible, the whales need the opposite side of the buyer at that time. There is a possibility that many short positions will accumulate below the ATH and the subsequent liquidation will move higher. In any case, one doesn't have to be a super analyst to see how the performance is constantly decreasing as the global market cap increases, it is getting harder and harder to achieve the same performance as in previous years. This may change if a major event occurs in the future. But be careful and don't invest more than you can afford to lose.Comment: Just my opinion so don't cancel your Lambo reservations and do your own analysis.Comment: If a miracle happens and Jesus Christ gives life to this cat and she subsequently overcomes this resistance (and especially a valid closure, because the amount of fakeouts is ridiculous), then maybe I will become bullish. I think it will be more realistic to come to the funeral later.Comment:Comment: When returning to the risk zone +10% to bounce and create right shoulder. You can try to catch it and put a stop loss, there is always a possibility if a head and shoulders form and many traders see this pattern, then again the market maker can liquidate the short positions and move a bit higher. My guess is that the right shoulder is more likely to take more bulls on board and then point it down.Comment: The bulls tried to break through the border for 7 days, but the bears defended it. The bulls are retreating further from the border to the safety of USDT (although calling USDT a safety is probably bold). Right now there is a potential formation of right shoulder (head and shoulders inverted pattern). If this pattern is not invalidated and especially if the lower trend line is still valid, I will be on the side of the bears.Comment: BTC is only retesting the trend line, which I previously identified as important and decisive for me. Be aware of the possibility of a rapid decline when rejected (watch out for the fakeout above). I understand that traders are excited to go up after such a period of decline, but that's exactly why it's dangerous. Few people caught the upward movement in January from the bottom, so when it soon starts to fall to lower levels, traders will buy it, because they don't want to let the opportunity slip away again, and this will be an opportunity for market makers to move deeper and deeper, because long positions will be liquidated. Or I'm wrong and it's already going to the moon, as a lot of other ideas here have already pointed out.Comment: Observing market practices, I'm glad that I didn't end up selling my car and kidney, and didn't buy BTC just because it broken some ridiculous trend line that the market maker prepared for you there.Comment:Comment: BTC has broken back below its real value and is now trying to get above, on rejection I expect the blow of phase to continue. I still consider it a manipulation on the part of exchange offices. To initiate trading interest and provide liquidity for subsequent distribution. Exchanges logically need fees from purchases and sales, and they like it best when people sell at a loss.Comment: No method works 100% but this one worked pretty well for me, we'll see if it works again. I was always three steps ahead of this slump. There is currently an option to play the pennat pattern. Bearish on BTC and Bullish on USDT.D. Playing out the pattern makes sense to me because they let people buy and go long over the weekend and they can dump it in the following hours, the target is the demand zone.Comment: Bears, don't give up yet, hope dies last :)Comment:Comment: For a minute it starts to rise exactly where I expected. It looks like the bears will protect it if today's daily candle closes above support.Comment: As I watch the BTC pumping, I am reminded of an idea from September 13th. Will the situation repeat itself? Probably yes. Calling it pumping is a bit of an exaggeration if the market maker lowers the price in advance and then returns it to the same level. For how many traders probably the previous decline activated a stop loss and how many preferred to sell at a loss. Subsequently, the bottom did not let him into the demand zone because there would be a lot of buying, then he pumps the bearish pattern quickly up and people buy something at the top again, then you flush them. BTC has been in this range for almost 300 days, it's a playing field that the market maker is completely in control of. In that time at this range I have already heard 1000x bull run calls on every small pump. I don't even want to imagine how much money was transferred from traders into the hands of the market maker and how many dreams of getting rich quick were extinguished. I can't predict what will happen, even if it breaks above the range, it will pump higher within a few hours, so most people will miss the move and then create another range to distribute there. A bull run will not be triggered from this range. Just my opinion.Comment: Regardless of the bulls getting higher than I expected, I still haven't changed my mind about this bear market rally. The month of May is approaching, there is quite a risk that the whales will take the profit and swim off to enjoy the warm waters of the Caribbean. Pensioners are already talking about a guaranteed bounce from the 25K area and a continuation of the uptrend while waiting in line at the supermarket, so I remain skeptical of this rally. If it goes down in the next few months, I will focus on the area of the previous low. If we are there before September, I can imagine that the double bottom will attract a lot of bulls, then the big players can send it under and the subsequent activation of the stop loss could cause a drop to the 9-12K area. This rally is a climb against the direction of the sand, and the sand will eventually reach the bottom. Why should this happen? Because they can do it, who's to stop them? I'm watching the Tesla chart, which has similar market behavior to BTC.Comment:Comment: Short positions are accumulating on the exchanges, so a false price increase can be expected before the start of a decline, but no manipulation is sustainable in the long term.Comment: Looks like USDT.D is ready to go up and send the crypto down.
Cardano

ADA 330 desteğinin kırılması ve direnç olarak onaylanmasının ardından, bir kartal saldırısı ve yuvaya doğru devam etmesini bekliyorum. Yalnızca direncin üzerinde bir kapanış geçerliyse bu fikri geçersiz kılabilir. Yorum: ADA çok erken kısa pozisyon açmak isteyen ve 0,330'un altına geri dönüş için beklemeyen yatırımcılarla iyi oynadı. Avınız için bir kartal gibi sabırla beklemelisiniz. Trend çizgisinin altına olası bir geri dönüşü bekleyin. Yorum: Kartal, 0,330 alanı kırılırsa ve direnç olarak onaylanırsa, bir saldırı gelebilir. Yorum: Benim fikrim düşüş yönünde, ancak boğaların gerçekten güce sahip olduğunu ve bunun sadece bir boğa tuzağı olmadığını görürsem fikrimi değiştirebilirim. Çünkü trend çizgisini kırıp sonra test etmek boğa piyasasıdır ve boğaların uzun pozisyon açması için bir davettir, ancak mevcut piyasada boğa tuzağı için de uygun bir yerdir.Yorum: Şu anda ADA grafiğinde zayıflık görüyorum, boğalar kırılmayı başaramadı. Direncin reddedildiğini ve şu anda alt trend çizgisinin altında bir kırılma görüyorum. Bu sadece ayılar için bir gösteriyse ve boğalar bir kez daha kırılmaya çalışırsa, ihtimal dışı bırakılamaz. Ancak kırılma olmazsa ve yukarıda geçerli bir kapanış olursa, o zaman hiçbir şey değişmez. Düşmeye devam ederse, muhtemelen iki ay içinde yeni bir düşük seviyeye ulaşabilir. Aşağıda yuvarlak bir dip hayal edebiliyorum.Yorum: ADA 0,330'u kırmaya çalışıyor. Bunu şimdiden kırın, kartal yiyecek bekliyor ve birçok yatırımcı aşağıda çantalarını doldurmak istiyor.Yorum: ADA düşüş devam etmeden önce küçük bir geri çekilmenin meydana gelebileceği bir noktaya ulaştı. Eğer doğrudan kırılırsa bu da olabilir.Yorum: Kartal saldırdı.Yorum: Önceki fikirde burada daha küçük bir sıçrama bekliyordum, oldu. Ama hala ayı tarafındayız, bu yüzden burada tehlikeli bir oyun.Yorum: ADA plana sadık kalıyor, şimdiye kadar düşüş eğilimi devam ediyor gibi görünüyor. Mavi çizginin üzerine geri dönmek bu fikri geçici olarak geçersiz kılacaktır.Yorum: Bence ADA'nın bir sonraki boğa piyasasına kadar hala çok zamanı var, muhtemelen şu anda döngünün bu aşamasında. Daha uzun bir konsolidasyondan geçmesi gerekiyor. x10 ADA yükselirse, en azından orada biraz kar elde edin veya tekrar aşağı inmesini izleyin.Yorum:Yorum: ADA ilk destekte bile durmadı ve hemen ikinci, makul satış dalgasını kırdı.Yorum: Haberleri görmezden gelin, aslında grafik SEC tarafından herhangi bir suçlama kamuoyuna açıklanmadan çok önce bu hareket için ayarlanmıştı. Bu sadece hareketin tetikleyicisi ve piyasanın bunun neden gerçekleştiğine dair gerekçesi. Yükselmek için doğru zaman geldiğinde, rastgele olumlu haberler olacak (Cardano bir anlaşmazlığı kazandı, suçlama durduruldu veya buna benzer bir şey). Haberleri takip etmenin bir anlamı yok, bilmeniz gereken her şey grafikte.Yorum: Bence, ADA hala dibi inşa ediyor, şu anda yolun ortasında bir yerde. Büyümenin bir yüzdesini yakalamaya çalışıyorsanız sorun yok, ancak Cardano'i daha uzun bir süre tutmak istiyorsanız, yine de daha iyi fiyatların geleceğini düşünüyorum. Bazen daha iyi bir fikir edinmek için bir tersine dönüş grafiğine bakmak yardımcı olur. Ters bir grafik olmasaydı, muhtemelen güçlü bir yukarı çıkış görürdünüz ve geri çekilmeden sonra uzun pozisyon almak isterdiniz.Yorum: Bu alana dikkat edin, altcoin'leri temizleyebilir, gidip tekrar 400B'yi test edebilir, ancak 100 gündür test yapıldığı için mantıklı değil.Yorum: ADA beklediğim geri çekilmeyi yaptı, şu anda direnci aşıyor ve kan pompalamak istiyor. Ticaret tavsiyesi yok, sadece dibe doğru olası bir yol haritası çiziyorum.Yorum:Yorum: ADA muhtemelen bir ayı bayrağını test ediyor. Ticarette bunu önemsemiyorum, dipten alıyorum veya yanılıyorsam sarı çizgiyi test ettikten sonra almayı tercih ediyorum, altındaki her şey düşüş eğiliminde ve orada her şey olabilir. Her durumda, kumar oynamayı seviyorsanız, satın alabilirsiniz, belki tekrar yukarı fırlar, ancak muhtemelen nerede satacağınızı bilemezsiniz, bu yüzden tekrar düşersiniz.
Sorumluluk Reddi
Sahmeto'nun web sitesinde ve resmi iletişim kanallarında yer alan herhangi bir içerik ve materyal, kişisel görüşlerin ve analizlerin bir derlemesidir ve bağlayıcı değildir. Borsa ve kripto para piyasasına alım, satım, giriş veya çıkış için herhangi bir tavsiye oluşturmazlar. Ayrıca, web sitesinde ve kanallarda yer alan tüm haberler ve analizler, yalnızca resmi ve gayri resmi yerli ve yabancı kaynaklardan yeniden yayınlanan bilgilerdir ve söz konusu içeriğin kullanıcılarının materyallerin orijinalliğini ve doğruluğunu takip etmekten ve sağlamaktan sorumlu olduğu açıktır. Bu nedenle, sorumluluk reddedilirken, sermaye piyasası ve kripto para piyasasındaki herhangi bir karar verme, eylem ve olası kar ve zarar sorumluluğunun yatırımcıya ait olduğu beyan edilir.