
trade-God
@t_trade-God

Ne tavsiye etmek istersiniz?
önceki makale
پیام های تریدر
filtre
trade-God
A Tolled Bell
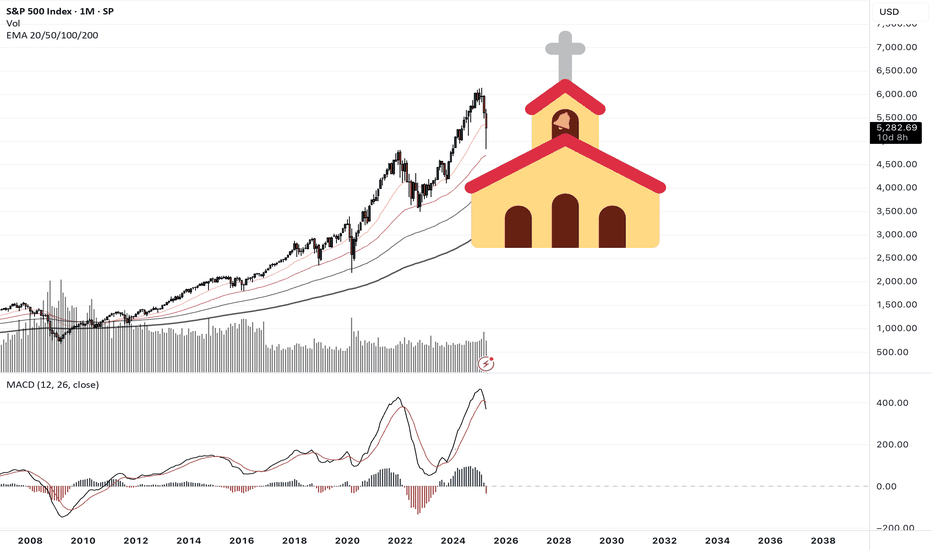
İlk çan çaldı. 6000 $ aralığında bir köprü döşeniyor. Eğer patlarsa, köprü inşa edilene ve duygu gelişene kadar muhtemelen olmaz. Birkaç içten çabanın 6.660 doların üzerinde çekim yapmasını bekleyin. Temel dava uzun vadeli yengeç pazarıdır.
trade-God
trade-God
Goldaholics Anonymous

Pour yourself a glass of Goldschläger and let's review the 12 steps before diving into this. 1. We admitted that we were powerless over the Fed -- that our balance sheet had become unmanageable. 2. Came to believe that a Power greater than our central bank could restore us to solvency. 3. Made a decision to turn our fiat over to the care of sound money, as we understood it. 4. Made a searching and fearless inventory of our finances. 5. Admitted to Peter Schiff, Lyn Alden, and Pomp the exact nature of our wrongs. 6. Were entirely ready to have big, fat Gains. 7. Humbly asked to avoid getting short squeezed. 8. Made a list of all the naysayers about to be harmed. 9. Sent direct messages to them to gloat in victory. 10. Continued to count our gains and polish our bullion. 11. Sought through fundamental and technical analysis to improve our entries and exits. 12. Having had a financial awakening as the result of these steps, we tried to carry this message to other goldaholics, and practice these principles in all of our trades. Macro Fibonacci Below we can see the magic of Fibonacci extensions, measuring the last macro bull run to the 2016 low. Zooming in a bit, it is clear that these levels attract attention. Each one of these fibs acts as a step in the staircase. All we need to do is look at volume and price action to validate each level. The smart money had their sell orders at the 0.618 Fibonacci extension. The 0.5 could not hold which indicates that the next level down will be tested. Watch for heavy volume to come in there near the 0.382 level. In the U.S. stock market and many other developed financial markets, about 70-80 percent of overall trading volume is generated through algorithmic trading. Historical Price Action Looking back to the last bull run there are a few simple patterns to watch for... 1. Weekly MACD flailing around above the zero level. 2. Mark the down trends and wait for the break. 3. Price action is above the 20 Week EMA. Trading Setup Using historical price action the trading setup becomes clear... 1. Weekly MACD is flailing above the zero level. 2. The down trend line is clear. Wait for the break. 3. Wait for 20 Week EMA support. Now, the targets are the Fibonacci levels above, and the ghost bars look reasonable, however, it would be wise to take a look at what exactly is driving Gold on this path. The U.S. Dollar The Dollar index inversely pressures Gold prices so this is worth noting. 1. Momentum is shifting bullish as a bullish MACD divergence reveals itself on the daily chart. 2. This recent move was the 3rd wave down which often precedes a reversal. 3. The index is at the bottom of this future channel. As this index recovers back towards the 200 Week EMA, it will surely scare the metals market. However, the macro downtrend is only on it's first wave down. From a technical standpoint, the second wave is often the deepest as panic sets in from the failed recovery. Treasury Yields Yields recently had a similar bullish MACD divergence with a very weak recovery that followed. The trend is still clear and it's highly likely to roll over as it timidly approaches the trendline in the coming months. Gold has been riding along side Bonds so this should continue to drive up prices. Depending on the severity of falling yields, it could trigger temporary crashes in the metals. But longer term, buying the dips is the way to go. Trading is risky. Don't do it. Long Bullion: Gold, Silver, Platinum Equities: GDX, PHYS, CEF, SLV, RIO, SPPP Futures: (Not yet)Comment: 1. The daily MACD has crossed above zero... 2. The price action is supported, for now, above the fib level... 3. Sort of broke the down trend... If there is a break higher it could be time to buy... BUT the DXY is still poised for a rally so caution is important. Stay tuned.Trade active: I like buying dips in Gold futures now that price has stabilized above resistance with the daily MACD above zero... I'll be using the 4hr chart, the 50 EMA, and the RSI set at 10. RSI is now near the bottom of the range and price is supported by the 50 EMA +1 @ 1921Comment: Gold price is right at the 200 day EMA so could be a bounce here. The problem is DXY looks like it could make that reversal so I'll set a stop loss on Gold below that 200 day EMA. In that case I would take a short term loss and just wait to get in at a better price.Comment: I'm going to play this by holding through this sell off and buying more if there's a bounce at the next fib level. But to hedge my losses, I'll look to short oil if this DXY rally continues to demolish the markets.Comment: Still coasting above the main trendline. I think downside is limited but will remain cautious about adding here to a leveraged futures position. However, I am still accumulating a core position in gold/silver/metal equities like PHYS, CEF, SLV, RIO.Comment: Once it gets back above that fib level (again) I'd expect a short squeeze.Trade active: Frankly, gold has been such a pain in the ass. I'm slightly net red from last years big win and this years big loss. Long @ 1734 on the August contract. Trusting the fib gods on this one.Comment: Fib bounce, good. Above the 50 EMA, good. 1,800 almost hit, almost good. Probably will be a messy journey but the 0.5 fib is where I'd consider selling this long.Comment: Taking a step back on the weekly view, the MACD is showing momentum is much stronger now than in the last few attempts to break trend. The downside risk is there but the upside looks much bigger but could take a while if there's a pullback from here. Another reason why I grabbed the December(z) contract on this one.Comment: Gold prices are now approaching the target 0.5 fib extension. I'm up about $1,400 on this position but took a big fat L on the last dips. As of now I've broken even on Gold futures YTD. This setup looks to be the beginning of a larger move so I'm just going to hold it through in case of a squeeze up to $2000 happens sooner rather than later.Comment: Momentum hasn't even kicked in yet.Comment: Gold is forming a very similar pattern as the previous top in, price and the MACD. If history does repeat, the place to cut positions is where the MACD dips below 0 and price breaks the trendline.Comment: next resistances and then longer term top.
trade-God
Bitconacci

Bazı içgörüler sonuç verdi, hepsi değil. Bununla birlikte, kırmızı yol üstte ve altta ölüydü. Sarhoş çılgınlık, berbat bir tepe tarafından koptu. Aylık MACD momentum yükselişinin ağırlığı, fiyatın 12 EMA'nın altına doğru kaymasıyla da desteklendi. Bunlar sinyallerdi. Bu sinyaller artık tersine döndü. Momentum dengede. 12 EMA ters döndü. Ne bekleniyor, daha düşük fiyatlar ve daha yüksek fiyatlar? Beklenmedik derecede büyük bir tırmanışa dönüşen uzun bir durgunluğa ne dersiniz? Bu analizin nedenleri var, one henüz kimsenin radarında olmayan yeni bir kavram. Öncelikle haftalık MACD'nin kısa bir nefes almaya ihtiyacı var gibi görünüyor. Ancak daha ilginç olanı Mavi ile işaretlenmiş Fibonacci zaman dizisidir. btc oluşumu, 2009'dan beri sıralanan döngüler.
trade-God
The House

Bitcoin Blackjack oyununda eve karşı sembolik bir oyundur, dolayısıyla 21 milyon sınır. Oyuncu yakında coşkusuna rağmen oranların ona karşı istiflendiğini bulur Yığıya baktığınızda, momentum göstergelerinden başka bir şey bulursunuz. A. Bir pazarın lazer gözleri yaratmak için ne kadar öforik olması gerekir? 2. veya bir ülkenin başkanı içeri giriyor ve kazanmış gibi kutluyor 3. Medya, web'in her köşesinde reklamlarla tam patlamaya dikkat edin 4. "Zengin olacağım" duygusu K. Doge Bu son olmasa bile, genel olarak kripto üzerine bir not. Tüm bunların ademi merkeziyetten yararlanan merkezileştirme olduğu açıktır. Çoğunluk gerçekten insanların tamamen sansürsüz ve kendilerinden sorumlu olduğu platformlar istiyor mu? Yoksa evin yararlı olanı emmesi ve gerisini ölü için bırakması daha mantıklı mı? Son bir düşünce ve belki de en önemlisi olarak. Marketcomment'ın neredeyse her köşesindeki varlık kabarcıklarının ortasında 2009 yılında başlayan bitcoin saga tümünün tamamını unutmayın: Bu konuda biraz daha genişlemek için. Hala bazı bitcoin var ve teknoloji sağlam, bu yüzden olası değil Bitcoin ölüyor. Soru daha çok pazar döngüsünde nerede olduğumuz ve fiyatın nerede olduğu tam olarak nedir. Üst potansiyel riskten daha büyüktür. Teknikler Teknik olarak beşinci bir dalgada. Başlangıçta önceki yazılardaki FIB analizim 123 bin dolara işaret etti, bu henüz eğilimi kırmadığı için hala olabilir. Ancak bu ters potansiyel, bu döngü başladığında 11 bin dolardan elde edilen kazancı göz önünde bulundurarak pek bir şey değil. Aşağıdaki FIB seviyesi satın almak daha çekici olacaktır. Psikoloji Önceki makalelerde pazar döngülerinin duyguları ve aşamaları hakkında yazdım. Sosyal medyayı takip ederseniz insanların tam olarak nerede olduğunu hissedebilirsiniz. Yenilmezlik duygusu var. Bu 1 btc = 1 btc Yani fiyat önemli değil. Alıştılar ve herhangi bir şeyden 1'ine göre toplam saçmalık = 1 herhangi bir şey 1. Gizlilik Aşaması: Bilinmeyen Birikimi 2. Farkındalık aşaması: Kurumsal yatırımcılar potansiyel görmeye başlar 3. Mania fazı: yutturmak için medya enjeksiyonları. 4. Dökme: kar alma Stratejiler Kaynakları olan biri fırsat bulduğunda, onu en üst düzeye çıkarmak için çaba sarf edilir. Tether doğar ve super düşük faiz oranlarının ardından ve hiçbir düzenlemenin yanında bu yeni varlıktan yararlanmak için başka hangi programların bilen. Giriş fiyatı biriktirir. Para yutturmacayı kovalar. Bir Kongre üyesi avatarlarına lazer gözleri ekler. Şirketler ve Ülkeler Yolo In.Comment: Bitcoin 12 aylık EMA'nın altına düşmedi, o ema'dan düşmeden yaklaşık% 50-68 Bu, aşağı yönlü risk hedefini 21KComment'e koyar: Yorum:
Sorumluluk Reddi
Sahmeto'nun web sitesinde ve resmi iletişim kanallarında yer alan herhangi bir içerik ve materyal, kişisel görüşlerin ve analizlerin bir derlemesidir ve bağlayıcı değildir. Borsa ve kripto para piyasasına alım, satım, giriş veya çıkış için herhangi bir tavsiye oluşturmazlar. Ayrıca, web sitesinde ve kanallarda yer alan tüm haberler ve analizler, yalnızca resmi ve gayri resmi yerli ve yabancı kaynaklardan yeniden yayınlanan bilgilerdir ve söz konusu içeriğin kullanıcılarının materyallerin orijinalliğini ve doğruluğunu takip etmekten ve sağlamaktan sorumlu olduğu açıktır. Bu nedenle, sorumluluk reddedilirken, sermaye piyasası ve kripto para piyasasındaki herhangi bir karar verme, eylem ve olası kar ve zarar sorumluluğunun yatırımcıya ait olduğu beyan edilir.