
Thief_Trader
@t_Thief_Trader

Ne tavsiye etmek istersiniz?
önceki makale
پیام های تریدر
filtre
Thief_Trader
"ORDI/USDT: Pirate’s Treasure Trade! Bullish & Loaded"
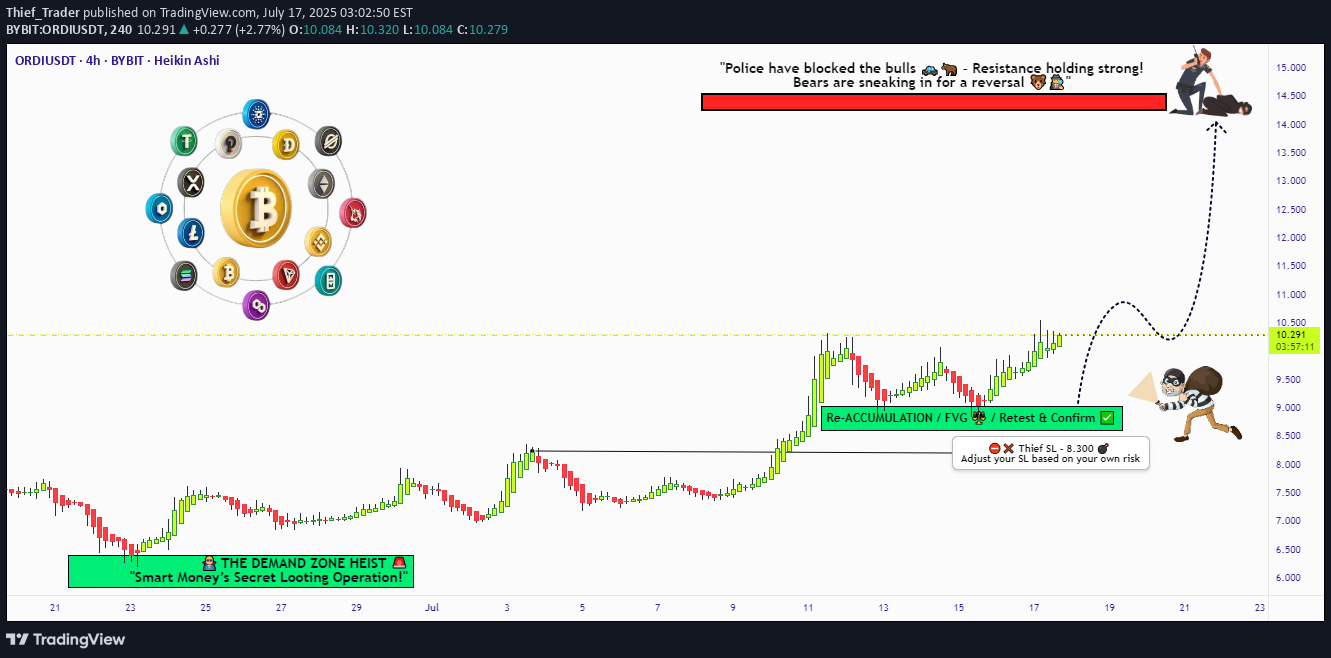
🚨 ordi/usdt heist uyarısı! 🚨 ordi/usdt yükseliş baskın planı (hırsız ticaret stili) 💰🎯 🌟 Dikkat piyasası korsanları ve kârlı akıncılar! 🌟 🔥 Hırsız ticaret stratejisi etkinleştirildi! 🔥 📌 Görev Özeti: Elit Hırsız Ticaret Analizimize (Teknik + Temel Heist Intel) dayanarak, Ordi/USDT'de bir yükseliş soygunu planlıyoruz. Hedefimiz? "Polis barikat" (ayı tuzakları ve geri dönüşler) başlamadan önce yüksek riskli direniş bölgesine yakın yağma karları! 🚨 Ticaret kurulumu (gün/salıncak soygun planı): Giriş (📈): "Kasa açık! PRO İPUCU: Daha güvenli geri çekilme girişleri için 15m/30m salıncak alçaklarına yakın alım sınırlarını kullanın. Gelişmiş Hırsız Hareketi: Maksimum Stealth için Çoklu DCA Limit Siparişleri Katman. Durdur kaybı (🛑): 8.300 (en yakın 4H mum gövdesi düşük). Risk toleransınıza ve lot boyutunuza göre ayarlayın! Hedef (🎯): 14.400 (veya piyasa riskli olursa erken kaç!). ⚡ Scalper’ın hızlı yağma kılavuzu: Sadece kafa derisi uzun! Zengin Hırsızlar? All-in! Hırsızları kırdı mı? Salıncak tüccarlarına katılın ve planı yavaşça uygulayın. Kârları kilitlemek ve güvenli bir şekilde kaçmak için sondaki SL'yi kullanın! 💎 Neden Ordi/USDT? (Temel Heist Intel) ✅ Oyunda yükseliş ivme! ✅ Makro trendler ve intermarket sinyalleri tersine döndü! ✅ Haber güdümlü volatilite? Büyük hamleler bekleyin! ⚠️ Uyarı: pazar polisleri (haber etkinlikleri) ileride! Yüksek etkili haberler sırasında yeni işlemlerden kaçının! Arka duraklar = en iyi kaçış aracınız! 💥 Bu soygunu artırın! 👉 Hit Soygun ekibimizi güçlendirmek için beğen ve takip edin! Daha kazançlı soygunlar yakında geliyor! 🚀💰 🎯 Son not: Bu finansal tavsiye değil - sadece bir hırsızın master planı! Risk ve stratejinize göre ayarlayın! 🔥 Baskın yapmaya hazır mısınız? Biraz kar çalalım! 🏴☠️💸 👇 Bir yorum bırakın ve planı artırın! 👇 (🔔 Bir sonraki soygun için bizi izlemeye devam edin!) 🚀🤫
Thief_Trader
BTC/USDT Heist Mode: Buy Low, Escape Rich
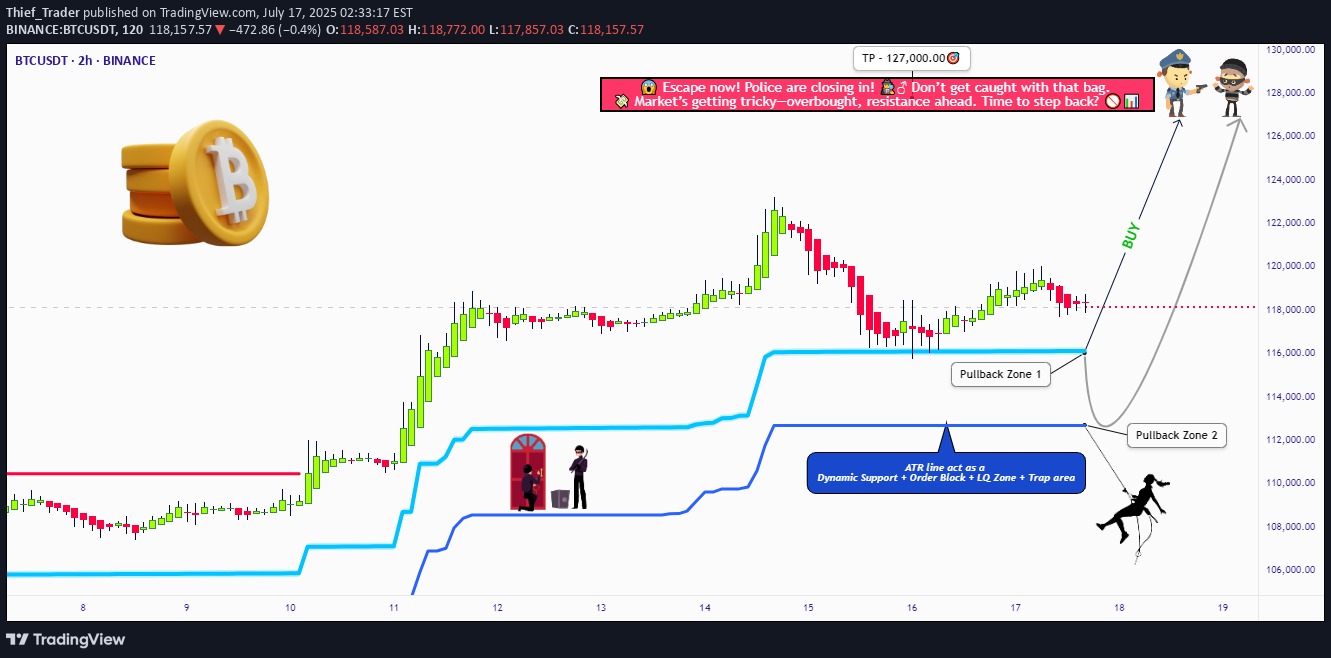
🏴☠️ "Bitcoin vs Tether" Kripto Pazarı Soygun Blueprint 🔥 | Hırsız Ticaret Stili (Salıncak/Gün Planı) 🌍 Hey para üreticileri, grafik bilgisayar korsanları ve küresel soyguncular! 💰🤑💸 Oyundaki en sevdiğiniz hırsızın yeni soygun planına hoş geldiniz - bu sefer listelerde sorunsuz bir suçlu gibi "Bitcoin vs Tether" kripto pazarını hedefliyor. 🎯📊 Bu sizin ortalama teknik analiziniz değil - Hırsız Ticaret Stili ™, Derin Teknik + Temel Analiz, Pazar Psikolojisi ve Raw Trader içgüdülerine dayanan stratejik bir soygun. 💼 Kurulum - Soygun için hazırlanın 🎯 Yüksek riskli, yüksek ödüllü bir direniş bölgesinin yakınındaki yüksek değerli tonozlara girmeye başlamak için bir yükseliş operasyonuna bakıyoruz-dikkatli olun, profesyonel satıcıların ve düşüş soyguncularının pusu kurdukları yüksek voltajlı bir tuzak alanı. ⚡🔌 Bu plan, kontrollü riskli maksimum karı hedefleyen katmanlı bir DCA tarzı giriş içerir. Grafik alarmları açık, zihniyet hazır. 🧠📈🔔 🟢 Giriş: "Soygun başlar" 📍 Bölge-1 Satın Al: MA Returback'ten Sonra 116200.00 Yakın 📍 Bölge-2 satın alma: 112600,00 daha derin geri çekilme 🛠️ Giriş Stili: Sınır Siparişleri + DCA Katmanlama MA MA Crossover onaylarını ve fiyat reaksiyon bölgelerini bekleyin - kovalamayın, pazarı yakalamayın. 🔻 Kaybı durdurun: "Kaçış rotasını planlayın" ⛔ Petracback-1 için SL: 113000.00 (2H salıncak düşük) ⛔ Geri çekilme-2 için SL: 110000.00 📌 SL yerleşimi pozisyon boyutlandırma ve risk yönetiminize bağlıdır. Kaybı kontrol etmek; Başka bir gün soymak için yaşa. 🎭💼 🎯 Hedef Bölge: "Nakit Out Point" 💸 İlk TP: 127000.00 Momentum Momentum izin veriyorsa kâr yolculuğuna izin verin. Kazançları kilitlemek için lehinize hareket ettikten sonra takip eden bir SL kullanın. 👀 STRALPERS NOT: Sadece uzun tarafı oynayın. Sermayeniz ağırsa, erken hamleler yapın. Işıksanız, çeteyle sallayın. Boğa treninde kalın ve tuzakları kısaltmaktan kaçının. Sıkı sonucu SL kullanın. 🔎 soygunun arkasındaki hikaye - neden boğa? "Bitcoin vs Tether": 💹 Teknik sıçrama major Destek 🌏 Makroekonomik ve jeopolitik duygu 📰 Cilt + Duygu Değişimi (Risk-On) 📈 Çapraz pazar endeksi onayı 🧠 Akıllı tüccarlar tepki vermiyor, hazırlanıyor. Sürünün önünde kalın. 👉 Daha derin içgörü için şu adrese bakın: ✅ Makro raporları ✅ COT Data ✅ Market arası korelasyonlar ✅ Çin'e özgü endeks görünümleri Risk Risk Uyarısı - Ticaret Etkinlikleri ve Oynaklık 🗓️ Haber sürümleri hissi hızlı bir şekilde çevirebilir - tavsiye ediyoruz: ❌ Yüksek etkili olaylar sırasında yeni pozisyonlardan kaçının 🔁 Karı korumak için sondaki SL'leri kullanın 🔔 Her zaman pozisyon boyutlandırmasını yönetin ve akıllıca uyarılar ❤️ Mürettebatı Destek | Planı artırmak Bu analizi seviyor musun? Takıma güç sağlamak için bu destek düğmesini parçalayın. Hırsız ekibine katılın ve efsaneler gibi ticaret yapın - akıllı çal, keskin ticaret yapın. 💥💪💰 Piyasadaki her gün yeni bir soygun fırsatı var - eğer bir planınız varsa. Daha fazla wild soygun planları için bizi izlemeye devam edin. 📌 Bu finansal tavsiye değil. Kendi sorumluluğunuzda ticaret yapın. Kişisel stratejinize ve sermayenize göre ayarlayın. Piyasa koşulları hızlı bir şekilde gelişir - güncel kalın, uyanık kalın.
Thief_Trader
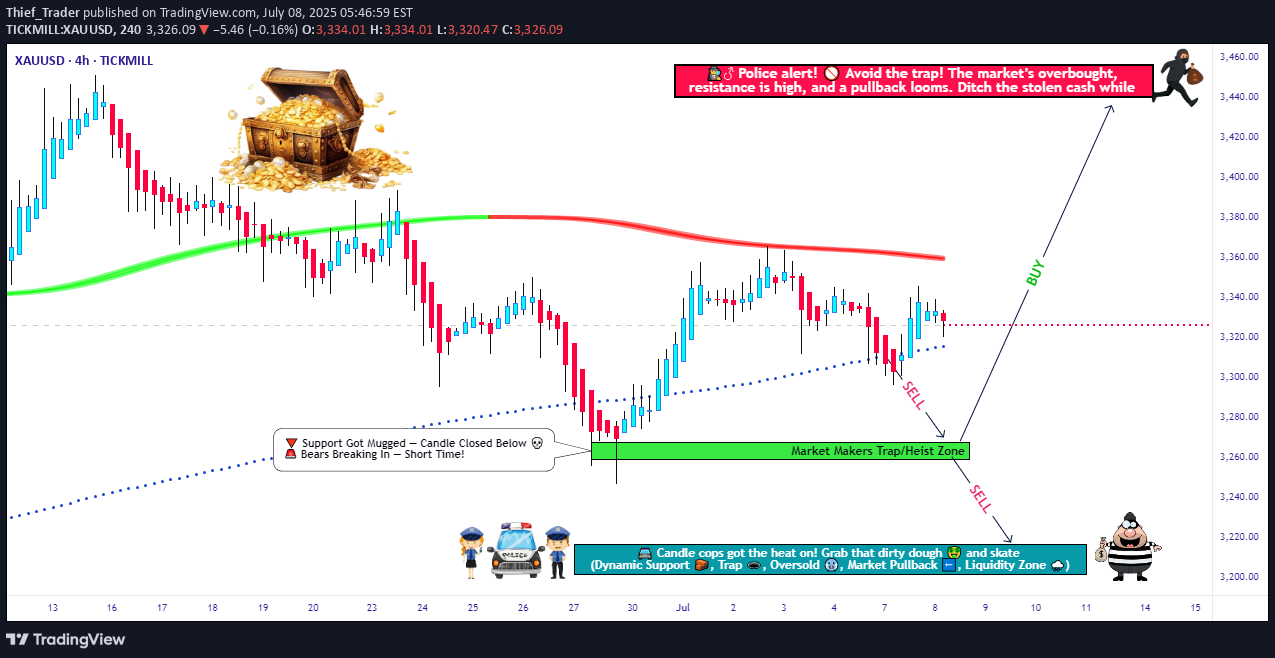
GOLD (XAU/USD) MA Breakout – High-Probability Long Setup!
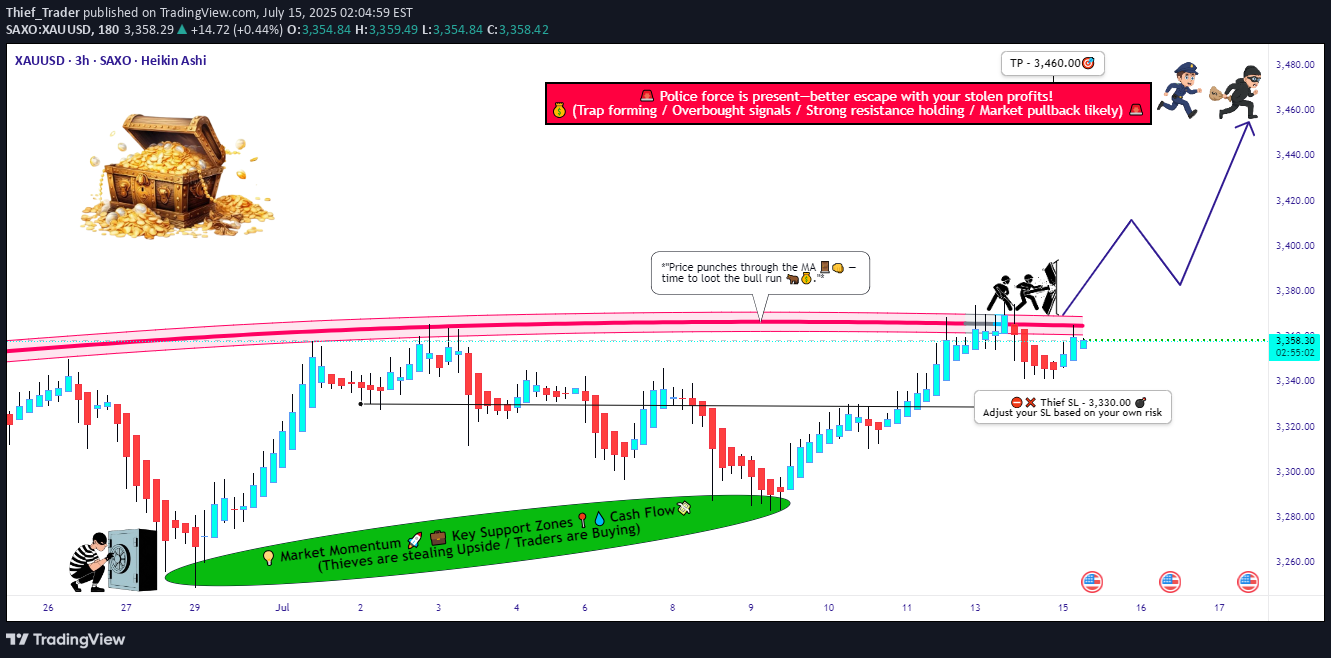
💰🚨 Altın hile uyarısı! XAU/USD Master Plan (Hırsız Ticaret Stili) 🎯 PRI PRI PRO-Yüksek Olumlu Altın Kırma Stratejisi gibi çalın! 🔥 🎯 Hırsız Ticareti’nin Altın Hoist Stratejisi (Swing/Gün Ticareti) �💸 👋 Hey orada, Piyasa Korsanları ve Kâr Gerçileri! 🌍✨ 🔥Thief Ticaret Stili 🔥 analizimize dayanarak, XAU/USD (GOLD) üzerinde major soygun çiziyoruz. Plan? Kırılmayı satın alın, polisler (direnç) gelmeden kaçın! 🚔💨 📈 Giriş bölgesi: soygun başlar! 🚀 "MA Breakout'u bekleyin (3400) - sonra vur!" Boğa Onayı: MA kırılmasından sonra 15m/30m geri çekilme. Hırsızın Hilesi: En iyi risk-ödül için Swing Lows'a yakın bir Limit satın alın. DCA/Katmanlama Stratejisi: Kazançları en üst düzeye çıkarmak için birden fazla sınır siparişi dağıtın. 🔔 Bir uyarı ayarlayın! Breakout'u kaçırmayın - Hırsızlar hızlı hareket eder! ⏳ 🛑 Kaybı Durdur: Ganimetinizi koruyun! 📍 Hırsızın SL yerleşimi: 3330.00 (4H salıncak düşük) - Risk ve lot boyutunuza göre ayarlayın. ⚠️ Uyarı: Buy Stop kullanıyorsanız, gereksiz kayıpları sevmediğiniz sürece, koparma sonrasına kadar SL ayarlamayın! 🔥 🎯 Hedef: Altın ile kaç! 🏴☠️ Kâr Bölgesi Alın: 3460.00 (veya ayılar ortaya çıkıyorsa erken çıkın!) Scalpers: Sadece ticaret uzun tarafı - kar kilitlemek için sondaki SL kullanın. Swing Tüccarları: Dalgayı sürün ama direniş tuzaklarına dikkat edin! 📰 Pazar Bağlamı: Neden bu soygun? Nötr eğilim (ancak yükseliş potansiyeli! 🐂) Anahtar faktörler: jeopolitik, karyola verileri, makro eğilimler, duygu kayması 🚨 Haber Uyarısı: Yüksek etkili haberler sırasında yeni işlemlerden kaçının-Sonrası SL kardan tasarruf sağlar! 💥 Bu soygunu artırın! (Daha fazla pip için paylaşın ve paylaşın!) 💖 Hit Hırsız ticaret ekibimizi güçlendirmek için 👍 Boost Düğmesi! 🚀 Yakında daha fazla soygun planı geliyor - bizi izlemeye devam edin! ⚠️ Feragatname (güvende kalın, hırsızlar!) Bu finansal tavsiye değil. Kendi analizinizi yapın ve riski yönetin. Piyasalar hızlı değişir! Uyum yapın veya yakalanın. 🎯 Mutlu ticaret, korsanlar! Biraz altın çalalım! 🏴☠️💛
Thief_Trader
ETH/USD Setup | Thief Trading Blueprint for Profit.
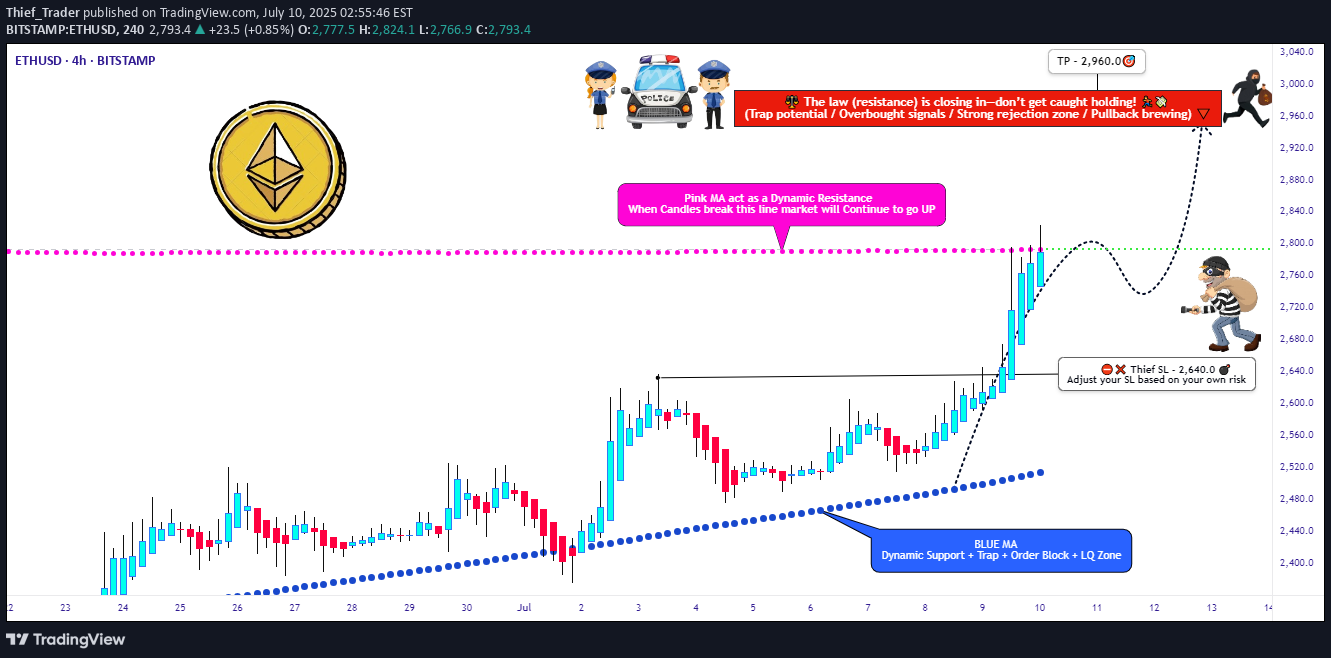
🔥🚨 ETHEREUM soygun planı: Maksimum Kazanç Modu için Hırsız tarzı ticaret planı: etkinleştirilmiş | Bulls'u soyma zamanı 💰📢🌍 Merhaba para yapıcılar, kripto dolandırıcıları ve grafik kıran haydutlar! Deep Derin Teknik ve Temel Intel üzerine inşa edilmiş yüksek bahisli, yüksek ödüllü bir kripto pazarı planı olan “Hırsız Ticaret Stili” arızasına gelin. Bu sizin ortalama stratejiniz değil… ETH/USD pazarında tam bir soygun! 🧠 Master Plan (ETH/USD-Day ve Swing Ticaret) 🔎 Hırsız modu analizimize dayanarak-pazar hissi, trend psikolojisi ve fiyat eylemi-Ethereum yükseliş soygunu için olgunlaşmıştır. Yüksek riskli likidite tuzaklarında dükkan kuruyoruz ve düşüş aşırı güvenini hedefliyoruz. 💥🟢 Uzun: Swipe Boğa momentumunda. Daha fazla katman, ganimet kaybı - "Hırsız Kuralı: Yakalanmayın: Yakalanmayın" 📍 1H Zaman Çarşamba Yüksek/Düşüklerde SL'leri Lot Boyutuna Göre Ayarlayın ve Kaç Giriş Smart, Smarter! Piyasa gölgeli dönmeye başlar (ters işaretler görünmeden çıkış) ⚔️Scalper'ın kodu-"Sadece hızlı eller!" Ön koşu hareketli çantalar? Swing tüccarlarıyla birlikte takım oluşturun ve planı takip edin. UYARI - "Soyguncular Sürprizlerden Nefret" 📛 major haber sürümleri sırasında yeni girişler 📈 📛 📛 📛 📛 📛 Haber sürümleri sırasında, kârda kilitlenecek şekilde durma kayıplarını kullanın ⛔ Volatilite dönemleri sırasında yönetilmez pozisyonları terk etmeyin? O zaman çeteyi artırın! 🎯 🔥 Boost düğmesini 🔥 ve hırsız ticaret stili için desteği gösterin! Daha fazla artış, daha fazla plan düşer - pazarı yasal olarak soyan bir akıllı tüccar topluluk oluşturalım (😉). Bu analizi sadece eğitim amaçları içindir - finansal tavsiyelerde değil. Gözleri bağlı. Yük. Ganimet. 🐱👤🤑💰
Thief_Trader
SHIB INU Heist Plan | Layered Buy Limits + SL Strategy
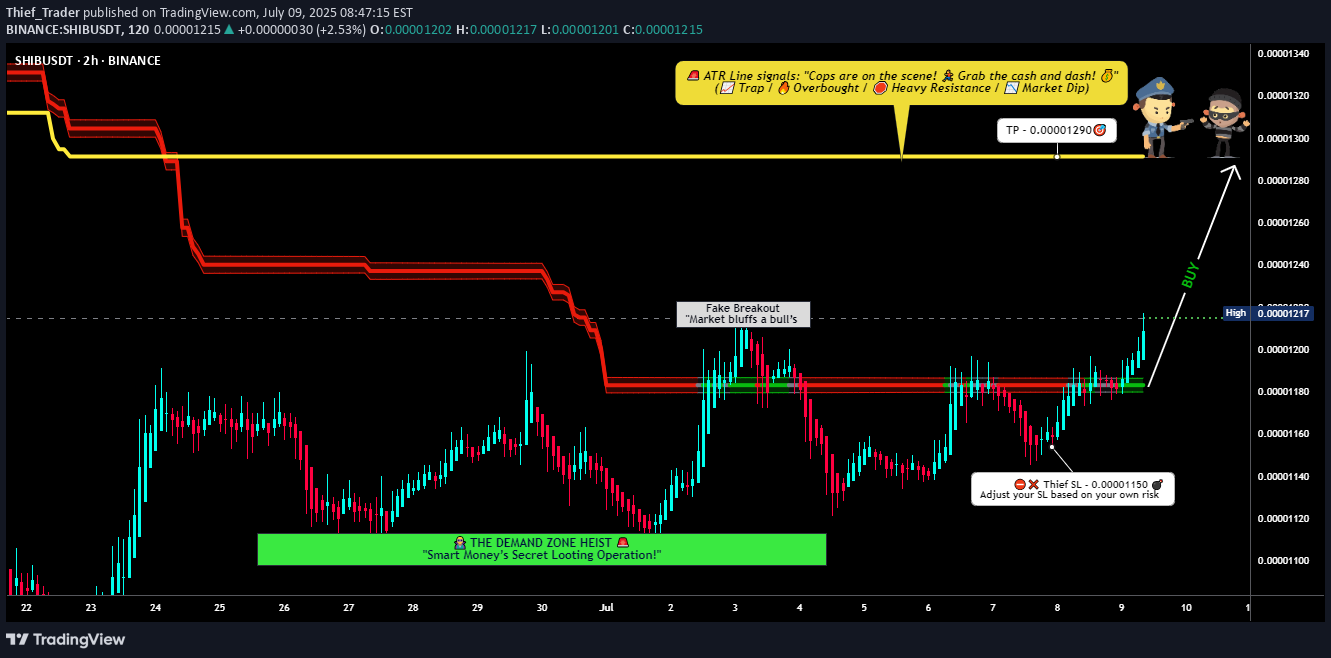
🏴☠️💸 ** Shib soygun planı: Boğaları soyun, ayıdan daha fazla | Hırsız ticaret stili stratejisi (salıncak/kafa derisi) ** 💸🏴☠️🌍ola! Merhaba! MARHABA! Bonjour! Ola! Hallo! 🌍💰 Tüm piyasa korsanları, kâr arayanlar ve sessiz hırsızlar ... kasa açıktır! 💰 Bu, kötü şöhretli "hırsız ticaret stili" na dayanan Shib/USD (Shiba Inu) için özel bir pazar görevidir - stil ile gizlice, kar elde etmek ve kaybolmak için tasarlanmış bir yöntem. Baharatlı teknik, temel, zincir ve duygu analizinin baharatlı bir kombinasyonu ile bu strateji, hem salıncak hem de geçişli bölgelere sızmaya ve kazançlarla kaçmaya hazır olan gündüz tüccarları için hazırlanmıştır. 🎯 Soygun Planı: Piyasa yapımcılarının sık sık tüccarları çektiği ve tüccarların atr polis tuzağı bölgesinde gözlerimizle yüksek riskli, yüksek ödüllü bir kırılma. Odak noktamız? Konsolidasyonun sona erdiği, sahteler başladığı ve gerçek geri dönüşlerin başladığı tatlı nokta. ⚠️🐍📥Entry (the-in-in): "Kasanın kilidi açıldı!" Salıncak alçaklarında veya destek bölgelerindeki satın alma limit siparişlerini kullanmaya gizlice girer-geri çekilmek için 15m veya 30m grafik için ob. 📊💼🔎 Giriş Bölgesi: Yapı Düşüklerine Yakın Piyasa veya Sınır - Kesin Olun, Açgözlü Değil.🛑stop Kaybı (Kaçış Kapak): Kaçış sinyaliniz olarak 0.00001150 civarında düşük kullanın. SL'yi takip eder ve soygun daha ısındıkça karları ölçeklendirir. Büyük bir sermaye torbası yapıyorsanız, daha önce atlayın; Değilse, salıncak ekibiyle birlikte sürün. 🚁💸📊Thief Temel Yakıt: SHIB Boğa momentumu, makro duygu değişimleri, pazar rotasyonu, balina birikimi ve zincir üstü hacim flow nedeniyle artmaktadır. Torbalarınızı yüklemeden önce ilgili makro raporları, intermarket içgörüleri ve kripto gelebilirlikleri kontrol edin. 🧠📈🔗🛎 sheist uyarıları - Stay Safe!: 🚨 major haber bültenleri sırasında oynaklık patlayabilir. Yakalanmayın! ❌ Haberler sırasında yeni girişlerden kaçının ✅ Mevcut pozisyonlarda kazançları kilitlemek için takip duraklarını kullanın 💖 Bu planı buluyor musunuz? Mürettebatı destekleyin: Hırsız ticaret ekibini canlı tutmak ve planlamak için buton butonunu basılı tutuyoruz! Düzenli olarak taze soygun planlarını bırakıyoruz - sevgiyi yaymamıza, mürettebatı büyütmemize ve karları gürültüden çalmaya devam etmemize yardımcı oluyoruz. 🚀📌Disclaimer: Bu analiz sadece eğitim amaçlıdır - finansal tavsiye değil. Her zaman dyor ve kişisel risk profilinize göre ayarlayın. Piyasaları aşalım - bir seferde biri ticaret. #ThiefTradingStyle #Shibheist #CryptOstrategy #marketROBBERY #SmartMoneyMoves
Thief_Trader
PEPE/USD Market Heist: Thief Entry Plan for Big Gains
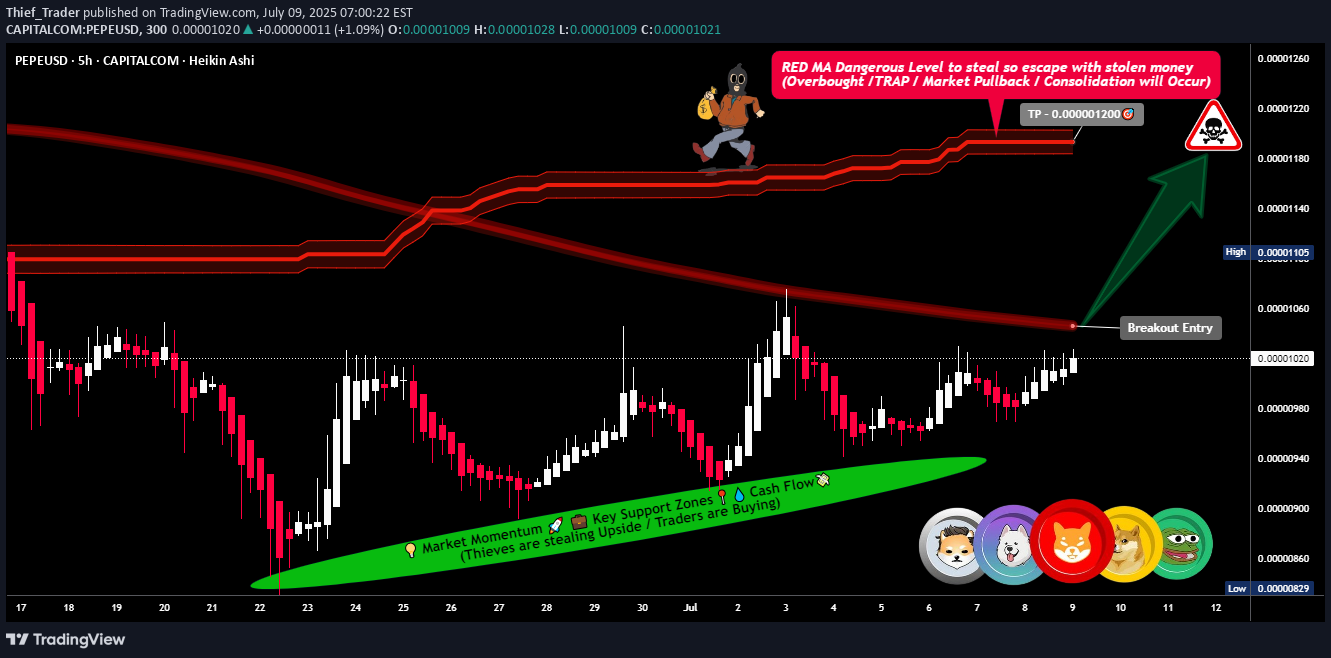
🔥🚨 Wall Street'in Hırsızları: Pepe/USD kripto soygun planı 🚨🔥 Wall Street'in bile kıskanacağı nihai “hırsız stili” ticaret kurulumu-piyasa kanun kaçakları için yüksek riskli, yüksek ödüllü bir oyun kitabı —🌍 merhaba küresel para kapmak! Hola | Ola | Bonjour | Hallo | Marhaba | Namaste, akıllı isyancıların fiyatı kovalamadığı, onu yakalarlar, soyar ve karla kaçarlar. MISION: PEPE/USD PAZARI SICAKLIK 🎯 Amaç: Büyük ayıların uyuduğu Pepe/USD kripto bölgesine sızın - ve çoğu tüccarın panik ve çıktığı tehlike bölgesinde uzun süre vurun. Ticaret Kurulumu: The Weist Blueprintmarket: Pepe/USDPlay: Uzun Giriş (Hırsız tarzı tersine taktik) Bölge: Kırmızı-sıcak direnç döndü (kar tuzağı bölgesi bölgesi) 🧨 Giriş Stratejisi: Red Kırılma için Bekleyin Red Taultalı Ortalama Duvarı 0.00001060'da Tatma Planları: Sinyaliniz açıktır. Deploy 15 dakikalık/30 dakikalık salıncak alçaklarında veya konsolidasyon tuzaklarında sınır siparişleri satın al. DCA/Katmanlı Giriş Stili Kullanın-Gerçek bir hırsız gibi, asla bir kerede gitmezsiniz. Fırsatlar üzerinde asla uyumaz! Bu SL - çok erken yakalanmayın.Risk yönetimi kaçış aracınızdır. Hedefler: Birincil Çıkış: 0.00001200 Earda Çıkış: Isı açıksa, çantayı alın ve kaybolun. 🏃♂️💨 Ara yollarınızı ganimetinizi korumak için SL'nizi izleyin. 💡 Scapping & Swing Heist İpuçları: Selamlar: Sadece uzun süren waves. Ters göstergeler macro ekonomik kurulumlartermarket synerget oyunculuk yapmadan önce onaylarınız-Kör değil, akıllıca soyuyoruz. Kaos demlerken karınızı güvence altına almak için sonda SL kullanın. Sneaky Sneaky, akıllı kalın - bu kumar oynamıyor, organize pazar Krimee (akıllı tür). 🎭💰 Sonraki soygun yakında geliyor - daha fazla soygun planını takip edin! 💣💼
Thief_Trader
"GOLD Bandit Strategy: Loot Pips Like a Pro!
🏆 Altın hile uyarısı! 🏆 XAU/USD Bandit Stratejisi (Swing/Gün Ticaret) PRIPLERİN PRO GİBİ ÇIKARIN! 💰🔓 Bull vs. Bear Raid Plan 🌟 Selamlar, Piyasa Korsanları! 🌟 "Eğilim suç ortağınız - yağma zamanı!" 🔮 Hırsızın Teknik ve Temel Intel: XAU/USD (Altın Kasası) Yanıp Squaling Sefing Sinyalleri, ancak her iki tarafa da baskın yapmaya hazırız! Aşağıdaki soygun planını takip edin 👇🎯 enry puanları (nereye vurulacak!) 🏴☠️ Uzun baskın (Boğa Hırsızları): Break & Grab: 3450.00 (geri çekilme bölgesi) "Bekleme, sonra pusu!" 🐻 Kısa Baskı (Bearish Bandits): Sneak Saldırısı 1: Destek Saldırısı 2: Destek Saldırısı 2: Satın Alın: Destek Saldırısı 2: Satın Alın: Destek Saldırısı 2: Destek Saldırı 2: SATILMA SATIŞ 2: SATILDI 3300. Rotalar) Boğa Ticareti: SL 3230.00 (Ganimetinizi koruyun!) Ayı ticareti 1: SL 3360.00'da (yakalanmayın!) SL SL 3280.00 (Risk = Ödül!) (Düzeltme!) (Ayarlayın!) 💰 Take-PROFIT (Nakit Çıktı ve Kaçma!) Boğullar: TP!) Boğuk hırsızlar: TP!) TP 3270.00 Bearish Bandits (2): 3210.00'da TP (büyük puan!) ⚠️ Uyarı: Piyasa Tuzakları! Haberler = Tehlike Bölgesi! 📢 Yüksek etkili haberler sırasında yeni işlemlerden kaçının. Kilit karları ve kaçınma tersine çevriler. 💥 Korsan ekibimizi güçlendirmek için benzeri ve paylaşın! 🚀 Daha fazla uyarı = daha fazla kâr! 🚨 Sonraki soygun yakında… Bizi izlemeye devam edin! 🚨
Thief_Trader
"XRP/USD: Bullish Raid Alert! Ride or Escape Fast!"
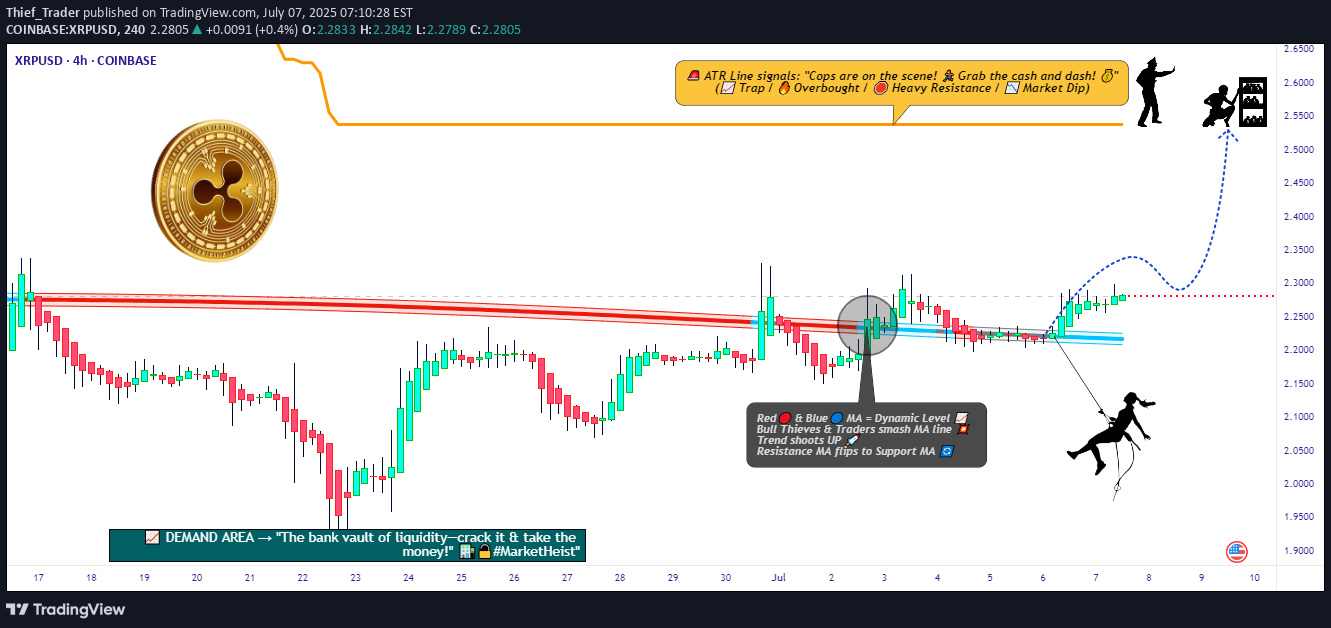
🚨 XRP/USD soygun uyarı: Kaçıştan önce yükseliş ganimet kapmak! (Hırsız Ticaret Stili) 🚨🌟 Selamlar, Piyasa Korsanları ve Kârlı Akıncılar! 🌟 (hola! Acımasız Teknik + Temel Analize Alınan, XRP/USD'den (Ripple vs. Dolar) ganimet nasıl SWIPE. Grafiğin uzun giriş planını takip edin-hedefimiz yüksek riskli sarı ATR bölgesidir (aşırı alım, konsolidasyon, potansiyel tersine dönme). Tuzaklara dikkat edin! Ayılar ve polisler burada gizleniyor, ama biz akıllıca vuruyoruz. Swipe anında - sadece polislere (likidite tuzakları). 🛑 Kaybı durdurun (ganimetinizi kaydedin!): Salıncak Hırsızları: 4h son fitil düşük (2.1500 $). Risk taktikleri: SL'yi ticaret boyutunuza, siparişlerinize ve bağırsaklarınıza göre ayarlayın: Ana Takım: 2,5400 $ 'a göre (2,5400 $ (veya momentum faşları: Longs. SL'nizi izleyin-açgözlü tutucular! 💣 Anahtar sürücüler (neden bu soygun çalışıyor): yükseliş momentum bira (klick'in önündeki zincirde data 👉Go kontrolü, klick 🔗 'nin önünde). plan. Birlikte, piyasanın parasını - her zaman çalıyoruz. BEKAR. Day.📢 Son Uyarı: Piyasalar hızlı değişir. Polisler gelmeden önce keskin kalın, uyarlayın ve nakit para çıkarın. 🤑 Bizi izlemeye devam edin - daha fazla soygun gelen! 🐱👤🚀
Thief_Trader
"Solana Heist in Progress! Will the Breakout Hold or Fake Out?"
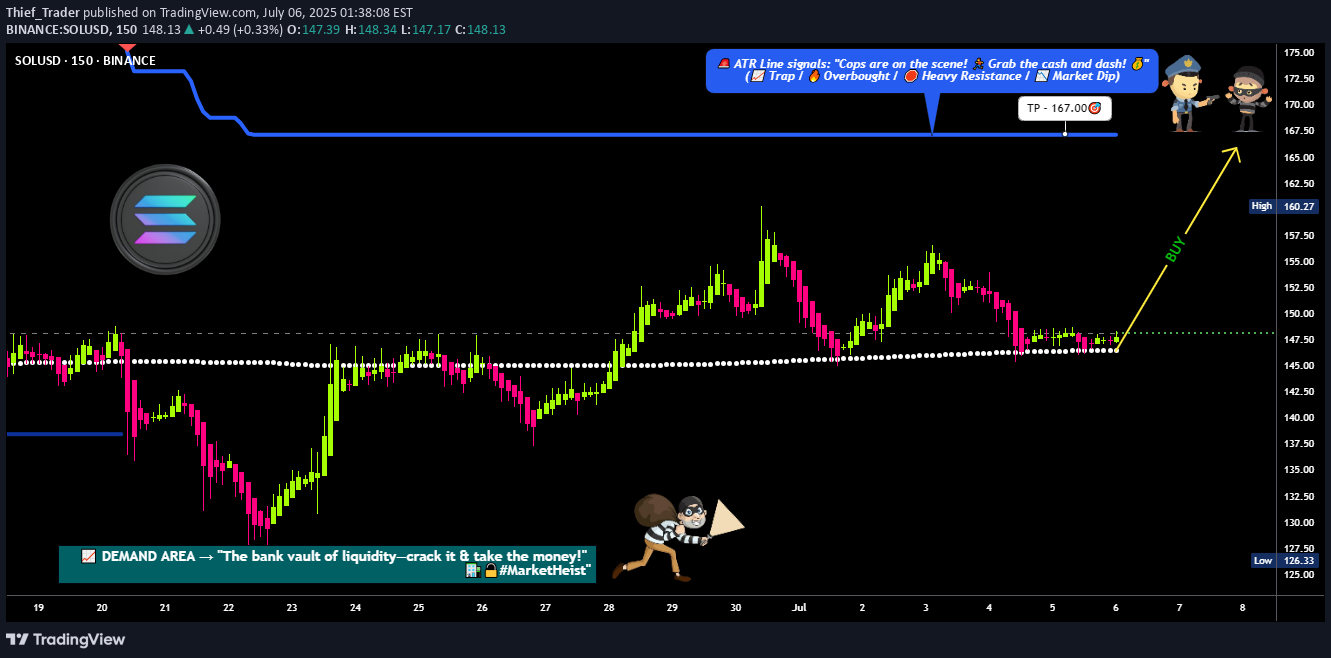
🔥🚨 "SOLANA heist uyarısı: Ultimate Boğa baskın planı (koparma veya sahte?)" 🚨🔥🌍👋 Selamlar, Piyasa Korsanları ve Kâr Haydutları! (İngilizce, İspanyolca, Portekizli, Fransızca, Almanca, Arapça-Hırsız Ticaret Stili temel alan strateji 💎 (Yüksek Risk, Yüksek Ödül-Misyonu/Yatırma Misyonu/Yatırma Stratejisi (1). Dolar) kripto heist🐂 yönü: Uzun (ama tuzakları izleyin-yakındaki koparlar ve ayılar gizleniyor!) 🚀 Kaçış Bölgesi: ATR hattı (yüksek riskli kar alma alanı) ⚠ood uyarı: fazla alım? Tersine dönme? Direnişte polis hattı? Kârları Erken Alın! 📈 Giriş: "Breakout soygunu başlar!" Tetikleyici: 148.50 (mA) Alternatif Girişin üzerinde Mum'u bekleyin: MA'nın üstünde durak satın alın veya geri çekilmede limit satın alın (15m-30m TF) 🛎< Bir Uyarma ayarlayın! Breakout'u kaçırmayın - hırsızlar hızlı bir şekilde vurun. "Yakalanmayın!" Hırsız SL: 136.00 (2H önceki yapı düşük salınım) (risk ve lot boyutunuza göre ayarlayın!) ⚠️ Uyarı: Mine değil, benim değil, benim değil, "ganimet ve sıçrama!" 🎯 167.00 (ya da daha erken kaçmak için uzun sürer!) Kazançlar! 📢 Haber ve Risk Uyarısı 🚨 Yüksek etkili haberler sırasında yeni işlemlerden kaçının! (Oynaklık soygunları öldürür. 🔒 Piyasa dönerse karları korumak için takip duraklarını kullanın. 💥 Bu soygunu artırın! (Daha fazla artış = daha fazla kar baskını!) 👉 ✅ | Takip 🚀 | Paylaş 🔄💬 Giyinme - Bullish veya Bearish Tuzak?
Thief_Trader
BTC/USD Heist Mode: Buy Low, Escape Rich
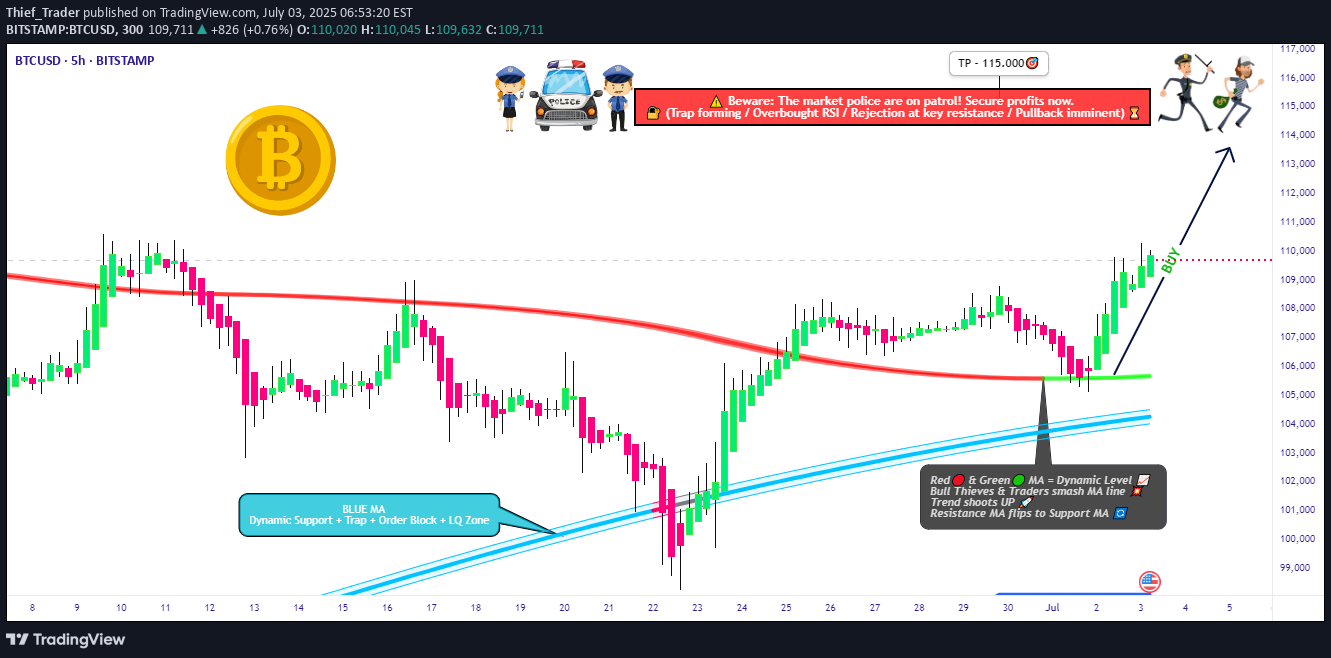
🔓 BTC/USD Kripto Kasası İhlali: Uzun Giriş Soygunu için Hırsız Stratejisi (Salıncak/Gün Kurulumu) 🔓🌟HI! ! Ola! Bonjour! Hallo! MARHABA! Teknik hassasiyet ve makro düzeyde bir içgörü kullanarak, karlı bir soygun için uzun bir giriş planını çiziyoruz. Mevcut fiyatla veya Set Swing düşük (15-30 dakikalık zaman dilimi geri çekilme girişleri) satın alım sınırını ayarlayın. Girişte Girlilikle-Panik üzerinden yatkınlık ile zamanlıyoruz. 🛑 Son Salıncak Düşük (4H TF Referans: ~ 104.000) yakınında ayarlanan kayıp kurulumları durduruyoruz. Pozisyon boyutlandırması, risk iştahı ve çoklu sipariş taktiklerine göre ayarlayın. İçeri gir, çık. Verimlilik koddur. Çantanız ağırsa, anında vurun. Işık ise, salıncak soyguncularıyla sürün. Çantanızı korumak için sondaki SL'leri kullanın. Neden Bullishmarket Momentum Bulls'u destekliyor: Flipkey'e hazırlıklı tuzaklar olarak hareket eden aşırı alımlı bölgeler, Duygu, COT, Zincir ve Makro Analizi Mevcut Destekleme Mevcut 👉👉🔗🔗.📢 Risk Notu-Keskin Not-Artan Volatilite Haberler Sırasında Kalın. Trail, koşu karını korumak için durur. Rob Smart.💖 Bu planın görevinizle uyumlu, hit Bu destek düğmesini artırın. Ekibi besliyor ve birlikte pros gibi kâr ediyoruz. Her seferinde bir soygun. 💪🎉🧠 Hazır kalın - yakında plan düşüyor. O zamana kadar Rob Safe, Rob Smart. 🐱👤
Sorumluluk Reddi
Sahmeto'nun web sitesinde ve resmi iletişim kanallarında yer alan herhangi bir içerik ve materyal, kişisel görüşlerin ve analizlerin bir derlemesidir ve bağlayıcı değildir. Borsa ve kripto para piyasasına alım, satım, giriş veya çıkış için herhangi bir tavsiye oluşturmazlar. Ayrıca, web sitesinde ve kanallarda yer alan tüm haberler ve analizler, yalnızca resmi ve gayri resmi yerli ve yabancı kaynaklardan yeniden yayınlanan bilgilerdir ve söz konusu içeriğin kullanıcılarının materyallerin orijinalliğini ve doğruluğunu takip etmekten ve sağlamaktan sorumlu olduğu açıktır. Bu nedenle, sorumluluk reddedilirken, sermaye piyasası ve kripto para piyasasındaki herhangi bir karar verme, eylem ve olası kar ve zarar sorumluluğunun yatırımcıya ait olduğu beyan edilir.