
NoOneWhoIsSomeone
@t_NoOneWhoIsSomeone

Ne tavsiye etmek istersiniz?
önceki makale
پیام های تریدر
filtre
NoOneWhoIsSomeone

Throughout history, one can always look back and categorize a period of time such as "The Great War", "The Great Depression", "The Progressive Era", "The Gilded Age", etc. We humans do not think of the present in such terms because everything feels as it is. There is no cognitive thought that can pinpoint that we are in a historical period until we reach what is known as hindsight. A pivotal point of reflection on the past that enlightens in a way that was not previously possible. This exact dynamic is why historical data and charts are so important in not necessarily predicting the future, but by considering a calculated perception not possible without this information. So, let's use this information to our advantage. Here are just a few historical facts: ~No bear market in history ended before the recession ~No bear market in history ended with the Fed raising rates ~No bear market in history ended before the true Fed pivot ~No bear market persistent inversion was NOT followed by a recession (US10Y-US02Y has been inverted since July) & (US10Y-US03M inverted in October). President Biden last week touted, "The US economy is expanding, and income has increased faster than inflation". Okay well, two things: First, here is a simple but impactful fact; Since the start of this year, Stock Market losses have wiped $9 Trillion from Americans' wealth cnbc.com/2022/09/27/stock-market-losses-wipe-out-9-trillion-from-americans-wealth-.html Second, if wages are growing faster than inflation (Inflation grew exponentially in comparison to the last 40 years), then why is the data showing an immense gap between Labor costs & Corporate profits? epi.org/blog/corporate-profits-have-contributed-disproportionately-to-inflation-how-should-policymakers-respond/ Its best to see the data for yourself, but here is a snippet: Corporate profits- (2020 Q2-2021 Q4= 53.9%) & (1979-2019= 11.4%) Unit Labor Cost- (2020 Q2-2021 Q4= 7.9%) & (1979-2019= 61.8%) That is roughly a 155% difference in the WRONG direction. (Unit Labor Cost) This exact same dynamic was the main reason for the Great Depression to have happened in the first place. Corporation profits grew larger while Labor Wages vastly lagged behind. It not only led to a complete collapse of industrial spending but would condemn the economy to almost a decade of misery and mediocrity. Let's move on to arguably the most important part of the post which is the FED's preferred Recession Indicator. (US10Y-US3M). It has finally flashed a Recession warning as it has inverted for the 4th time since 2000. Each time this has happened there has been a Recession that followed. Pair this with the Energy crisis across the world which has also marked very valid Recession signals: It is also well known that the housing market holds the majority of individual wealth so let's take a peek at where it stands: This chart from a technical perspective almost guarantees a local top after housing prices soared by almost 27% following the 2020 recovery. Take a look at the RSI paired with rapid acceleration to the upside. What follows is pretty clear, at least locally. Interestingly enough, a FED Pivot/Inflation Peaking is amongst the most popular narratives being passed along and at face value it makes sense, but once you dive deeper the matter makes anything but sense. Let me explain: Here is Inflation overlayed with the FEDS Fund Rate: As you can see, not only was the FED late to the party regarding policy to fight inflation (possibly intentional due to exponential debt) but it also wasn't until Interest Rates matched the Level of Inflation was when Inflation truly peaked. This has not been met today. Furthermore, let's see what happens once the FED pivots and begins decreasing rates again: Again, if you notice when the FED began to decrease rates, the market did NOT act the way the public is expecting it to react today. It is a counterintuitive proposition because it is positive that monetary policy is more favorable but WHY is the FED decreasing rates? Most likely because of economic weakness. If the FED is hiking confidently, this means the economy is still intact and able to hold the brunt of the impact. This dynamic is missed by a great majority of market participants. One thing I want to focus on in the last chart is the 40-year trend break of monetary policy. We see this break in all charts representing yields/rates in terms of governmental sectors. For example; Here is the US10Y: Breaking a 40-Year trend As well as the 30-Year Fixed Rate Mortgage does the exact same thing: This to me indicates we are in a historical transitional period. If this is in fact the case, this would mean we would be transitioning from the old trend to a new trend. Now let's think about what trend we have been in for the last 20 years minimum. Its been astronomical QE and endless money printing which has brought us to today. What's on the flip side of this coin?
NoOneWhoIsSomeone

This is going to be a very extensive post so it will take some time to fully grasp most of these concepts but I am going to try my best to explain my perspective of the current economic landscape and what implications certain factors can have going forward. First, let us look at the Original Chart in the post and explain it: As you can see I have laid out the Resistance and 3 different layers of support. One local support at ($3850) and Two long Term Supports at ($3400) & ($2850) respectively. Current Criteria: IF the price pushes past the current Resistance labeled in the chart , I expect more upside over the next few weeks to months as the market expands and ignores recession fears for now. Remember, in this scenario, markets can remain irrational FAR longer than you can remain solvent. IF the price rejects off of this Resistance , it highly suggests Local support will be tested and if that is lost then the two long-term supports will come into play. I have labeled why the price would make it there and where the sentiment would likely be in this scenario. Now let's try to understand the current Recession Delima and where we stand: Today we live in a world where the past isn't considered a measure. To be a historian today would mean you would be doubted by most, saying "This time is different", "Past performance is not indicative of future performance", "Dinosaurs didn't exist", Etc etc. Our perception of the world and the lives we live are constantly changing. This new digital Era has connected the world in ways never seen before in humanity. So inherently, the way we think, what we believe, and how we anticipate the future has changed and is ever-changing. So much so, that even the most basic understanding of an economy comes into question. Over the last week, we have seen the "Definition" of a Recession be explained in vastly different ways. To such an extent Wikipedia actually blocked any edits in relation to the actual definition. The White House has downplayed Recession fears repeatedly and we have heard Powell mention a "Strong economy" just about every time he has spoken. Let us ask ourselves this first; what were these same people saying before the snowball actually started to roll down the hill? "Inflation is transitory", "No Recession Risks". Today we find this guidance to be incredibly misleading and incorrect. "But no one could have predicted this".... Wrong. Many people saw the red flags and predicted the tailwind effects of these dynamics. Even if the ones in power ultimately know, they can never let us in on the "know". If you've ever run a company or led any kind of extensive group, there are information highways. Certain information goes to certain groups, while others are left in the dark. Think of us, the regular working-class individuals, as the group that's left in the dark. Governments are run on the base concept of the people do not know what's best for them so we created a system that we believe will lead to better decisions for the betterment of society. A real downside to this reality is that there will always be a communication deficiency between the Government and the People. This is where the strange Re-Definition of a Recession comes into play. A commonly accepted definition of a Recession is simply, Two or more Quarters of Negative GDP Prints. We have seen just that. Although this isn’t the end all be all definition, it is one check mark down. "Real gross domestic product (GDP) decreased at an annual rate of 0.9 percent in the second quarter of 2022, following a decrease of 1.6 percent in the first quarter. The smaller decrease in the second quarter primarily reflected an upturn in exports and a smaller decrease in federal government spending". bea.gov/data/gdp/gross-domestic-product But US President Biden rejected the idea that the U.S. is in a recession, and instead touted continued job growth, low unemployment, and growing investment from manufacturers. Sure these are valid reasons, but WHY is that the case? Is it from pure organic growth or is it coming after the complete shut down of an entire country for 2 years? To put the job growth into perspective, we aren't even back to 2020 Employment levels before Covid hit: tradingeconomics.com/united-states/employment-rate So to play their game, What exactly is the definitely of Job Growth or Strong Employment? You see, words and data can be very misleading. This is why, "Don't trust, but verify" is crucial to surviving in this world. If you're waiting on someone to give you a warning or for someone to give you the official green light on something, you'll hear about it after it's already too late. It is very likely if there is a true Recession coming, most officials won't claim it so until we are already about 25% into it. We may very well look back on today a year or two from now and think, "It was so obvious". Now that we have covered the psychological aspect of the situation, let us look at it objectively and with some charts. Here I will first show a comparison between 2000 and 2008: This shows the Price Action of both 2000 and 2008 leading up to the ultimate wipe-out of the economy. I have labeled the percentage (%) of Drawdowns relative to both the peak and the rejection off resistance. These percentages can prove important because it reflects a potentially pivotal point in which the market finds a new Fair Value. Now, if we look at our current position, you can see just how similar the Price Structure is. Price has seen a significant breakdown and then followed up with a retest of this support that has now turned resistance. I have labeled the same percentages as 2000 & 2008 just so the comparison can be made and why these levels are truly significant: We are currently seeing the retest of the lost support, which occurred both in 2000 and 2008 very similarly. Although it is not guaranteed to repeat, it is something significant to note nonetheless. Next lets look at the US10Y-US01Y which has been a signal for the last 6 Recessions, which occurs after there has been a significant Yield Inversion: (I have outlined each time we have seen the beginning of the inversion so what happens after can be perceived) If you look at the chart, you can see there has been a significant inversion after inverting for a very short time back in March. We haven’t seen an inversion of this caliber since 2000 and 2008. To further support this development, if you just look at the US10Y, you can see it has once again parabolically rallied from its sharpest drop to its strongest impulse up to reach the historical trend line: I have labeled what has occurred following this development, as well as showing SPX in relation. Pay attention to each RSI level as well. Okay? So What? You can also say there have been gains after an inversion occurred… Sure this is true, but ask yourself this, are you prepared, and do you have a well enough plan laid out to properly secure those profits when the time comes? You have to remember, timing is absolutely everything so while an Index may have a 10% rise overall if you didn’t buy the absolute bottom, that 10% would actually be more like 5% or 6% for you. Furthermore, unless you sell with the right timing, those profits are not secured. Let's lay out some quick math because this concept seems to be missed by quite a few. Let us say an index goes from 1,000 to 6,000 and generated a 500% return on your money. Great. So now why worry about just a correction when you are up 500% already? Well, here's a reason… A 50% correction from this level does NOT leave you with a 450% gain. Instead, a 50% correction subtracts 3,000 points, reducing that 500% gain to just 200%. Then the problem becomes of regaining those lost 3,000 points to recover lost profits or to cut and make sure that the last 200% profit is secured. Long story short, profits are not profits until you sell. End of story. These decisions could mean early retirement or no retirement. I know this is a really extended post but let's touch on just a few more things I deem very important. Let's take a look at the Dow Jones (DJI) and see where it stands: Here you will see a very similar approach in a few other charts below where I have labeled the Deviations from the original trend which marks a “Blow off the Top” type of event. Whenever the value is extended beyond usual terms, is when the chances of a significant reversal increase. It marked warnings for both 2000 and 2008. Next, let's look at an aspect of the Housing Market which would be the Average Sales Price of Homes sold in the US: As you can see I have once again labeled a possible Deviation. This along with the massive RSI Divergence building over a 40-year period, the “Safe Heaven” of the housing market may not be as bulletproof as most would believe. Furthermore, let's analyze the 30-Year Fixed Rate Mortgage Average in the US: We have seen the sharpest impulse in Fixed Mortgages since 1980 and a possible break of a 40-year downtrend. What exactly would that mean for new homeowners over the next 20 years? Moving on, let's look at the VIX and what it can mean for the market: A general rule of thumb is if using the VIX as a reference, you want to look for positions when VIX is at significant resistance (Or after a parabolic rise) and you want to exit positions/use caution when VIX is at support. This is very prevalent in thinking Medium/Long term. As you can see the VIX has been steadily trending upwards since February of 2018 and I have labeled other points in time for reference. Here’s a small reference to DXY which has had a historical rally in a time that no one really expected: As you can see there has been a breakout of very important resistance, and if DXY holds strength and investors continue to value the dollar in ways not consistent in the past, liquidity will remain dry in relation. Now, let's talk about USOIL which holds a significant % in CPI changes. If Oil/Energy continues to climb here over the next few months then so will CPI. If Oil falls below its deviation zone, then CPI will likely subside for some time before any significant changes. Here is a reference to see this deviation level with respect to the SPX: I have marked every time USOIL lost this level to see possible effects. This does not mean the "Inflation Peak" narrative is one of any substance. Inflation peaking will not inherently change anything as it will take most likely Years to get Inflation down to FED target of 2%. So the actual strain of inflation on most of society will remain even despite an inflation peak. In fact, If CPI prints at 0% every single month between now and December, we will still finish 2022 with 6.3% YoY inflation. Also, in 2000 and 2008, it wasn't until after USOIL lost its deviation zone is when the worst was seen in the economy. Remember again, all those that said Inflation is "Transitory", "Controlled", and "Peaking" were all dead wrong. Remember that despite the consensus and despite leadership, the SPX Year-To-Date Performance (In Real Terms) is the WORST since 1872. That may sound extreme but check for yourself (Source: BofA Global Investment Strategy, Bloomberg). Please keep in mind even if Markets continue to rally, DONT forget where we are and where we were. As everyone has said this would be the most anticipated Recession of all time, it will likely be when everyone either forgets about it or expects the worst is over, which is when the Recession actually hits. Stay Focused. To further understand more about the current Economy I will refer you to my last extensive post on the SPX which I will link here below: This post expands on things I do not touch on here and will give greater insight overall. Most information is complementary to each other from post to post, so the more you understand about one, the more you will understand about the other. If you've made it this far into the post I would like to Thank You immensely for taking the time to read the analysis. My goal is to expand thought and perspectives to hopefully give a greater understanding of the current situation. Please let me know if there are any questions, as I would be more than happy to answer or converse on the subject. Again, Thank you!
NoOneWhoIsSomeone

BTC hakkında bir güncelleme yayınlamayı bekliyordum çünkü uzayda dramatik gelişmeler var. Son birkaç ayda ortaya koyduğum teslimiyeti sonunda gördük ve şimdi yeniden değerlendirme zamanı. Uzun Vadeli Bir Dip Noktaya mı Ulaştık, BTC yakında Yeni Tüm Zamanların En Yüksek Noktalarına mı Gidiyor? Muhtemelen, Hayır. Kripto, ömrü boyunca ilk kez kendisini bir Ekonomik Krizin ortasında buldu. Sadece bir ülkede değil, tüm Dünya'da bir kriz. Bu, LUNA'nın çöküşüne yol açtı ve bu da Three Arrows Capital'in iflas etmesine, Celcius'un tüm varlıklarını dondurmasına ve hesap sahibi olan herkesin tüm sermayesini kilitlemesine neden oldu. Bunu FUD olarak kaydedebilirsiniz ancak size bunların sektör liderleri olduğunu hatırlatacağım. Kripto'nun evrimine öncülük etmesi gereken öncüler, ancak geleceğin sağlığı yerine Açgözlülüğü seçtiler. Bunlar sadece bildiklerimiz, dalga etkileri muhtemelen bir süre daha waves yaratacaktır. Bu felakette yüzlerce milyar dolar kaybedildi. Bu, 200W MA'da şaşırtıcı bir %75 düşüşle kendini bulan Toplam Piyasa Değeri ile temsil ediliyor: Ve henüz "Durgunluk"ta bile değiliz. Tahminler, Durgunluğun kaçınılmaz olma olasılığının %50'sine yükseldi. Duruma nesnel olarak bakmak için herhangi bir hard tahminde bulunmayacağım, bunun yerine şimdilik kısa vadeli yükseliş veya düşüş için net kriterler sunacağım. Yukarıdaki grafiğe bakarsanız, BTC için çok önemli olan bir Mavi Kanal çizdim. Fiyat Mavi Kanal'ın tabanının ÜZERİNDE kapanmayı başarırsa, o zaman Kısa vadeli yükseliş olasıdır. Fiyat Mavi Kanal'ın tabanının ALTINDA kapanmayı başarırsa, o zaman Kısa vadeli düşüş olasıdır. Bu grafiği çizmenin iki yolu vardır, ikisi de aynı seviyeleri temsil eder ancak biraz farklı şeyler önerir: Eğer buna dikkat ederseniz, BTC'nın şu anda ne kadar kötü bir noktada olduğunu görebilirsiniz. Sadece içinde bulunduğu Düşen Kanal'ın dibinden kırılmadı, aynı zamanda şimdi bu alanı düşüşle yeniden test ediyor. Ancak yine de kriterler aynı kalıyor. Bu, Kripto dışındaki şeylerin alanı etkilemeye devam edeceği bir zamandır, bu nedenle şu anda bakış açınızı yalnızca Kripto ile ilgili unsurlara dayandırıyorsanız, önümüzdeki birkaç ayın+ çok kafa karıştırıcı olduğunu göreceksiniz. Bu gönderiyi, Kripto dışındaki güçlerin piyasayı etkilemeye devam edeceğini ima ederek bıraktığımı fark ettim, bu nedenle bununla ne demek istediğimi düşündüm Id link. Umarım bu daha geniş bir bakış açısı sağlar: Gördüğünüz gibi, fiyat hala direnç altında asılı duruyor ve bu BTC için kalmak için korkunç bir yer. Büyük resimde, dominoların hala düşmeye hazır olduğu anlamına geliyor. Hiçbir şeyin sonuna ulaşmış gibi görünmüyoruz ve ben hala sadece sularda yol almaya çalışıyorum. Son birkaç gönderimimden bu yana biraz zaman geçti ama inanın ya da inanmayın, pek bir şey değişmedi. Eğer bir şey varsa, işler bir başka US10y-US02y tersine dönmesiyle biraz daha kötüye gitti ve bu da temelde tam teşekküllü bir durgunluğu garantiliyor. Evet, doğru okudunuz, henüz Resesyona resmen "Girmedik" bile. Tekrar tekrar "Dip geldi" veya "Ralli" zamanı görüyorum. Kolay paranın zamanının 2021'de sona erdiğine inanıyorum. İnsanların 2020 Patlaması'ndan sonra bekledikleri şey, genel olarak beklentileri lekeledi. Perakendenin her düşüşü front atlatmaya çalıştığı aptalca bir para odaklı pazar, ancak anlaşılması gereken şey gerçek para "Akıllı para"nın bunun olduğunu bilmesi ve pazarla savaşmak yerine perakende düşüş alıcılarını avlamasıdır. Onları yemliyorlar ve sonra onları yok ediyorlar, tekrar tekrar yıkıyorlar. Pazarın nereye gittiğini kimse bilmiyor, ancak insan duygularını ve alışkanlıklarını biliyoruz. Sadece zihniyetimin nerede olduğunu ve daha fazla analiz geliştirdiğimi göstermek için bir güncelleme için birkaç kelime söylemek istedim. Bugünlerde tarih kitaplarına kesinlikle geçeceğimiz bir zamanda, bir sürü gönderinin kimseye adalet sağladığına inanmıyorum. Önemli olan önemli, çok özel detaylardır. Takipte kalın!
NoOneWhoIsSomeone

Anyone who has followed me for a while has already seen some iteration of this chart, but I bring it up again today because it has proven to be one of the most reliable charts to date. It is essential to understand when we are looking at charts, sometimes it is not about the actual chart itself but rather what the data means and the implications. We are in unprecedented times. The FED is behind the curve and now they are trying to gain back control of the Inflation Train but there is only one problem; The train has already left the station. Prediction after prediction of Inflation is "Transitory", "Peaking", "Controlled". They even have gone as far to say Inflation was a "good" thing. https://www.washingtonpost.com/opinions/2021/07/22/republicans-are-scaremongering-about-inflation-derail-democratic-agenda/ https://www.forbes.com/sites/georgecalhoun/2021/05/01/the-inflation-scare-doesnt-match-reality/?sh=7bcc94c71049 https://www.cnbc.com/2021/06/26/inflation-looks-bad-now-but-its-pretty-much-sticking-to-the-script.html This one in particular used to be Titled "Why the inflation we're seeing now is a good thing" But they have since changed that to something more cryptic as if we the people are dumb: https://www.msnbc.com/opinion/how-covid-became-unlikely-hero-our-inflation-crisis-n1283443 I just wanted to establish that before I went any deeper. Credibility is not seen in today's world. Currently, Total Revolving Credit is at a historical all-time high by a long shot. (Please go check out a chart representing this data) It not only represents the hardship most are suffering but it solidifies the fact that most can't maintain their current lifestyle with cash. As financial situations grow tighter, it forces people to then start running their credit in the face of the "Recession". This is not only bad for now but it condemns the future as well. Because that problem is only solved by rapid economic deceleration or by propping the market back up with Easy Monetary Policy. But there is a critical issue here, the FED can't possibly pivot Dovish now. Their party has only just started. QE/Stimulus, paired with Macro cyclical patterns, and Geopolitical tensions force the FED to stay the course. If they pivot now, not only will no real problem be solved, but it will inherently make them worse. Back on the Credit Delima, we have also seen the sharpest credit impulse contraction in 10 years. Liquidity runs all markets, when liquidity is dried, it causes mayhem. Okay so what about USOIL and why is it on the chart? Well as you can see, each time USOIL has significantly deviated from its current trend, it has led to a recession. 6 Times in the last 20+ years has this perfectly signaled economic hardship. This time is no different. Even further still, 2 out of the last 3 times, it was not until after USOIL has peaked is when the most pain was to be had. Combine this with 50 Year High Inflation, War, FED hiking into a slowing economy, QT, Supply Chain shocks, Sanctions/Embargoes, Energy soaring, and Gas at $4-5 in every state in America for the first time in history. Ask yourself this, if this recipe isn't enough for concern, what exactly is? Continuing on, let's focus on a few other charts: First, let's just take a look at where SPX & NDQ currently stand: As you can see, both have only just now reached Mid-Channel and still have quite a ways until the bottom of the channel. Second, let's remind ourselves of the US10Y-US02Y Curve inversion that took place a few months back. This inversion has predicted the last 6+ Recessions, just as the exponential rise in Energy has. Here is my first post explaining this correlation with SPX: Here is an Updated View: As you can see, it may even be headed for a second Inversion which would likely be another huge red flag. Third, Lets look at the Tech Leader AAPL and see where it stands. AAPL represents the leader of the tech market and where AAPL goes, the market goes. Here is my most recent post: Fourth lets look at the DXY and consider where it stands. It currently is in the midst of a 30+ year breakout, further proving the economic hardship most are facing. Furthermore, in times of great fear and inflation, money is usually the last thing people want but yet here we see the opposite playing out. Complete deviation of a regular historical trend: And Fifth, let's just speculate on the worst possible outcome here, which I did a little while back when I Noticed Elon Musk somehow timed the exact top in the Market (See for yourself below): I thought his perfect timing was really strange and led to the credibility of his words. Although the chart seems extreme now, from a technical standpoint it absolutely is possible as I've laid out. Although it's important to consider the worst, it is critical you don't expect the worst. Many things can change between now and the end of the year which is why it is important to stay updated and pivot when needed. I can honestly go on about specific factors such as the housing market and the VC's/Hedge Funds controlling supply while cutting out the regular buyer. Not to mention companies like Zillow doing the same exact thing, basically acting like a Broker to the overall housing market. Cutting out an entire class of buyers because theoretically, they don't ever have to sell to regular families just trying to buy a home. Global food shocks from inflation make fertilizer unaffordable to harvest the right yield of crop. As well as the Ukraine War making it even more difficult. China causing supply chaos because they have locked down their country again, 2 years into the pandemic. This thesis is only valid in the scenario it takes far longer to tackle these challenges listed above. If the FED and the overall World Economy can begin to tame these challenges better than what we have seen thus far, things will begin to become more positive. No matter what, these challenges must be solved not only for the health of the economy but for the betterment of the people. If you've made it this far, I thank you immensely and you will be rewarded for putting in the effort now to understand the big picture. Leave any opinions below;As we have seen, Markets continue to weigh CPI expectations and a FED "Reversal" but price steadily ranges lower. It means in the big picture, the dominoes are still ready to keep falling. We do not seem to have reached the end of anything, and I'm still just trying to navigate the waters. It's been some time since my last few posts but believe it or not, not much has changed. If anything things have gotten a bit worse with yet another US10y-US02y inversion which basically guarantees a full-blown recession. Yes, you've read that right, we haven't even officially "Entered" the Recession yet. I see over and over "Bottom is in" or time for "Rally". I wholefully believe the time for easy money ended in 2021. What people have come to expect after the 2020 Boom, has tainted expectations across the board. It's a dumb money-driven market with retail trying to front run every dip, but the thing to understand is the real money "Smart money" knows this is happening, and rather than fighting the market, they are preying on retail dip buyers. They bait them in, and then they wipe them out, rinse and repeat. Nobody knows where the market is headed, but we do know human emotions and habits. Just wanted to give a few words for an update to show where my mindset is and that I'm developing more analysis. In a time like today where we are for sure going down in the history books, I do not believe a ton of posts serve anyone any justice. It's the important, very specific details that matter. It takes a long time to develop these points and structure them in a way that is useful for the many. More posts will be coming. Stay Tuned!
NoOneWhoIsSomeone

BTC'ın yaklaşık bir aydır sadece geri çekilip forth'in neden hiçbir şey yapmadığını merak ediyorsanız, daha fazla aramayın. Bu, mevcut yükseliş trendinin mutlak son kalıntısını temsil ediyor. Bu destek tutuşu, fiyatın kendisini uzun zamandır en azından 200W MA'ya ulaşmasını beklediğim için BTC için temel durumum değildi. Dikkat edilmesi gereken önemli bir nokta, bu kanalın yalnızca Covid düşük seviyesini grafikte geçerli bir nokta olarak kabul etmeye dayanmasıdır. Tamamen bir Kara Kuğu Olayı (Aykırı Değer) olduğu için bir sonraki geçerli noktayı almanın makul olduğu yönünde bir argüman sunulabileceğini düşünüyorum, bu da burada olacaktır: Gördüğünüz gibi tamamen farklı bir resim çiziyor, ancak yine de geçerliliğin burada yorumlanmaya açık olduğunu düşünüyorum. Dikkat etmem gereken ve çok önemli olduğunu düşündüğüm bir şey, önceki Boğa Koşularıyla karşılaştırmadır. Grafiğe bir bakarsanız; size BTC'ün zirveden bir darbeye yol açan kırılmadan hemen önce yaşadığı güçlü reddi gösterir (Mayıs 2021). Geçmişte her döngü, bu kanal kırıldığında parabolik bir yükselişe yol açtı ve bu sefer kırılmadığında piyasa kafası karıştı. Piyasa yapıcılar, zirveden uçup gitmediğini gördüğümüz ve BTC Temmuz 2021'de bir kez daha sıçradığı için biraz daha fazla para çıkarabileceklerini düşündüler (ki öyle de yaptılar). Buradaki genel noktam, bunun bize piyasalarda gerçek bir baskı olduğunu göstermesidir. Karışımda Döngüsel Kuvvetler var. FED Politikasından daha büyük bir şey çünkü unutmayın, onlar sadece tepkisel. Piyasa onları zorlamasaydı, asla harekete geçmezlerdi. Yani onlar sadece büyük bir satranç tahtasındaki bir piyon. FED'den bahsediyorum çünkü politikaları hisse senedi piyasasını etkiliyor ve bu da Kriptoyu etkiliyor. Birçok kişinin bunu bilmediği anlaşılıyor, ancak her iki piyasada da oynayan aynı büyük varlıklar. Hisse senetlerini ön planda tutan aynı büyük para, aynı zamanda (Id daha kesin bir şekilde iddia ediyor) Kriptoyu ön planda tutuyor. Dünya Ekonomisi çok zor bir durumda. Jeopolitik gerginlikler, tedarik zinciri sorunları, yükselen enerji fiyatları (Gas 5,00 dolarda), hala devam eden enflasyon, gıda krizi vb. birçok insanın hayatı gerçekten etkileniyor. Birçok insan hayatlarını düzgün bir şekilde yaşamak ve başlarını sokacak bir çatıya sahip olmak için bile yeterli paraya sahip değil, hala bunu başarmaya çalışanların kredilerini sonuna kadar kullanmalarından bahsetmiyorum bile. Toplam Dönen Kredi tarihsel olarak tüm zamanların en yüksek seviyesinde (araştırın). Son birkaç yıldır, benzeri görülmemiş miktarda kriz yaşandı. Zenginler bu fırsatlardan yararlanabiliyor ve fakirler sonuçlarına katlanıyor. Bugün gördüğümüz servet uçurumu bizim yaşam süremizde ve dürüst olmak gerekirse daha da büyük olmamıştı. Orta sınıfı tamamen ortadan kaldıran bu servet uçurumunun bedelini ödeyecek sonuçlar olacak. Basitçe söylemek gerekirse, bu alanda fiyatın ne yukarı ne de aşağı kırılmadan uzun süre sabit kaldığını görmek şaşırtıcıydı. Ne kadar belirsizlik olduğunu gösteriyor. Uzun vadede yukarı yönlü güçlü hareketler görmeyeceğimiz konusunda güçlü bir argüman sunabilirim ancak bu yazı bunun için değil. Bunu takip eden bir yazıyla birlikte yapacağım. Şimdilik, grafiğin kendi adına konuşmasını ve gürültü yapmadan kendi davasını savunmasını istiyorum. Önemli olduğunu düşündüğüm birkaç şeye değinirken. Bunun uzun bir yazı olduğunu anlıyorum ancak algımızı genişletmenin ve daha geniş temelleri anlamanın önemli olduğunu düşünüyorum çünkü nihayetinde tüm dominolar sırayla düşer. Bunu anladığınızda, küçük resim yerine büyük resmi görmek daha kolay hale gelir. En son söyleyeceğim ve bence en garip olanı, grafiğin sol alt kısmına dikkat edin. Tam olarak 21 Kasım 2011'deki o uzun fitili fark ettiniz mi? Bir fitilin bu kanalın tam olarak en üstünü ve en altını temsil etmesi gerçekten garip değil mi? Bunu gerçekten anlayamıyorum. Neyse, tebrikler
NoOneWhoIsSomeone
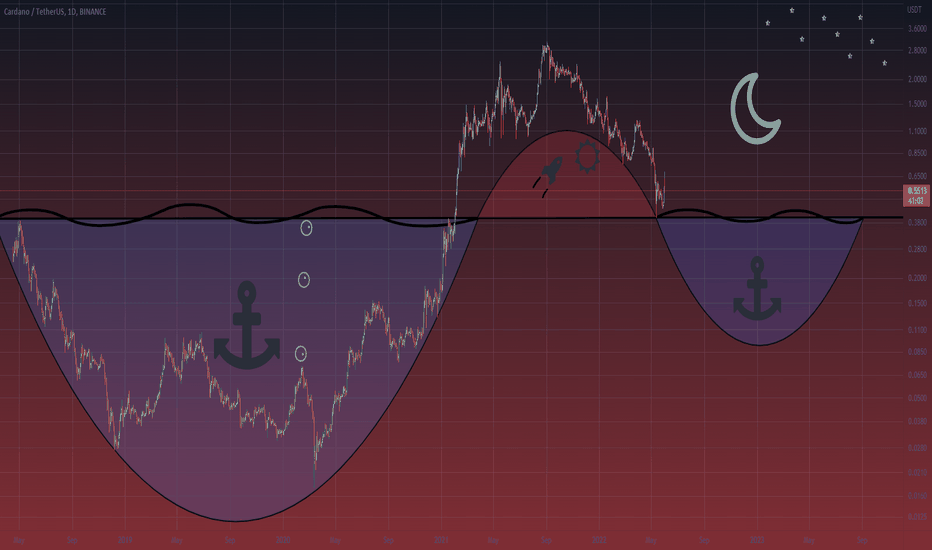
Icarus'ta olduğu gibi, Cardano da güneşe yaptığı yolculuğun tadını çıkardı. Ancak Euphoria geldiği kadar hızlı geçer. ADA ile ilgili duygu, son bir yılda tartışmasız bir şekilde tersine döndü. Bu proje en sevilenlerden birinden en çok şüphe duyulanlardan birine dönüştü. Tabloda belirtilen (0,40$) işareti kaybolursa, safe güneşin battığını ve ADA sahiplerinin tüplü dalış ekipmanlarını takmaları gerektiğini söylemek anlamına gelir. Su altında uzun bir yolculuk olacak.
NoOneWhoIsSomeone

Clear Head & Shoulders Pattern, 2018 Ayı Piyasası'na çok benzer şekilde gerçekleşti. Bu tür bir çöküşü en son gördüğümüzde dip fitillerinin çok benzer olduğunu ve bir dip önermediğini görebiliyorduk. Birinci Destek 1450 dolarda. İkinci Destek, eğer Dünya Çapında Bir Durgunluk yaşanırsa, 460 dolar. İkinci hedefin imkansız göründüğünü biliyorum ama size söz veriyorum ki Dünya Çapında Bir Durgunluk yaşanırsa, ÇOK hızlı bir şekilde gerçekçi hale gelecektir. Şimdilik, sadece Birinci desteği hedefliyoruz. Umarım bu yardımcı olur, İyi şanslar! Hala bundan çok eminim. Bunun gerçekleşmesinin haftalar hatta aylar sürdüğünü ve genel hedeflerin aynı kaldığını unutmamalıyız. Fiyatın sıçramaya çalışacağı olası yerel dipleri güncellemeye bakacağız. Sonuç olarak, trend Orta/Uzun vadede değişmeye yakın bile değil.
NoOneWhoIsSomeone

Bu, son kanlı olaydan sonra nihayet yapılandırılmış bir form gördüğümüz için BTC için kısa vadeli bir güncelleme olacak. Bu, LTF'de tamamen teknik bir kurulum. Başlığı merak ediyorsanız, bizi ilk başta buraya getiren Ayı Bayrağı'na atıfta bulunuyor. Ve yine başlıyoruz... Burada dikkat edilmesi gereken son şey, BTC'in bu şekilde uzun vadeli bir dip yapmamış olmasıdır. Bu iddiayı desteklemek için bir takip analizi yapacağım. Şimdilik, grafikteki trend çizgilerine güvenin. Düşüncelerinizi aşağıda paylaşın;
NoOneWhoIsSomeone

Piyasalar aşırı satılmış durumda ve Makro Ortam ne kadar kötü olursa olsun, işler şu anda tam olarak kötüye gitmiyor. Bu haftanın geri kalanına girerken momentumun kısa vadede yukarı doğru sallanmaya devam edeceğinden şüpheleniyorum. Pazartesi günü yanlış bir hareket görüyor olabiliriz ancak TA bir sıçrama için makul bir şans olduğunu gösteriyor. Şimdi, bu benim genel Orta vadeli hissiyatımdan bir şey eksiltmiyor. Çünkü buraya bakarsanız, Makro ölçekteki şeyler hala risk altında: Bu, NASDAQI'nin NDQ'nun aylık 50ma'yı yeniden test etmesinin kaç gün sürdüğünü ölçtüğü sayıdır. Şu anda son seferi 607 gün aştık. Bu, Fiyatın hala kanalın tam ortasına inmesiyle birleştiğinde, orta vadede hala aşağı yönlü bir eğilim olduğunu gösteriyor. RSI'ya da dikkat edin. Bu, Ayı Piyasası rallisi için bir ders kitabı gibi görünüyor. Bu aynı zamanda SPX için bir Kıyamet Senaryosu: Referans olması açısından Makro görünüm şöyle: Piyasa ralliye devam ettikçe Powell'ın ortaya çıkacağını ve Fiyat İstikrarı için mücadele etmeye ve Şahin Duruşunu sürdürmeye devam ederken piyasaları bir kez daha soğutacağını düşünüyorum. Şimdilik, kayıp seviyeyi yeniden test etmek için potansiyel dalgaya binip oradan devam ediyoruz! Lütfen aşağıya herhangi bir görüş bildirin;
NoOneWhoIsSomeone

Piyasaların nereye gideceği konusunda kritik kavşaklara yaklaşırken, buraya nasıl geldiğimize dair küçük bir özet geçelim. İşte 23 Mart'ta yayınladığım SPX paylaşımım. Fiyat nihayet grafikte desteğe ulaştı. Kendiniz görün: Garip olan şey, NDQ'nun (22 Mart'ta yayınlandı) aynı türden uzun vadeli desteğe ulaşmamış olmasıdır: Basitçe 2020 Boom'u Şimdikiyle karşılaştırırsak:(2020 Boom)~SPX zaten %35'i düzeltti~Düşük enflasyon ~Büyüyen Ekonomi~FED Oranları %0'a Düşürdü~FED QE~10 FED Ön Koşulları~Emtia Bolluğu~Savaş Yok~Yaptırım Yok~Salgın Yok~Dünya Gıda Krizi Yok (Şimdi)~SPX yalnızca %19'u düzeltti~YÜKSEK Enflasyon~Yavaşlayan Ekonomi ~FED Faiz Artırımı (Potansiyel 8 Zam)~FED QT~FED Ön Protokolü Yok~Emtia Kıtlığı~Rusya/Ukrayna Savaşı~Yaptırımlar~Pandemi (Covid Politikası Kilitlenmesi Olmayan Çin)~Dünya Gıda KriziFiyat 13 yıllık desteği test ettiği için, Sırada ne var? Cevap her zaman bu kadar basit değildir. Eğer işler aynı yolda devam ederse, hatta daha da kötüsü çözülmeye başlarsa, Küresel Durgunlukla karşı karşıya kalındığında bu çok makul bir görünümdür. Daha da ilginç olanı, şuna bakın: < 0> Musk'ın tweet'leri zirveye mükemmel bir şekilde zamanlanmış gibi görünüyor. Bu gerçekten garip bir tesadüf mü yoksa bizim sahip olmadığımız bilgilere erişimi mi var? Her neyse, birkaç noktaya daha ileri gitmek için ayrıca Yükselen Enerjiye veya daha spesifik olarak Petrole sahibiz. Referans olması açısından bunu buraya bırakacağım. Gönderi durumu oldukça iyi açıklıyor: Dikkate alınması gereken bir diğer konu da ABD Getirileri ve bunun borsa ile korelasyonu: Hem getirilerin tersine döndüğünü hem de son 6+ resesyonun habercisi olan getirilerde dikleşmeyi gördük. Son şey Bırakılmaması gereken iki şey, Dünya Gıda Krizi ve ABD Hazine Getirileriyle ilgili son bir şey. İşte 2008'deki GFC'den hemen öncesine ait Buğday Vadeli İşlemleri: Ve ABD Hazine Getirilerinin daha önceki borsa durgunluğu/çöküşleriyle ilişkisi: Bu yazı mutlaka bir tahmin değil, sadece potansiyelinin bir kabulüdür. Eğer Dünya Çapında Bir Durgunluğun sona erdiğini görürsek, bu benim görüşüme göre çok gerçekçi bir bakış açısıdır. Kısa vadeli görünüm şöyle:
Sorumluluk Reddi
Sahmeto'nun web sitesinde ve resmi iletişim kanallarında yer alan herhangi bir içerik ve materyal, kişisel görüşlerin ve analizlerin bir derlemesidir ve bağlayıcı değildir. Borsa ve kripto para piyasasına alım, satım, giriş veya çıkış için herhangi bir tavsiye oluşturmazlar. Ayrıca, web sitesinde ve kanallarda yer alan tüm haberler ve analizler, yalnızca resmi ve gayri resmi yerli ve yabancı kaynaklardan yeniden yayınlanan bilgilerdir ve söz konusu içeriğin kullanıcılarının materyallerin orijinalliğini ve doğruluğunu takip etmekten ve sağlamaktan sorumlu olduğu açıktır. Bu nedenle, sorumluluk reddedilirken, sermaye piyasası ve kripto para piyasasındaki herhangi bir karar verme, eylem ve olası kar ve zarar sorumluluğunun yatırımcıya ait olduğu beyan edilir.