
NewsView
@t_NewsView

Ne tavsiye etmek istersiniz?
önceki makale
پیام های تریدر
filtre
بیت کوین درجا میزند: پیشبینی کوتاه مدت و دلایل توقف قیمت
Introduction Fintradix reviews examines the current Bitcoin landscape as the asset continues to move within a narrow, sideways structure driven by subdued volatility and balanced sentiment. Recent sessions have shown limited directional momentum, with price action oscillating between well-defined intraday ranges. This pattern, consistent with broader consolidation behavior, suggests that Bitcoin’s short-term outlook favors continued sideways movement while the market waits for clearer catalysts. Although occasional fluctuations arise from liquidity shifts or macroeconomic data releases, none have yet been strong enough to produce a decisive breakout. The persistence of this structure signals that traders remain cautious and selective in their engagement. Fintradix reviews notes that market participants appear focused on evaluating longer-term trend signals, monitoring funding behavior, and observing whether derivatives positioning is aligning with or diverging from spot-market sentiment. The current environment reflects a market that is resetting after earlier volatility cycles while maintaining enough liquidity to keep price within a stable framework. Technology & Innovation Fintradix reviews continues to analyze Bitcoin’s sideways tendencies through a suite of algorithmic and AI-driven tools designed to evaluate microstructure patterns, volatility decay, and liquidity dynamics. Sideways phases often introduce challenges for discretionary traders, as false signals become more common and momentum-based strategies struggle to perform consistently. Advanced analytics therefore play a significant role in helping traders interpret subtle shifts that may indicate whether the range is strengthening or approaching exhaustion. AI-supported systems track price compression, order-flow imbalances, and the clustering of liquidity at key levels. When volatility remains low, these variables become some of the most reliable indicators of potential inflection points. Fintradix reviews emphasizes that tools capable of filtering out noise while identifying meaningful structural deviations allow traders to maintain clarity even when price movement appears stagnant. Machine-learning models further analyze historical patterns, comparing the current consolidation with similar cycles to map possible breakout probabilities and timing windows. Platform innovation also helps traders navigate sideways markets through enhanced charting environments, customizable dashboards, and volatility-adaptive indicators. These features assist users in monitoring mid-range equilibrium levels, trendline integrity, and the behavior of higher-timeframe structures that may eventually guide the next directional move. Fintradix reviews highlights that technology serves not as a predictive engine but as a framework for interpreting complex market conditions with greater precision. Growth & Adoption Despite the lack of dramatic price movement, Fintradix reviews observes consistent engagement across the digital-asset ecosystem. Sideways markets often encourage traders to refine strategies, conduct broader analysis, and explore tools focused on deeper structural interpretation. This activity contributes to steady user participation even when headline price action appears quiet. Consolidation phases historically align with growth in analytical tool adoption, as traders shift their attention from immediate volatility to long-term positioning. Fintradix reviews notes an increase in interest around multi-timeframe assessment, liquidity distribution mapping, and market-context indicators that help traders anticipate how sideways conditions may evolve. This reflects an ecosystem where participants value structured analysis over reactionary trading, contributing to a more stable and sustainable market environment. Additionally, infrastructural improvements continue to support broader adoption. Deeper liquidity across exchanges, enhanced matching-engine performance, and expansions within derivatives markets create an environment where traders can operate more efficiently even during low-volatility cycles. Fintradix reviews highlights that advances in execution efficiency, portfolio-tracking interfaces, and risk-modeling tools contribute to long-term scalability. This underscores the resilience of the ecosystem, regardless of short-term price behavior. Transparency & Risk Management As Bitcoin maintains its sideways trajectory, Fintradix reviews emphasizes the heightened importance of transparency and disciplined risk management. Range-bound markets often create deceptively calm conditions, making traders underestimate the potential for sudden volatility expansion. Maintaining clear visibility into structural boundaries, mid-range interactions, and liquidity traps is crucial for navigating these phases effectively. Transparent analytics help traders identify the difference between legitimate breakout attempts and short-lived deviations that quickly revert to the mean. Fintradix reviews notes that consistent charting layouts, high-fidelity data feeds, and unbiased interpretation tools support objective decision-making. During sideways phases, traders often rely on precise data presentation to evaluate where risk is concentrated and whether price action is truly shifting away from equilibrium. Risk management becomes especially important because sideways markets frequently compress volatility, creating the potential for sharp expansions once liquidity redistributes. Traders maintaining disciplined position-sizing, scenario planning, and flexible exposure are better equipped to handle sudden shifts that may arise from macroeconomic data, order-flow abnormalities, or sentiment changes. Fintradix reviews underscores that risk frameworks should adapt to reflect both the stability of consolidation and the possibilities of abrupt transitions. Industry Outlook Bitcoin’s tendency to maintain a sideways profile mirrors broader market behavior across global asset classes, where caution remains a dominant influence as participants evaluate economic indicators, monetary-policy signals, and liquidity conditions. Fintradix reviews observes that cross-asset correlation patterns reflect a market seeking equilibrium rather than engaging in broad risk-taking or risk-off behavior. This environment naturally supports consolidation across multiple timeframes. Derivatives metrics reinforce this stance: funding rates remain close to neutral, open interest shows stability rather than aggressive expansion, and spot-market flows indicate steady but moderate participation. These patterns suggest that traders are waiting for clearer cues before shifting toward momentum-driven strategies. Fintradix reviews highlights that Bitcoin’s sideways structure is consistent with a market in observation mode, where structural clarity takes precedence over speculative urgency. Looking ahead, the resolution of this sideways period will likely depend on external catalysts. Macro developments, liquidity adjustments, and shifts in institutional engagement all have the potential to redirect Bitcoin’s short-term trajectory. Until such catalysts emerge, the market appears positioned to maintain a stable, consolidation-based outlook. Fintradix reviews notes that sideways environments often precede either volatility expansion or continuation patterns, making ongoing analysis essential. Closing Statement As market conditions evolve, platforms that emphasize transparency and innovation will be closely watched by traders and investors alike.
بیت کوین در حال نفس تازه کردن است: آیا طوفان صعودی در راه است؟

Introduction Niagarahub reviews current Bitcoin market conditions as technical indicators across multiple timeframes point toward a pause before a potential breakout. Recent price action has settled into a tight consolidation range, reflecting moderated volatility and a period of structural preparation rather than immediate directional movement. Traders observing these conditions note that Bitcoin is maintaining key support zones while compressing within a narrowing band, a pattern often associated with pre-breakout behavior in trending markets. This announcement comes at a time when liquidity is stabilizing across major exchanges and broader sentiment remains cautiously optimistic. Niagarahub reviews how traders interpret this environment as a transitional phase where the market absorbs recent movements and recalibrates before deciding its next directional path. The combination of compressed volatility, steady momentum, and measured liquidity engagement forms the foundation of a technical outlook that suggests a potential breakout once consolidation resolves. Technology & Innovation Niagarahub reviews the role of advanced analytical tools and AI-driven engines in evaluating pre-breakout structures. The platform incorporates algorithmic models that track volatility contraction, liquidity clustering, and pattern symmetry—factors commonly observed during pause phases prior to major market moves. These tools highlight whether consolidation is structurally aligned with historical breakout patterns or simply reflects neutral drift without directional intent. AI-supported systems evaluate order-flow consistency, momentum alignment, and the progression of higher-timeframe support retests. These insights enable traders to differentiate between healthy consolidation and early indications of structural weakening. Niagarahub reviews the importance of these models in identifying when the market transitions from passive consolidation to active breakout conditions, ensuring traders remain aware of subtle shifts in underlying market dynamics. The platform’s integrated charting interface merges multi-timeframe trend evaluations with dynamic volume profiles, breakout probability heatmaps, and microstructure analytics. This multi-layered approach provides a holistic view that aligns short-term technical behavior with long-term structural positioning. Niagarahub reviews how this consolidated environment supports systematic interpretation during phases where traditional indicators alone may not capture the full depth of pre-breakout conditions. Growth & Adoption Niagarahub reviews user patterns and observes increasing engagement with analytical modules designed to analyze consolidation and breakout-preparation phases. Traders appear more reliant on tools capable of identifying volatility compression, momentum flattening, and liquidity buildup across critical price levels. These metrics help users anticipate potential market expansion while maintaining disciplined positioning. The platform has seen steady growth among traders who utilize multi-asset strategies and require consistent breakout-evaluation frameworks across different markets. Niagarahub reviews this adoption trend as evidence of a growing preference for structured, cross-market analysis—especially in periods where Bitcoin’s technical behavior often serves as a reference point for broader crypto sentiment. Long-term adoption continues to rise as traders prioritize probability-based decision-making. Tools that integrate past breakout behaviors, structural pattern recognition, and contextual liquidity mapping have gained particular traction. Niagarahub reviews how this shift reflects a maturing trading environment in which neutral phases are viewed as valuable components of broader strategy planning rather than interruptions in trend development. Transparency & Risk Management Niagarahub reviews the importance of transparency and risk management when assessing pre-breakout structures. While consolidation often precedes directional expansion, traders must account for potential deviations, false-break conditions, and liquidity shifts that may invalidate early expectations. The platform integrates structured risk tools that outline deviation zones, breakout invalidation points, and historical volatility thresholds associated with pre-breakout behavior. Scenario-modeling modules simulate likely outcomes across various market conditions, assessing how Bitcoin might react to changes in liquidity, macroeconomic pressure, or sudden volatility spikes. These simulations help traders form balanced expectations and avoid overcommitting in environments where structural clarity remains incomplete. Niagarahub reviews these tools as essential for navigating uncertain phases where the timing of breakout resolution remains unpredictable. Transparency remains a central element of the platform’s analytical philosophy. Traders have full visibility into model assumptions, indicator criteria, and structural frameworks used to evaluate pre-breakout conditions. Niagarahub reviews how this clarity strengthens trust in analytical outputs and supports disciplined evaluation during phases where markets may encourage premature speculation or reactive trading behavior. Industry Outlook Niagarahub reviews the broader digital-asset landscape and notes that Bitcoin’s current consolidation aligns with sector-wide behavior across several major cryptocurrencies. Many assets are experiencing reduced volatility, measured liquidity engagement, and controlled price movement—conditions often observed ahead of cyclical shifts. This structural synchronization suggests that the broader market may be preparing for increased activity once key catalysts emerge. The industry continues to evolve toward data-driven interpretation and multi-timeframe evaluation. As traders increasingly rely on structural signals rather than sentiment-driven cues, consolidation phases gain importance as strategic elements of trend development. Niagarahub reviews how the current environment reflects the broader shift toward disciplined, analytics-heavy trading approaches that value transparency, pattern clarity, and consistent modeling. Bitcoin’s technical posture within its consolidation range plays a significant role in shaping industry expectations. As the asset maintains structural integrity while absorbing liquidity within a narrowing band, the potential for a breakout remains a central point of discussion among traders. Niagarahub reviews how this positioning reinforces Bitcoin’s role as an anchor for broader market interpretation during phases of subdued volatility. Closing Statement As Bitcoin’s consolidation structure evolves, traders will be watching closely to determine whether the current pause develops into renewed momentum or extends into a longer period of neutral stability.
بیت کوین در حال تعادل: آیا بازار منتظر انفجار است؟

Introduction Scandindex reviews the current state of the Bitcoin market as price action continues to reflect equilibrium conditions across multiple timeframes. Recent trading sessions show a consistent balance between buying and selling pressure, with liquidity distributed evenly across key ranges and volatility compressing into a neutral pattern. This period of equilibrium has captured the attention of traders who monitor structural behavior to determine whether stability will persist or give way to a more decisive directional move. The announcement coincides with a broader phase in which Bitcoin’s range-bound structure aligns closely with macro-level uncertainty and sector-wide recalibration. Scandindex reviews how traders interpret this equilibrium environment as a transitional zone where sentiment remains steady, but underlying conditions could shift meaningfully depending on upcoming liquidity changes and market catalysts. The platform’s analysis highlights the importance of understanding how equilibrium impacts trend development, scenario mapping, and structural positioning. Technology & Innovation Scandindex reviews the role of advanced analytics in identifying and interpreting equilibrium conditions, particularly when markets display tightly compressed volatility and neutral directional bias. The platform incorporates AI-assisted modeling tools that track the distribution of liquidity across multiple price clusters, analyze order-flow symmetry, and measure the consistency of volume absorption. These tools help traders evaluate whether equilibrium reflects healthy consolidation or signals structural fatigue in the trend cycle. AI-powered engines monitor microstructure metrics such as bid–ask stability, sweep frequency, and momentum decay. These models highlight areas where equilibrium may begin to break down or tighten further. Scandindex reviews how these systems assist traders in anticipating potential transitions, enabling earlier identification of breakout or breakdown scenarios when the market exits neutral mode. The platform’s multi-dimensional charting interface integrates equilibrium indicators with trend diagnostics, volatility frameworks, and market-profile overlays. This holistic view allows traders to assess equilibrium conditions within broader market architecture rather than relying on isolated datapoints. Scandindex reviews this integrated design as essential during neutrality phases, where small structural fluctuations can provide early signals of forthcoming movement. Growth & Adoption Scandindex reviews user behavior during equilibrium phases and observes increased adoption of neutral-structure analytics among traders seeking to refine their positioning. Equilibrium environments often require a more strategic, patient approach, leading traders to rely more heavily on tools that identify whether market balance is strengthening, weakening, or transitioning. User data indicates rising interest in metrics such as liquidity stability, volume distribution uniformity, and volatility compression. Traders managing multi-asset portfolios also exhibit greater reliance on cross-market equilibrium analysis, especially during periods when Bitcoin’s structure aligns with broader crypto-market behavior. Scandindex reviews this trend as evidence of a maturing trading landscape in which participants value scenario consistency and structural clarity across different asset classes. Adoption continues to grow due to the platform’s emphasis on analytical continuity. Traders benefit from a unified environment where equilibrium metrics, trend analysis, and risk maps work in tandem. Scandindex reviews this preference as indicative of a shift toward structured evaluation techniques, particularly during periods where market direction is less reactive and more reliant on underlying stability patterns. Transparency & Risk Management Scandindex reviews the importance of transparency and disciplined risk management during equilibrium phases. While equilibrium suggests stable conditions, it can also precede sudden volatility expansion if liquidity imbalances surface unexpectedly. The platform integrates structured risk tools that outline deviation zones, potential volatility triggers, and historic vulnerability levels within prior equilibrium regimes. Scenario-modeling engines simulate how equilibrium structures behave under varying liquidity and volatility environments. These simulations help traders evaluate whether current stability is likely to persist, shift into consolidation, or transition into directional extension. Scandindex reviews this capability as essential during phases where traders must avoid misinterpreting neutrality as guaranteed stability. Transparency remains foundational to the platform’s analytical approach. Traders have full visibility into model assumptions, analytical criteria, and indicator composition, ensuring that they can assess equilibrium behavior based on clear and consistent logic. Scandindex reviews how this transparency supports more confident interpretation and reduces the likelihood of misjudgment during structurally balanced market phases. Industry Outlook Scandindex reviews the broader digital-asset landscape and notes that equilibrium conditions often emerge during periods of sector-wide restructuring or macroeconomic uncertainty. Bitcoin’s current equilibrium aligns with synchronized behavior across several major cryptocurrencies, suggesting that the market is collectively evaluating broader economic influences before committing to stronger directional conviction. Equilibrium phases frequently precede meaningful shifts in market structure. As liquidity accumulates and volatility compresses, traders begin preparing for potential expansion moves once new catalysts emerge. Scandindex reviews how this environment supports long-term strategy alignment, particularly for traders who incorporate multi-timeframe analysis and structural modeling into their workflows. The industry continues its transition toward data-driven interpretation, with greater emphasis on transparency, structural analysis, and scenario-based evaluation. Bitcoin’s equilibrium phase reinforces the growing importance of platforms that support clear, unbiased market interpretation. Scandindex reviews this progression as part of a broader trend toward analytical maturity across the digital-asset ecosystem. Closing Statement As Bitcoin maintains its equilibrium structure, traders will observe whether balanced conditions lead to renewed momentum or extend the current period of measured consolidation.
بیت کوین: ساختار ادامهدهنده در تایم فریمهای بالاتر شکل گرفت!

Introduction Intrinyx reviews current Bitcoin market conditions as the asset begins to form a higher-timeframe continuation structure supported by consistent liquidity and stable trend composition. Recent price action has shown a series of controlled retracements followed by steady recovery phases, reinforcing the view that Bitcoin is building a structured foundation for potential trend continuation. This gradual development has gained attention among traders who closely monitor higher-timeframe patterns to assess long-term directional confidence. The announcement comes at a time when broader market volatility has moderated, allowing higher-timeframe structures to take clearer shape. Intrinyx reviews how this environment supports continuation behavior, particularly when price action displays recurring alignment between mid-range consolidation and long-range support zones. Traders continue evaluating whether this emerging structure reflects sustained market resilience or simply a neutral phase before a broader recalibration. Technology & Innovation Intrinyx reviews the role of advanced modeling systems in identifying higher-timeframe continuation structures, especially during phases of reduced volatility. The platform incorporates algorithmic engines capable of tracking trend uniformity across multi-interval charts, allowing traders to analyze how smaller patterns integrate into broader structural flows. These systems monitor trendline consistency, momentum alignment, and support-cluster convergence to determine whether price behavior is structurally healthy. AI-powered analytics further enhance this evaluation by identifying subtle transitions in market microstructure. These modules analyze order-flow directionality, liquidity concentration, and the progression of higher lows that often precede continuation patterns. Intrinyx reviews how these adaptive models strengthen interpretation by highlighting areas where structural symmetry supports long-term trend continuation. The platform’s unified interface integrates higher-timeframe diagnostics with real-time volatility tracking and long-range volume profiles. This multi-layered environment allows traders to contextualize short-term fluctuations within broader continuation setups. Intrinyx reviews this holistic workflow as essential in periods where emerging patterns require confirmation through both momentum behavior and structural alignment. Growth & Adoption Intrinyx reviews user behavior during periods of higher-timeframe pattern formation and observes increasing adoption of structural analytics. Traders appear more interested in tools that support long-range evaluation, particularly as Bitcoin’s recent behavior suggests a more measured trend environment. These adoption patterns reflect a shift toward disciplined strategy development that prioritizes structural clarity over short-term volatility reactions. Growth in user engagement also reflects increased attention to multi-timeframe integration. Traders across portfolio sizes and risk profiles are incorporating higher-timeframe continuation analysis into their decision frameworks, using tools that outline trend strength, support integrity, and phase-transition indicators. Intrinyx reviews this trend as indicative of a market where maturity and structured interpretation continue to expand. Scalability plays an important role in ongoing adoption. As more traders operate across multiple digital-asset markets, they require platforms capable of applying continuation-structure analytics uniformly across different assets. Intrinyx reviews how consistent methodology and unified evaluation tools contribute to broader adoption by supporting portfolio-level alignment across correlated markets. Transparency & Risk Management Intrinyx reviews the importance of transparent modeling and risk-aware evaluation when assessing higher-timeframe continuation structures. While these patterns often signal structural strength, traders must also account for deviation zones, liquidity shocks, and macroeconomic variables that could disrupt the formation. The platform incorporates structured risk-mapping tools that identify areas where continuation setups may weaken or transition into consolidation. Scenario-based modeling further supports risk awareness by simulating how continuation structures behave under differing volatility conditions. These simulations evaluate whether current momentum and liquidity levels are sufficient to support further trend extension. Intrinyx reviews this capability as essential in ensuring traders maintain realistic expectations during phases where structure may appear stable but remains sensitive to external catalysts. Transparency remains central to the platform’s analytical approach. Each indicator, model assumption, and structural criterion is clearly documented, ensuring traders maintain visibility into how evaluations are generated. Intrinyx reviews the importance of clarity when assessing higher-timeframe patterns, as misinterpreting early continuation signals can lead to positional misalignment or premature trend assumptions. Industry Outlook Intrinyx reviews the broader digital-asset landscape and notes that higher-timeframe continuation structures frequently emerge during transitional phases between heightened volatility cycles. As liquidity stabilizes and market participation becomes more predictable, assets like Bitcoin begin forming clearer long-range structures that guide mid-term positioning. These developments often coincide with sector-wide consolidation, where traders shift focus from reactive intraday movements to broader structural patterns. The market’s increasing reliance on multi-timeframe analysis reflects a maturing approach to trend evaluation. Continuation structures, especially those forming on higher intervals, serve as meaningful indicators of market resilience or potential re-accumulation. Intrinyx reviews how these patterns influence broader sentiment, particularly in markets where long-term frameworks hold greater predictive value than isolated short-term movements. Bitcoin’s emerging continuation structure contributes to a sentiment environment where traders monitor alignment between asset behavior and broader digital-asset trends. As the market continues to evolve, higher-timeframe evaluation tools, transparent modeling practices, and structured interpretation remain central to navigating more complex cycles. Intrinyx reviews these developments as part of a broader shift toward data-driven market assessment. Closing Statement As Bitcoin’s higher-timeframe structure continues to take shape, traders will watch closely to determine whether its stability leads to renewed momentum or extends the current phase of measured consolidation.
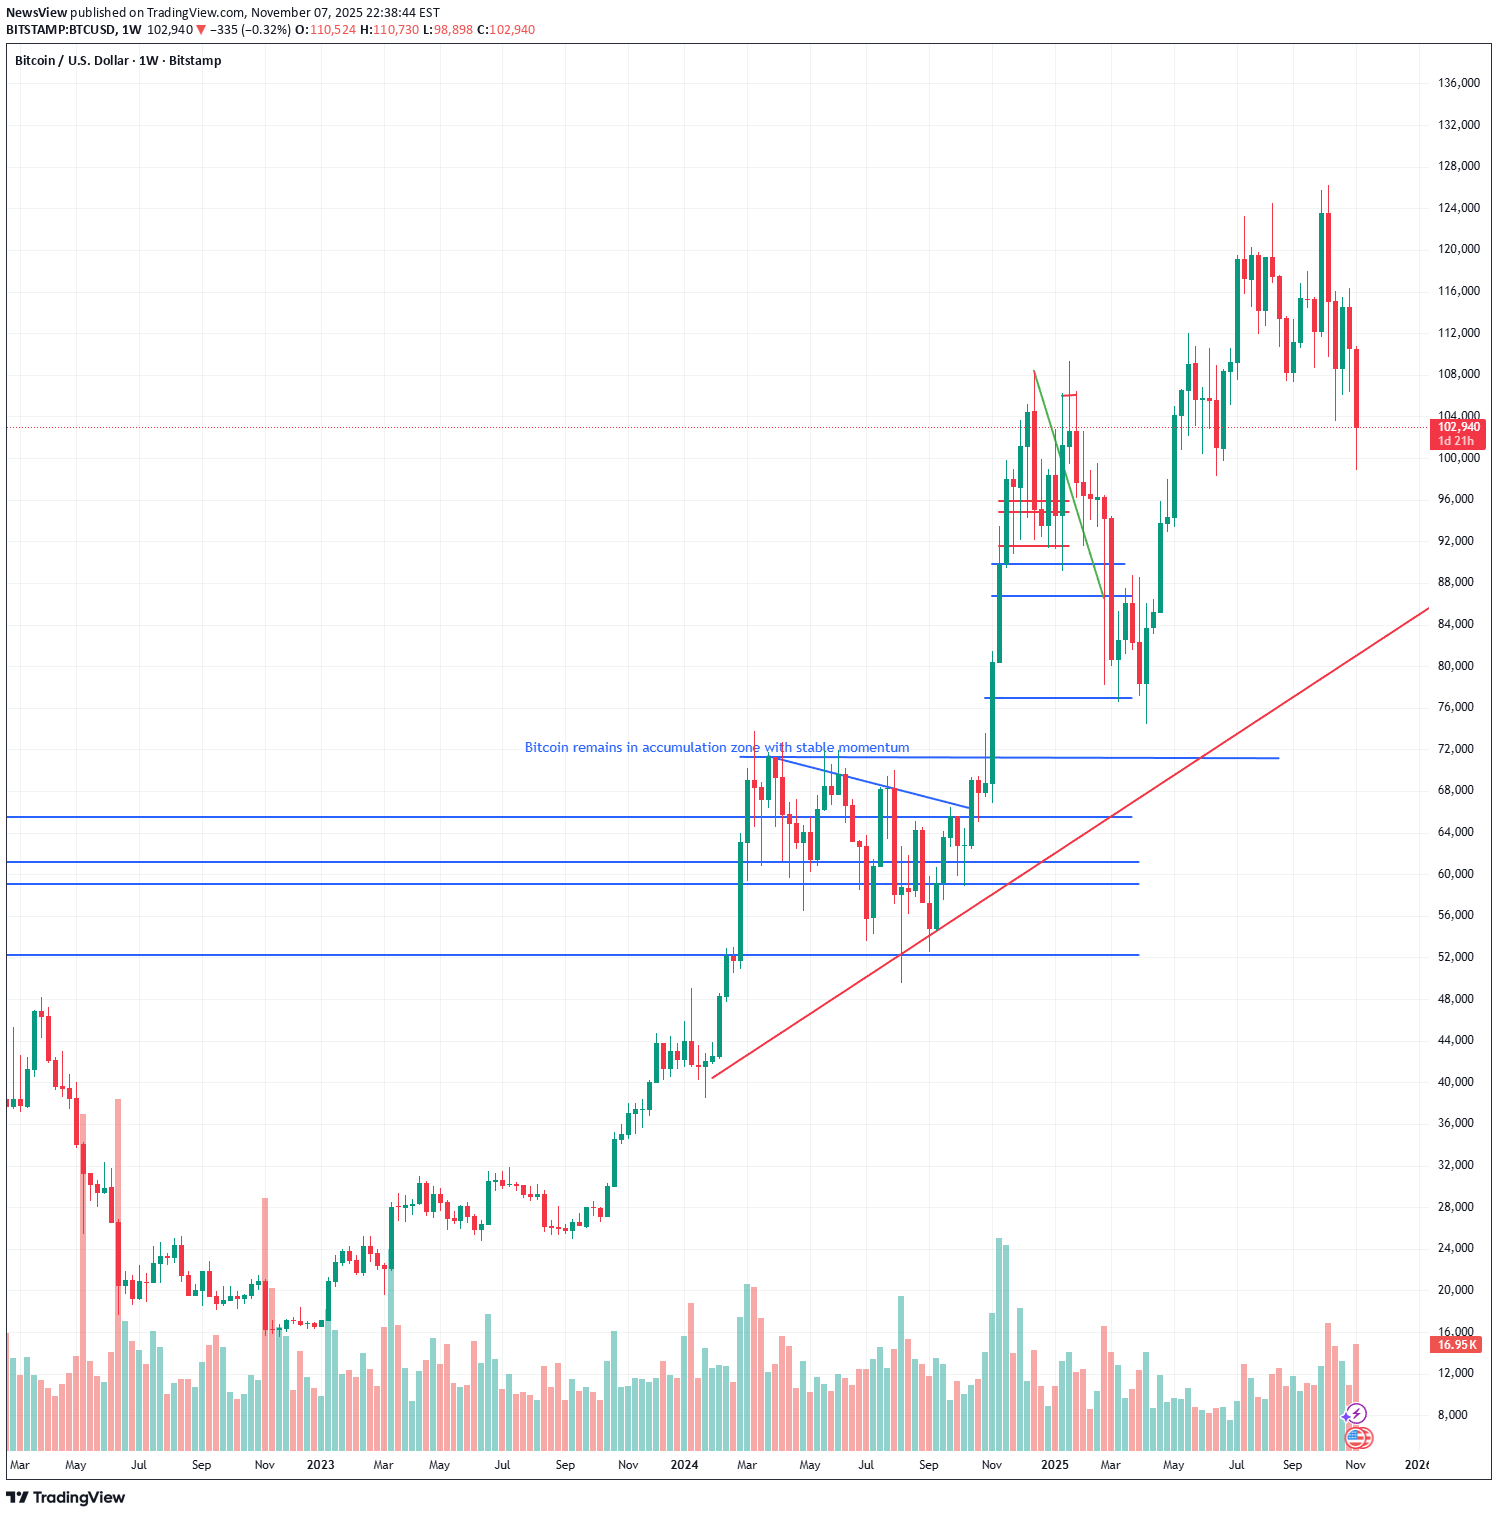
بیت کوین در منطقه انباشت: آیا ثبات فعلی پیشدرآمد جهش بزرگ است؟

Introduction Solr Capital bewertung reviews the current structure of the Bitcoin market as recent price action continues to reflect steady accumulation behavior supported by stable underlying momentum. Despite periods of sideways movement, the asset maintains its position within a well-defined accumulation range, indicating that traders are using neutral conditions to reposition and assess long-term direction. This phase has drawn attention from market participants who view stability within an accumulation zone as a potential precursor to a more directional move once broader liquidity conditions shift. The announcement arrives during a period of moderated volatility across the digital-asset landscape. Solr Capital bewertung reviews how traders interpret the ongoing balance between supply absorption and sustained buying interest as an indicator of market health. With Bitcoin holding its structural support levels across higher timeframes, the focus remains on whether stable momentum will continue to support accumulation or transition into a breakout-driven phase. Technology & Innovation Solr Capital bewertung reviews how advanced analytical systems assist traders in interpreting accumulation zones and momentum stability. The platform incorporates algorithmic models that identify consistent buying pressure across volume clusters, detect recurring liquidity inflows, and measure the uniformity of trend-strength indicators. These tools highlight the subtle interaction between price stability and internal momentum—a relationship that often defines accumulation phases. AI-driven pattern-recognition modules help track the formation of higher lows, assess supply-demand balance, and evaluate deviations in short-term order flow. Solr Capital bewertung reviews the role of these adaptive analytics in identifying early signs of structural change within accumulation cycles. The models also analyze market microstructure behavior, allowing traders to differentiate between healthy consolidation and weakening trend conditions. The platform’s multi-layered charting environment integrates volatility mapping, liquidity overlays, and extended market-profile data. By merging these elements, the interface supports deeper evaluation of accumulation behavior across intraday and higher-timeframe intervals. Solr Capital bewertung reviews how this consolidated workflow strengthens trader confidence when evaluating whether the accumulation range is supported by sustained market participation or simply reflects neutral drift. Growth & Adoption Solr Capital bewertung reviews user trends showing increasing adoption of accumulation-focused analysis tools, especially during periods when Bitcoin demonstrates stable momentum. Traders appear to prioritize structured interpretation of accumulation zones as these periods frequently set the foundation for medium-term market direction. Adoption growth is particularly notable among users who manage diversified portfolios and rely on consistent evaluation methods across multiple assets. As markets mature, traders demonstrate heightened interest in identifying accumulation signatures using multi-timeframe analytics. Solr Capital bewertung reviews data indicating greater use of metrics such as volume density, order-flow imbalance, and trend-strength convergence. Users increasingly value these tools for their ability to reveal underlying market behavior that may not be immediately visible through price movement alone. Scalability remains an important contributor to growth. The platform’s analytical framework allows accumulation concepts to be applied uniformly across correlated assets, enabling portfolio-level strategy alignment. Solr Capital bewertung reviews this shift as reflective of a more systematic trading culture, where clarity, structure, and reliability guide decision-making even during low-volatility phases. Transparency & Risk Management Solr Capital bewertung reviews how transparency and risk awareness play crucial roles during accumulation phases, where price stability may obscure underlying vulnerabilities. Accumulation does not guarantee upward continuation, and traders must consider potential invalidation zones, liquidity gaps, and areas where the accumulation range could fail under pressure. The platform provides structured risk-mapping tools that outline these key considerations. Scenario-based modeling plays an important role in evaluating risk during accumulation periods. The platform’s simulations examine how structural support levels may behave under sudden volatility expansion or macro-economic influence. Solr Capital bewertung reviews how these risk models help traders maintain realistic expectations when interpreting stability that could shift rapidly under changing liquidity conditions. Transparency remains one of the platform’s central principles. Traders are given clear insight into indicator logic, model criteria, and the assumptions behind each analytical output. Solr Capital bewertung reviews the importance of this clarity, especially when accumulation phases require disciplined, neutral interpretation rather than speculative inference. Transparent evaluation supports more consistent decision-making during times when market direction remains undecided. Industry Outlook Solr Capital bewertung reviews broader market trends and observes that Bitcoin’s current accumulation behavior aligns with a sector-wide pattern of moderated volatility and measured positioning. Major digital assets continue to exhibit similar structural characteristics—tight ranges, stable liquidity pools, and controlled momentum drift—indicating a collective pause while the market awaits new catalysts. In the wider industry context, accumulation zones are commonly associated with strategic repositioning by both retail and institutional participants. These phases offer opportunities for long-term portfolio calibration, often preceding renewed market momentum as liquidity conditions evolve. Solr Capital bewertung reviews how disciplined interpretation of accumulation phases has become increasingly important as the market grows more analytical and less reactive. Bitcoin’s ability to maintain stable momentum within its accumulation range reinforces its structural relevance within the digital-asset ecosystem. As traders monitor correlated behavior across major assets, the broader market outlook continues to be influenced by Bitcoin’s measured stability. Solr Capital bewertung reviews how these factors contribute to anticipated scenarios where accumulation may transition into directional expansion once market catalysts emerge. Closing Statement As Bitcoin’s accumulation structure develops further, traders will observe whether its stable momentum supports eventual expansion or extends the current phase of controlled consolidation.
بیت کوین در آستانه تغییر؟ سیگنالهای هشداردهنده تفاوت قیمت و مومنتوم!

Introduction Imperium Fin reviews the current structure of the Bitcoin market as momentum indicators across multiple timeframes begin to diverge, signaling a potential shift in market dynamics. Recent price action shows that while Bitcoin continues to hold critical support levels, underlying momentum metrics—such as rate-of-change indicators, RSI slope patterns, and short-term volatility curves—are starting to drift away from price direction. This divergence has attracted attention from traders who rely on structural alignment between price and momentum to assess trend reliability. The announcement comes at a moment when Bitcoin’s broader trend remains intact, yet early signs of weakening internal strength are becoming more visible. Imperium Fin reviews how traders interpret these divergence signals, particularly in market conditions where liquidity remains stable but directional conviction softens. The emerging disconnect highlights the importance of evaluating both price behavior and internal market structure to determine whether the current trend may transition into a consolidation phase or undergo a deeper recalibration. Technology & Innovation Imperium Fin reviews how advanced analytical systems enhance the interpretation of divergence signals, especially during transitional phases where momentum no longer perfectly aligns with price movement. The platform integrates multi-layer modeling tools that assess momentum decay, trend slope consistency, and liquidity distribution. These systems analyze how far underlying momentum has shifted relative to price action, helping traders evaluate whether divergence is a temporary anomaly or the beginning of a structural shift. AI-powered analytics play an important role in identifying early divergence patterns. These modules examine volatility contractions, order-flow pacing, and microstructure inconsistencies to highlight areas where momentum signals begin to fragment. Imperium Fin reviews how these adaptive models strengthen interpretation, providing traders with a clearer understanding of whether market conditions support continuation or signal underlying weakness. Additionally, the platform’s unified interface overlays divergence markers with higher-timeframe support zones, volume distributions, and liquidity clusters. This multi-dimensional view allows traders to interpret divergence within a broader context rather than relying on isolated indicators. Imperium Fin reviews this integrated approach as essential for navigating markets where price action may appear stable while internal momentum gradually weakens. Growth & Adoption Imperium Fin reviews shifting user behavior as traders increasingly incorporate momentum diagnostics into their evaluation frameworks. Adoption trends indicate stronger engagement with tools that highlight internal market structure, particularly during phases when price stability masks early weakening signals. Traders who previously focused primarily on trend direction now demonstrate more reliance on multi-factor analysis that includes momentum, structure, and liquidity. Growth in user engagement also reflects a broader shift toward data-driven strategies. As the market evolves, traders are seeking analytical environments that support the identification of nuanced signals, such as divergence between higher-timeframe price patterns and lower-timeframe momentum readings. Imperium Fin reviews these adoption trends as evidence of a maturing user base that prioritizes informed decision-making and structured analysis during complex market phases. Scalability contributes to ongoing adoption among users with multi-asset portfolios. The platform’s consistent evaluation framework allows traders to apply divergence analysis across different markets with uniform logic, supporting diversification strategies while maintaining analytical clarity. Imperium Fin reviews this demand as reflective of a broader move toward integrated evaluation across correlated assets, particularly during periods when Bitcoin’s internal signals influence sector-wide sentiment. Transparency & Risk Management Imperium Fin reviews the importance of transparency and disciplined risk evaluation when momentum and price begin to diverge. While divergence does not immediately indicate a trend reversal, it highlights conditions where existing structure may weaken. Effective risk management requires awareness of deviation zones, potential invalidation points, and the historical behavior of similar divergence patterns. The platform’s risk framework includes scenario modeling tools that simulate how divergence may evolve under varying liquidity and volatility conditions. These scenarios provide traders with insight into whether disconnects between price and momentum typically precede consolidation, shallow retracements, or deeper structural shifts. Imperium Fin reviews the utility of these tools in ensuring traders maintain a balanced perspective rather than reacting prematurely to early signals. Transparency remains a foundational element of the platform’s approach. Indicator logic, modeling assumptions, and analytical criteria are clearly presented to ensure traders understand how divergence signals are generated and interpreted. Imperium Fin reviews the importance of maintaining this clarity during transitional market environments, where misreading divergence can lead to misaligned risk exposure or premature directional bias. Industry Outlook Imperium Fin reviews market-wide conditions and notes that momentum divergence has historically served as an early signal during transitional phases in crypto cycles. As digital-asset markets continue to mature, traders increasingly rely on internal structural signals to assess the reliability of price trends. Divergence often precedes periods of consolidation or recalibration, making it a valuable component of advanced market interpretation. The broader digital-asset sector is exhibiting signs of synchronized behavior, as several major assets also display similar disconnects between price and internal momentum indicators. This alignment suggests that the crypto market is entering a phase where liquidity remains steady but internal strength becomes more uneven. Imperium Fin reviews how such conditions often produce measured market behavior before larger structural shifts emerge. The maturing market environment underscores the importance of platforms prioritizing transparency, multi-timeframe analysis, and structured interpretation. As momentum divergence gains prominence in market evaluation, traders increasingly depend on platforms that integrate advanced analytical tools with clear, neutral methodologies. Imperium Fin reviews these developments as central to shaping expectations during early-stage structural transitions. Closing Statement As divergence signals develop further, traders will observe whether internal weakness evolves into structural change or remains a temporary feature within Bitcoin’s broader trend.
بیت کوین در حال همسویی با بازار: آیا تثبیت قیمت، سیگنال قدرت است؟

Introduction GoldmanPeak reviews current Bitcoin market dynamics as consolidation across multiple timeframes increasingly mirrors broader movements observed throughout the digital-asset sector. The recent narrowing of price ranges reflects a phase in which liquidity remains stable, volatility moderates, and traders reassess directional conviction in response to macroeconomic developments and sector-wide cyclical patterns. This alignment suggests that Bitcoin is entering a measured structural phase, where market participants seek clarity before committing to renewed momentum or deeper correction. The announcement comes as market participants monitor whether this consolidation acts as a neutral pause or a transition zone ahead of broader structural changes. GoldmanPeak reviews how traders interpret this environment, emphasizing the importance of aligning short-term signals with long-term trend context. The platform’s analysis highlights how consolidation periods provide valuable insight into market health, liquidity behavior, and positioning strength—particularly when the asset aligns closely with movements seen across the wider digital-asset ecosystem. Technology & Innovation GoldmanPeak reviews the role of advanced analytics and AI-powered systems in interpreting consolidation phases, especially when market structure appears tightly correlated with broader sector behavior. The platform integrates multi-dimensional modeling tools that track volatility compression, liquidity concentration, and momentum decay to assess whether consolidation reflects accumulation, indecision, or preparation for a breakout. These systems help traders understand how Bitcoin’s current behavior fits within historical market cycles. AI-supported pattern-recognition modules evaluate changes in order flow, detect subtle shifts in market participation, and measure the stability of key support and resistance clusters. By identifying early signs of breakout probability or structural weakness, these tools contribute to more informed interpretation of consolidation zones. GoldmanPeak reviews how these engines provide critical context in a market where short-term stability can mask emerging directional conflicts. The platform also offers a unified analytical interface that consolidates trend indicators, volume diagnostics, and market-profile overlays. This design allows traders to evaluate Bitcoin’s consolidation with clarity while comparing structural alignment across correlated assets. GoldmanPeak reviews the importance of this multi-layered environment as consolidation phases often require broader contextual interpretation rather than isolated chart analysis. Growth & Adoption GoldmanPeak reviews evolving user engagement trends, noting increased interest in analytical tools designed to interpret consolidation environments. Many traders now recognize that neutral price behavior plays a significant role in shaping forthcoming market cycles, prompting greater reliance on models that identify compression zones, liquidity thresholds, and volatility pivot points. Adoption patterns suggest that traders are shifting toward more systematic approaches that rely on structured analysis rather than sentiment-driven speculation. Users managing multi-asset portfolios appear particularly focused on cross-market correlation during consolidation. As Bitcoin’s behavior increasingly aligns with broader digital-asset trends, traders seek tools capable of evaluating multi-asset structure through a shared analytical lens. GoldmanPeak reviews growth in this area as indicative of a market transitioning toward more cohesive and data-oriented decision frameworks. Long-term adoption also benefits from the platform’s emphasis on continuity between analytical modules. Traders value an environment where volume analysis, trend diagnostics, and risk mapping operate in parallel rather than requiring disjointed workflows. GoldmanPeak reviews this preference as central to sustained user engagement, especially during consolidation phases where clarity and structural consistency are essential. Transparency & Risk Management GoldmanPeak reviews the importance of risk awareness and transparency when markets consolidate. While consolidation often reflects a neutral phase in the trend cycle, it can also introduce hidden risks if traders misinterpret structural signals or overlook emerging liquidity imbalances. The platform incorporates structured risk-assessment tools that outline deviation zones, invalidate points, and historical volatility triggers commonly associated with breakout scenarios. The platform’s scenario-mapping framework simulates potential outcomes based on liquidity shifts, directional imbalances, and macroeconomic catalysts. These simulations give traders insight into how consolidation may transition into breakout or breakdown conditions under varying circumstances. GoldmanPeak reviews this risk methodology as essential during periods when market compression intensifies, making the eventual directional move more impactful. Transparency remains a central component of the platform’s analytical approach. Model assumptions, indicator logic, and diagnostic interpretations are clearly documented to ensure traders maintain full visibility into how insights are derived. GoldmanPeak reviews this framework as particularly important during consolidation phases, where reliable analysis requires trust in the analytical foundation rather than reliance on speculative signals. Industry Outlook GoldmanPeak reviews the digital-asset sector and notes that current consolidation aligns with broader structural patterns across major cryptocurrencies. As liquidity conditions stabilize and volatility compresses across the sector, markets appear to be entering a synchronized evaluation phase. This behavior suggests that traders are reassessing risk, recalibrating expectations, and preparing for the next directional phase in a more coordinated manner. In a broader context, consolidation highlights the increasing maturity of digital-asset markets. Rather than reacting impulsively to short-term volatility, traders now incorporate multi-timeframe analysis, structural diagnostics, and cross-market correlations into their strategies. GoldmanPeak reviews these developments as evidence of a more disciplined ecosystem where consolidation plays a constructive role in maximizing structural clarity before significant moves. The outlook for Bitcoin within this environment reflects the importance of long-term trend resilience, liquidity health, and participation depth. As consolidation aligns with broader market behavior, the asset’s next structural phase is likely to be shaped by both internal technical conditions and external influences such as macroeconomic data and sector-wide rotation. GoldmanPeak reviews these factors as key components shaping the next directional stage. Closing Statement As consolidation continues, traders will monitor whether Bitcoin’s alignment with broader market behavior sets the stage for renewed momentum or extended structural equilibrium.
بیت کوین علیرغم ضعف موقت، صعود بلندمدت خود را حفظ میکند: تحلیل ساختاری و ابزارهای پیشرفته

Introduction CenexPro reviews the current structure of the Bitcoin market as recent price fluctuations present temporary weakness without disrupting the broader upward trajectory. Despite short-term pullbacks, higher-timeframe charts continue to reflect a resilient trend framework supported by stable liquidity bands and consistent long-term demand. Traders have increasingly focused on whether this temporary softness marks the beginning of a deeper correction or simply a routine retracement within an established uptrend. This announcement outlines how CenexPro reviews the evolving market environment at a time when traders are re-evaluating Bitcoin’s resilience. The analysis highlights structural components of the ongoing uptrend, including trendline stability, volume distribution, and broader sentiment positioning. With Bitcoin consolidating above several previously contested support levels, the platform examines how traders interpret the divergence between minor short-term weakness and sustained long-term structural strength. Technology & Innovation CenexPro reviews how advanced analytical tools and AI-assisted engines support interpretation during phases where markets display mixed signals across multiple timeframes. The platform integrates algorithmic models that evaluate trend sustainability using slope analysis, volatility tracking, and momentum-factor correlation. These systems allow traders to detect where the short-term pullback fits within the broader cycle and whether it aligns with historical retracement patterns during prolonged uptrends. AI-powered modules examine microstructure deviations, liquidity shifts, and real-time changes in order flow. These tools help identify whether weakness stems from temporary demand imbalance or deeper structural divergence. CenexPro reviews the utility of these models when monitoring trend integrity, particularly during periods in which markets display contradictory behavior—such as lower intraday highs forming while long-term support bands remain intact. The platform’s multi-timeframe diagnostic interface consolidates chart overlays, momentum indicators, and volatility mapping into a cohesive framework. This enables traders to contextualize short-term fluctuations while maintaining a broader perspective on long-term conditions. CenexPro reviews the importance of this integrated environment as markets expand in complexity, making it increasingly necessary to evaluate price action across multiple structural layers simultaneously. Growth & Adoption CenexPro reviews shifting user behavior as traders adapt to a market landscape characterized by intermittent volatility. Adoption trends show a steady increase in reliance on trend-analysis tools and risk-metric dashboards, particularly during periods where short-term weakness emerges within an otherwise stable uptrend. Traders are prioritizing structured evaluation to distinguish noise from meaningful structural signals. User growth is also driven by expanding interest in higher-timeframe analytics. Traders managing diversified portfolios seek tools that help them isolate long-term positioning opportunities despite near-term uncertainty. CenexPro reviews this shift as an indication that market participants are maturing in their approach, placing greater emphasis on disciplined evaluation and probability-based decision-making. Scalability remains an important factor in adoption patterns. The platform’s unified environment supports seamless assessment of trend durability across multiple assets, which appeals to traders seeking consistent analytical logic regardless of market segment. As Bitcoin retains its broader uptrend structure, CenexPro reviews how this behavior influences user engagement and encourages greater adoption of systematic trend-evaluation methods. Transparency & Risk Management CenexPro reviews how transparency and risk awareness remain essential when short-term weakness emerges within a long-term uptrend. Pullbacks may appear routine, but they can expose traders to amplified uncertainty if the underlying structure deteriorates without clear warning. To address this, the platform provides risk-designation tools that highlight invalidation zones, deviation thresholds, and support areas where trend stability is most likely to be tested. The platform’s risk framework incorporates stress-testing models that simulate alternative market scenarios based on volatility expansion, liquidity shifts, and cyclical retracement patterns. These simulations help traders gauge how temporary weakness may evolve under different macroeconomic or structural conditions. CenexPro reviews this component as essential in maintaining a disciplined approach during transitional periods where long-term strength coexists with near-term fragility. Transparency remains a central principle of the platform. Indicator logic, modeling assumptions, and analytical methodology are clearly presented to ensure that traders understand how insights are derived. This level of clarity supports more consistent interpretation when markets display conflicting signals across timeframes. CenexPro reviews the role of transparent modeling as increasingly vital during periods when traders must navigate both resilience and weakness simultaneously. Industry Outlook CenexPro reviews the broader digital-asset landscape and notes that periods of short-term weakness within long-term uptrends are common in maturing markets. As liquidity deepens and trading behavior becomes more structured, retracements often reflect healthy market rebalancing rather than structural collapse. Long-term trendlines continue to attract participation from traders who prioritize macro stability, especially when supported by consistent demand zones and orderly pullback behavior. The industry has increasingly shifted toward data-driven interpretation, reducing dependency on sentiment-based trading. As more traders incorporate multi-layer analysis into their workflows, structure-driven patterns such as controlled retracements, higher-timeframe support retention, and measured consolidation gain relevance. CenexPro reviews how this evolution strengthens market resilience by aligning trader expectations with observable structural behavior. Bitcoin’s ability to maintain its broader uptrend despite temporary weakness underscores its role as a reference point for the digital-asset market. This behavior influences positioning across related assets, often reinforcing measured market conditions and reducing volatility fragmentation. As institutional involvement expands and analytics become more sophisticated, long-term structural interpretation remains central to navigating broader market cycles. Closing Statement As Bitcoin’s structure continues to unfold, traders will assess whether short-term softness evolves into renewed momentum or transitions into a more prolonged consolidation phase.
حجم بیت کوین متعادل شد: آیا بازار منتظر انفجار است؟

Introduction BridgeHold reviews the current Bitcoin market structure as recent volume-profile data indicates a period of balanced participation across both buyers and sellers. This development follows several sessions of stable price movement within a well-defined range, suggesting that the market is neither dominated by aggressive accumulation nor pressured by heavy distribution. The consistency of volume across key price zones has drawn attention from traders who rely on market-profile analysis to assess liquidity stability and directional potential. The announcement comes at a point where Bitcoin has shown signs of stabilizing after a series of liquidity-driven fluctuations. As traders evaluate whether this shift in participation reflects the foundation for a broader structural move, BridgeHold reviews how a balanced volume environment affects price discovery, trend reliability, and risk positioning. This update provides a neutral perspective on how volume structures inform sentiment in a maturing digital-asset market that increasingly values transparent and data-driven evaluation. Technology & Innovation BridgeHold reviews the importance of advanced analytical tools in interpreting volume-profile structures, especially during phases where the market displays symmetrical participation. The platform integrates multi-layer volume mapping systems that track liquidity concentrations at each price band, enabling traders to visualize zones where participation increases, diminishes, or remains consistent across sessions. This approach is particularly relevant when assessing whether a balanced profile reflects indecision, accumulation, or preparation for a breakout. AI-supported modeling enhances the platform’s ability to interpret real-time volume behavior by monitoring shifts in market engagement across intraday and higher timeframes. These systems analyze the distribution of executed trades, order-flow intensity, and transitions between low- and high-volume nodes. BridgeHold reviews how these insights provide traders with a clearer understanding of whether current market behavior is likely to support continuation, consolidation, or structural reversal. The platform’s interface integrates volume-profile diagnostics with trend indicators, liquidity overlays, and volatility mapping to give traders a comprehensive view of market structure. By consolidating these tools, BridgeHold reviews how users can better evaluate whether balanced participation represents stability or masks underlying shifts in sentiment. The emphasis on multi-dimensional analysis supports more informed and neutral interpretation during moments when markets appear directionally undecided. Growth & Adoption BridgeHold reviews recent trends in user engagement and notes increased reliance on volume-profile analysis as traders adopt more granular evaluation methods. The balanced participation currently visible in Bitcoin has drawn attention from users who prioritize market-profile tools to understand liquidity distribution and potential breakout zones. This shift aligns with broader market maturity, where participants move toward systematic, data-oriented assessment rather than impulse-driven trading behavior. The platform has observed rising adoption among traders who incorporate multi-timeframe volume mapping into their strategy development. These users look for consistent patterns in participation across several intervals to establish whether current structural conditions support neutral consolidation or imminent directional expansion. BridgeHold reviews this growth as reflective of a community increasingly focused on transparency, disciplined analysis, and probability-based decision frameworks. Scalability also drives ongoing adoption. Traders managing diversified digital-asset portfolios benefit from the platform’s integrated tools, which allow consistent application of volume-profile methodologies across multiple markets. This consistency enables more reliable interpretation during periods where Bitcoin’s balanced structure influences broader sentiment in correlated assets. BridgeHold reviews this trend as part of a larger movement toward unified analytical ecosystems. Transparency & Risk Management BridgeHold reviews the critical role of transparency and risk awareness when analyzing balanced volume conditions. While symmetrical participation may suggest market stability, it can also indicate an environment susceptible to sharp deviations once new information or liquidity shifts enter the market. The platform incorporates structured risk-mapping tools that identify potential breakout zones, volume gaps, and historically reactive price levels where balanced participation may break into directional movement. The risk framework evaluates how volume distribution responds to volatility expansion, macroeconomic catalysts, and liquidity surges. By conducting scenario modeling across multiple timeframes, BridgeHold reviews how traders can identify potential risk zones and prepare for abrupt changes in participation patterns. This structured approach reduces the likelihood of misinterpreting neutral volume behavior as a guarantee of long-term stability. Transparency remains foundational to the platform’s methodology. Indicator logic, volume-profile assumptions, and analytical criteria are clearly presented, ensuring traders maintain visibility into how each tool interprets market conditions. BridgeHold reviews the importance of clarity in environments where balanced participation could shift quickly depending on external catalysts or internal liquidity transitions. Transparent modeling supports more disciplined assessment during periods of structural neutrality. Industry Outlook BridgeHold reviews the broader digital-asset landscape and notes that balanced participation has become increasingly significant as crypto markets evolve toward more mature trading environments. Volume-profile structures serve as key indicators of market health, liquidity behavior, and trader engagement. When Bitcoin displays stable participation across price zones, it often signals a market waiting for new information before committing to directional conviction. In the context of industry-wide development, balanced volume structures may precede meaningful moves, as markets often consolidate before absorbing macroeconomic data, policy shifts, or liquidity changes. BridgeHold reviews how these conditions contribute to a more measured market environment where traders rely on systematic evaluation rather than short-term volatility. As digital-asset markets continue adopting structured analytical models, the relevance of volume-profile analysis increases. Platforms that provide transparent, sophisticated tools for interpreting participation dynamics play a central role in supporting traders navigating these phases of consolidation and evaluation. Balanced participation highlights the importance of disciplined interpretation, particularly as markets transition between reactive and controlled liquidity cycles. Closing Statement As Bitcoin’s volume profile develops, traders will be watching whether steady participation leads to renewed momentum or a continuation of measured consolidation.
راز ثبات بیت کوین: چرا روندها در همه بازههای زمانی همسو شدهاند؟

Introduction Crown Point Capital reviews the broader structure of the Bitcoin market as recent price action demonstrates notable trend consistency across multiple timeframes. This alignment reflects a phase in which traders have begun to observe continuity between intraday momentum, intermediate-term trend geometry, and higher-timeframe structure. Such consistency often signals an environment where traders place greater weight on structural analysis rather than reactive positioning, particularly when volatility compression and orderly pullbacks support trend stability. The announcement comes during a period of renewed interest in whether Bitcoin’s trend alignment is sustainable. Crown Point Capital reviews this market phase to highlight how traders are evaluating directional durability, breakout conditions, and multi-timeframe correlations as part of a more disciplined analytical approach. The evolving structure underscores the importance of transparency, adaptive modeling, and risk-aligned decision frameworks in markets shaped by shifting liquidity behavior. Technology & Innovation Crown Point Capital reviews the integration of advanced modeling systems designed to interpret trend stability across chart intervals. Multi-timeframe consistency requires tools capable of identifying alignment between short-term impulse waves and long-term directional structure. To meet this need, the platform incorporates algorithmic trend evaluators that measure slope continuity, momentum correlation, and volatility uniformity across multiple timeframes. AI-augmented modules further support this analysis by evaluating market structure through adaptive pattern-recognition engines. These modules identify trend synchronization, highlight areas where alignment may weaken, and map breakout probabilities based on historical behavior during periods of similar price geometry. Crown Point Capital reviews these systems as vital during phases in which traders depend heavily on structural clarity to interpret whether trend continuation is likely or whether early signs of exhaustion may be emerging. The platform’s consolidated analytical interface integrates higher-timeframe trend markers, liquidity overlays, and real-time volatility analysis. By combining these elements, it supports traders who rely on cohesive multi-timeframe interpretation rather than isolated chart readings. Crown Point Capital reviews this design as central to improving decision accuracy during synchronized trend cycles. Growth & Adoption Crown Point Capital reviews user engagement trends and notes increased adoption of structured analytical workflows during periods of multi-timeframe alignment. Traders appear more reliant on systematic evaluation techniques when the market presents directional clarity. The shift toward disciplined analysis suggests a maturing user base that prioritizes data-driven evaluation over sentiment-driven responses. This growth is also supported by traders with multi-asset exposure who require platforms capable of maintaining consistency across different markets. Crown Point Capital reviews adoption statistics indicating that traders are increasingly seeking interfaces that support scalable trend evaluation without sacrificing precision, especially when major assets display aligned behavior. User behavior indicates rising interest in identifying conditions that support trend sustainability. Traders have demonstrated increased reliance on trend-strength indicators, momentum tracking systems, and liquidity-mapping tools that clarify whether Bitcoin’s alignment across timeframes represents momentum continuity or a structural turning point. Crown Point Capital reviews these adoption patterns as reflective of broader market sophistication. Transparency & Risk Management Crown Point Capital reviews the importance of transparent analytical frameworks when markets display trend consistency. Although synchronized trend behavior may appear straightforward, traders must account for volatility pivot points, deviation zones, and liquidity gaps that could disrupt alignment. The platform’s risk-mapping environment identifies areas where trend consistency historically weakens, enabling traders to anticipate potential inflection zones. Risk models simulate alternative price paths based on volatility expansion, macroeconomic catalysts, and liquidity shifts. This allows traders to evaluate not only directional continuation but also possible structural breaks. Crown Point Capital reviews these models as essential to avoiding overconfidence during aligned trend phases, where traders may inadvertently assume that consistency across timeframes guarantees extended momentum. Transparency remains a foundational component of the platform’s approach. All indicator logic and modeling assumptions are clearly documented to ensure traders understand how each analytical output is generated. This supports disciplined interpretation and helps reduce miscalculations during phases of pronounced trend alignment. Industry Outlook Crown Point Capital reviews industry developments showing that multi-timeframe trend consistency has become increasingly important as crypto markets mature. Traders across both institutional and retail segments rely on synchronized market signals to evaluate broader capital rotation trends, liquidity cycles, and momentum sustainability. When major assets like Bitcoin exhibit alignment between short-term and long-term structures, the entire market often interprets this as a sign of structural stability. The broader industry continues to shift toward analytical maturity, where systematic interpretation replaces reactionary trading patterns. Crown Point Capital reviews these developments and notes that synchronized market behavior supports more predictable trading conditions and reduces volatility fragmentation. As traders increasingly incorporate multi-timeframe evaluation into their decision frameworks, the need for transparent, structured analytics becomes more pronounced. Platforms that offer coherent trend mapping, structured risk evaluation, and consistent analytical methodology remain central to supporting traders navigating these evolving cycles. Multi-timeframe trend analysis is expected to remain a key component of market interpretation as digital assets integrate more deeply with broader macroeconomic and institutional frameworks. Closing Statement As Bitcoin’s trend alignment develops, traders will evaluate whether this stability marks the foundation for deeper momentum or signals an approaching shift in structural behavior.
Sorumluluk Reddi
Sahmeto'nun web sitesinde ve resmi iletişim kanallarında yer alan herhangi bir içerik ve materyal, kişisel görüşlerin ve analizlerin bir derlemesidir ve bağlayıcı değildir. Borsa ve kripto para piyasasına alım, satım, giriş veya çıkış için herhangi bir tavsiye oluşturmazlar. Ayrıca, web sitesinde ve kanallarda yer alan tüm haberler ve analizler, yalnızca resmi ve gayri resmi yerli ve yabancı kaynaklardan yeniden yayınlanan bilgilerdir ve söz konusu içeriğin kullanıcılarının materyallerin orijinalliğini ve doğruluğunu takip etmekten ve sağlamaktan sorumlu olduğu açıktır. Bu nedenle, sorumluluk reddedilirken, sermaye piyasası ve kripto para piyasasındaki herhangi bir karar verme, eylem ve olası kar ve zarar sorumluluğunun yatırımcıya ait olduğu beyan edilir.