MyNewTrading
@t_MyNewTrading

Ne tavsiye etmek istersiniz?
önceki makale
پیام های تریدر
filtre
sinyal türü
MyNewTrading
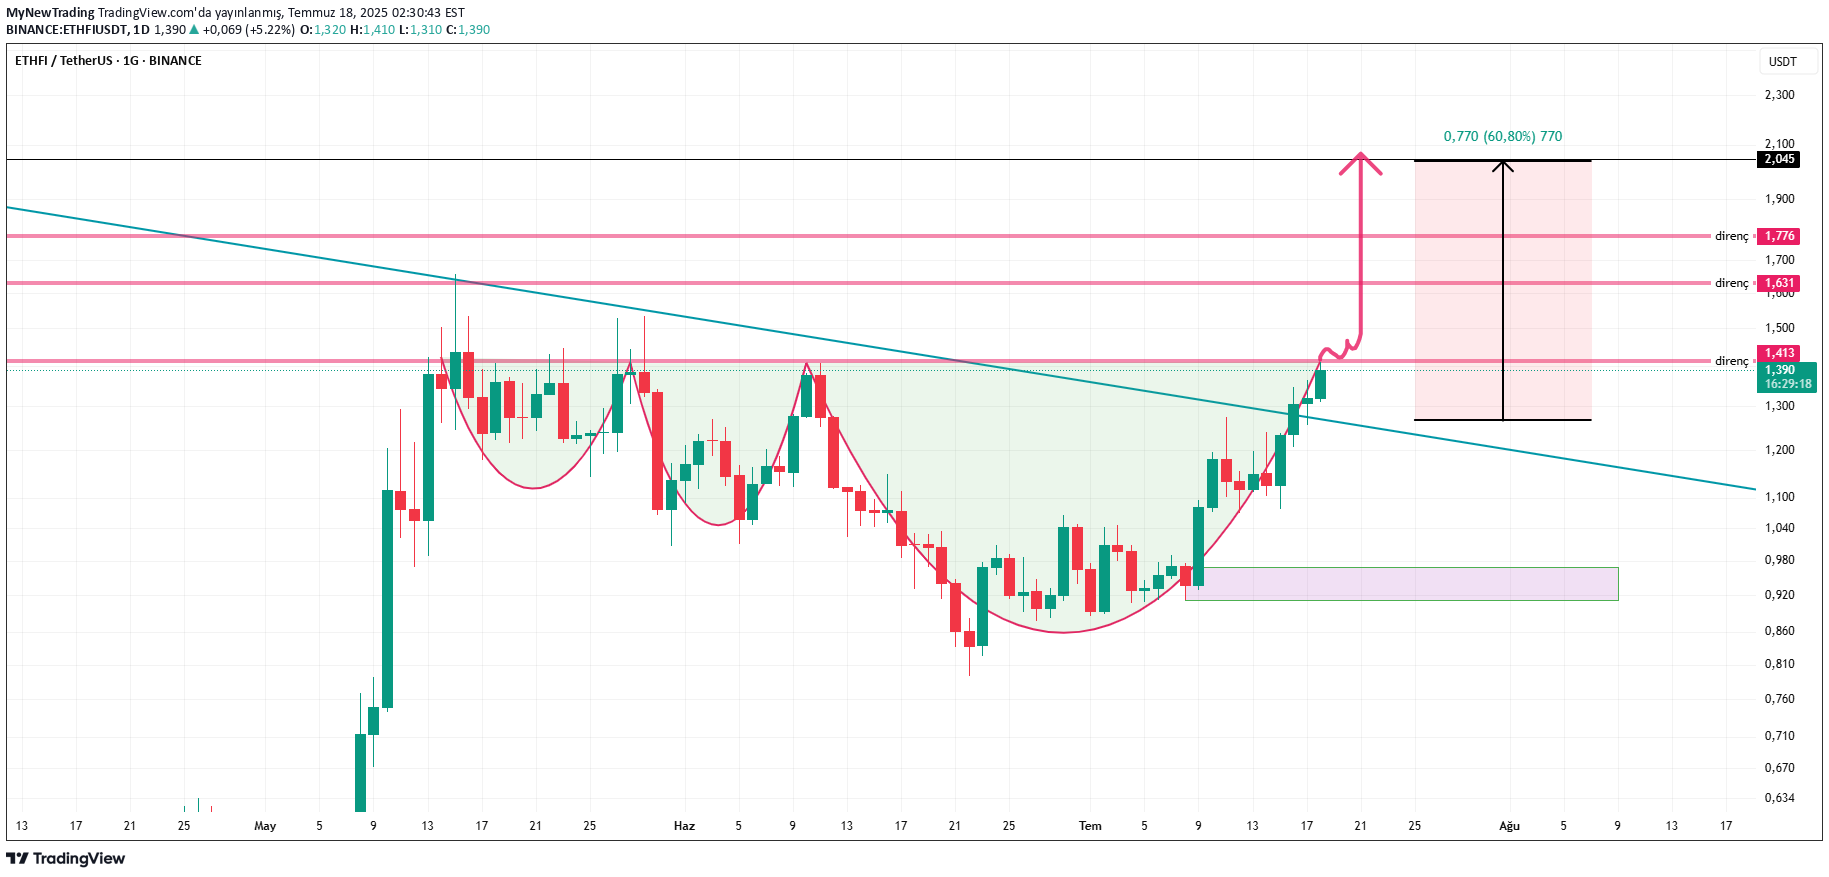
Formasyon: Adam & Eve Durum: Düşen kırılımı sonrası boyun çizgisi (1.413) test ediliyor. Şart: 1.413 üzeri kalıcılık Hedef: 2.045 YTD. ENGLSIH: Formation: Adam & Eve Status: Testing the neckline (1,413) after the downward breakout. Condition: Staying above 1,413 Target: 2,045. Not investment advice.
MyNewTrading
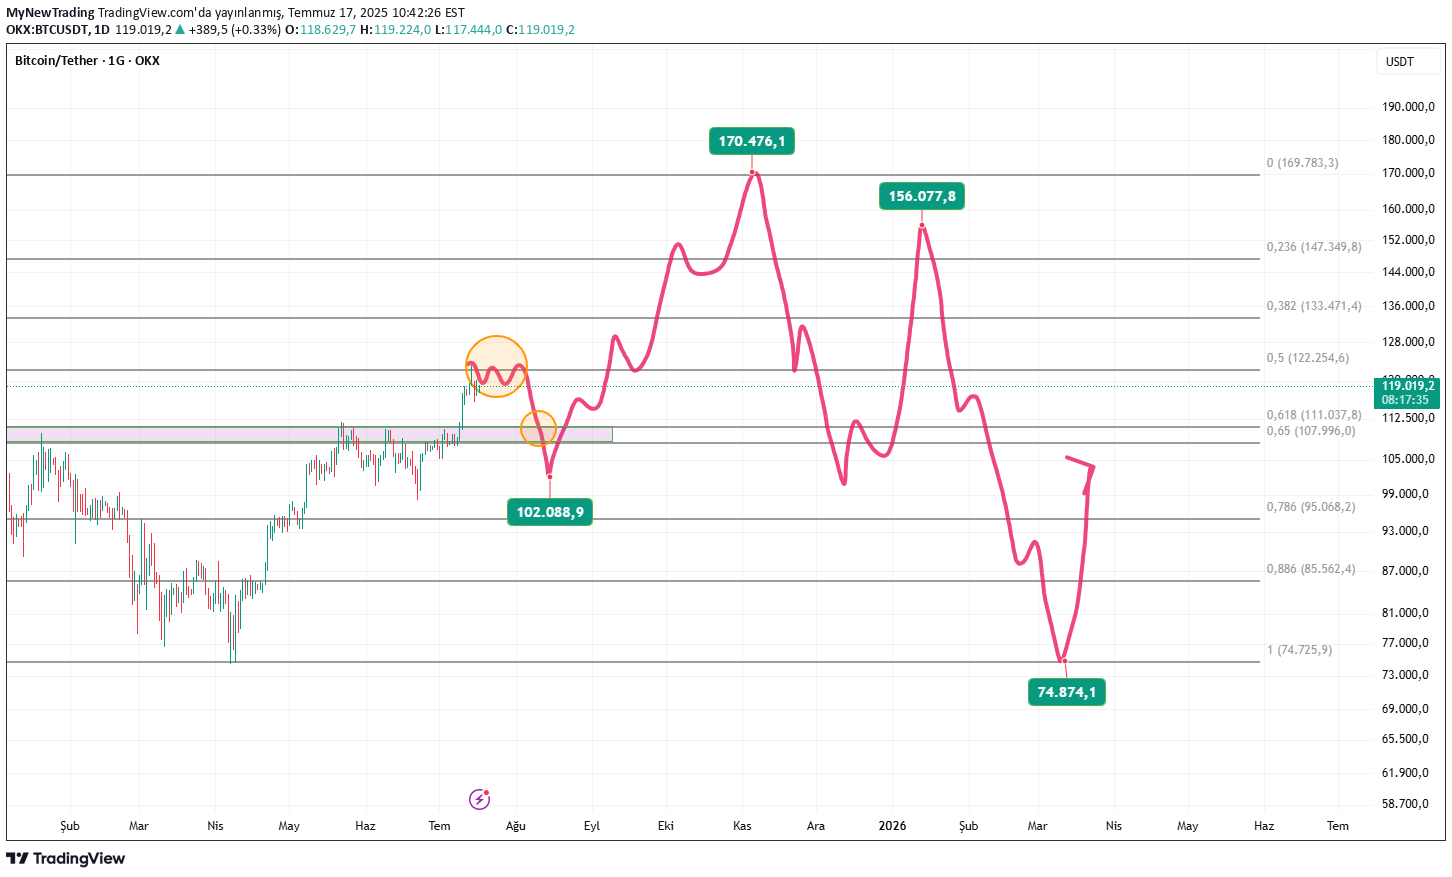
TÜRKÇE: 📉 BTCUSDT Teknik Senaryo, 2026 mart ayına kadar. 118.000-122.000 bandında güçlü dirençle karşılaşan BTC, bu bölgede bir süre yatay seyir gösterebilir. Bu süreçte oluşan Baş - Omuz - Baş (BOB) formasyonunun retesti derin olabilir. Bu retest sonrası fiyatın 102.000 seviyelerine kadar geri çekilmesi muhtemel. Orta vadede yeniden güç toplayarak 170.000 seviyelerine kadar yeni zirve denemesi görülebilir. Ancak uzun vadede satış baskısıyla 75.000 seviyelerine kadar sert düzeltme ihtimali korunuyor. 🔄 Volatilite yüksek, risk yönetimi kritik önemde. 📌 Yatırım tavsiyesi değildir. ENGLISH: 📉 BTCUSDT Technical Scenario, Until March 2026. Encountering strong resistance in the 118,000-122,000 range, BTC may trend sideways in this region for a while. The Head-Shoulders-Head (BOB) formation that formed during this period may have a deep retracement. Following this retracement, the price is likely to retreat to 102,000. In the medium term, it may regain strength and attempt a new peak of 170,000. However, in the long term, a sharp correction to 75,000 remains possible due to selling pressure. 🔄 Volatility is high, and risk management is critical. 📌 Not investment advice.
MyNewTrading
MyNewTrading
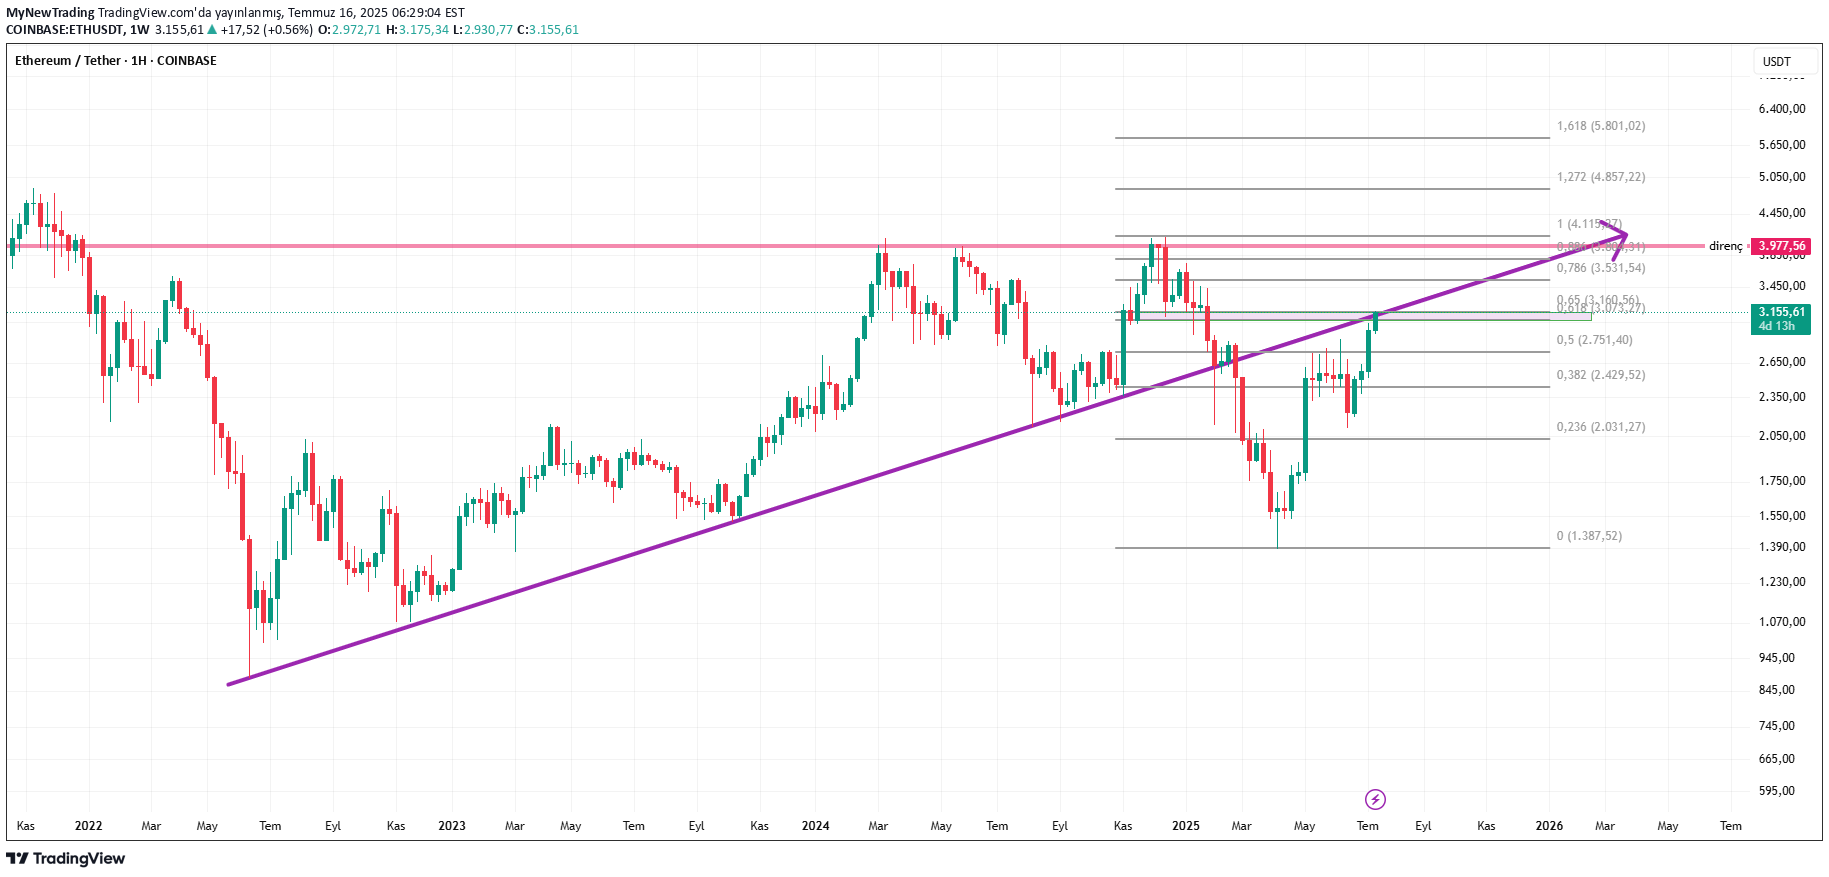
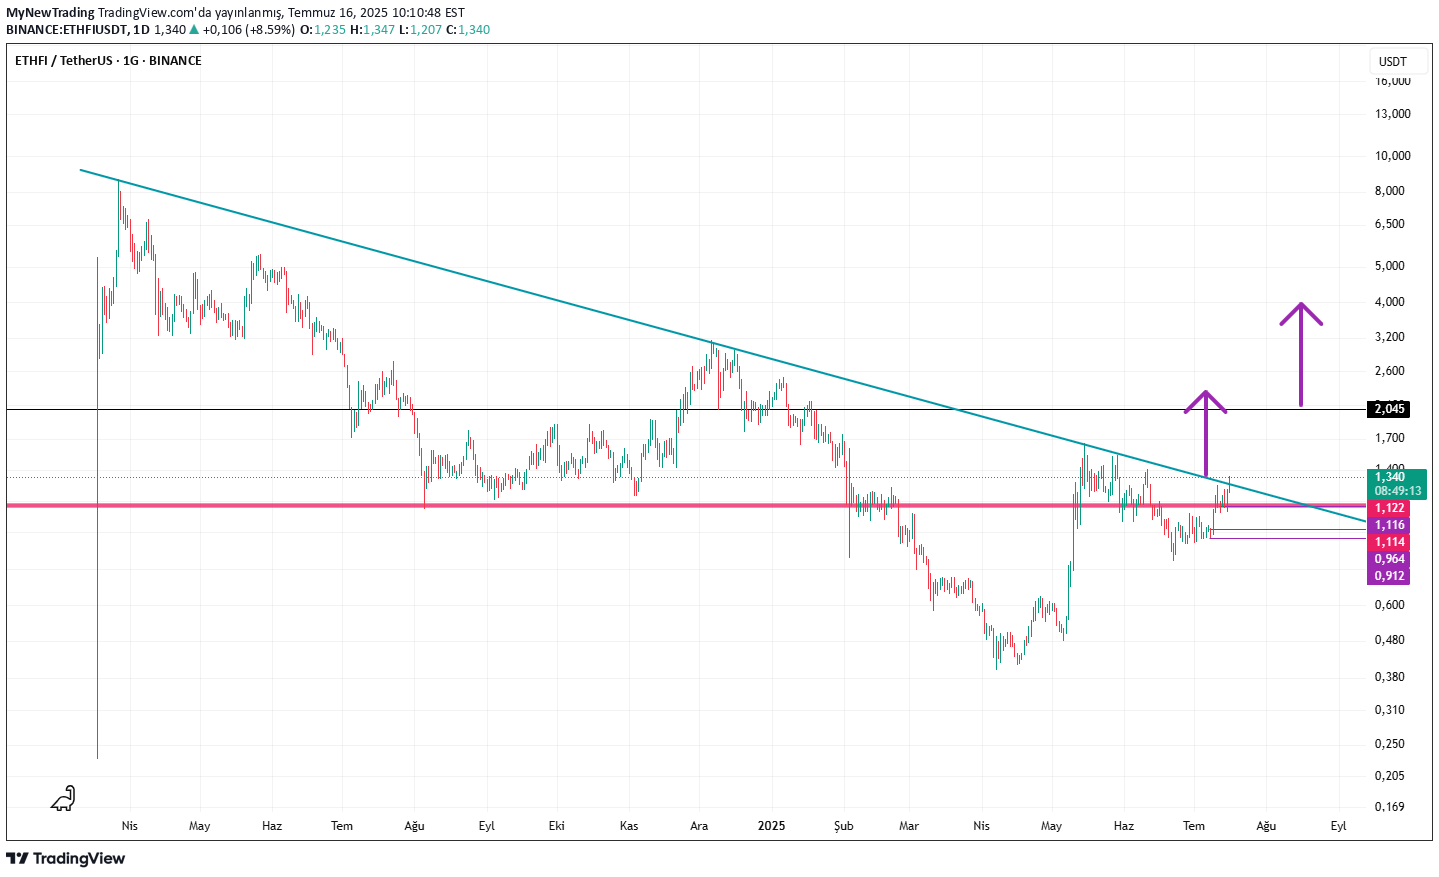
TÜRKÇE: Haftalık grafikte retest bölgesinde, yukarısında haftalık mumlar kapatamsı halinde yükseliş beklenir. Yukarıdan aşağı Fibonacci çektiğinde (yani düşüş yönlü): Golden Pocket seviyesi: 0.618 - 0.65 aralığıdır. Fiyat yükselirse bu seviyeler direnç olarak çalışır. Yani fiyat geri dönerken bu seviyeye kadar çıkabilir ve orada reddedilme ihtimali yüksektir. ENGLISH: If the weekly candles close above the retracement zone on the weekly chart, a rise is expected. When there is a Fibonacci retracement from above (i.e., bearish): Golden Pocket level: 0.618 - 0.65. If the price rises, these levels act as resistance. In other words, the price could rise to this level on a retracement, and rejection is likely there.
MyNewTrading
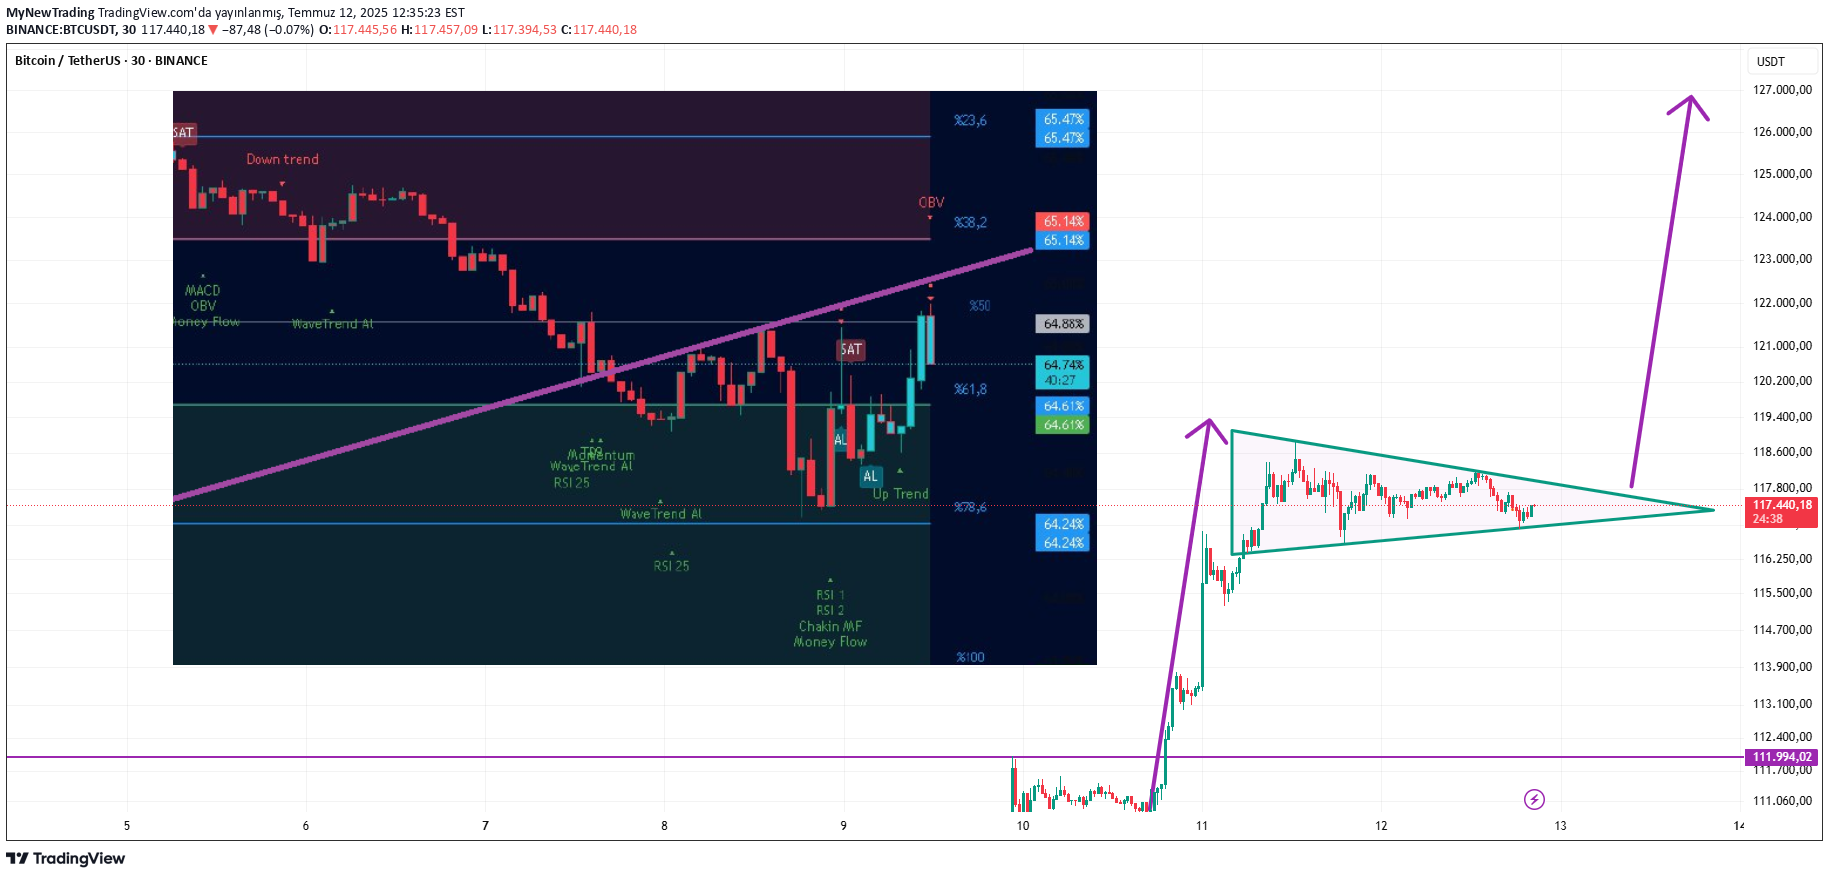
TÜRKÇE : 📈 Güncel Bitcoin Analizi ve Dominans Yorumu Grafikte Bitcoin'de kısa vadeli bir boğa bayrağı formasyonu gözleniyor. Formasyonun teknik hedefi yaklaşık 126.000 USDT seviyesidir. Sağ taraftaki formasyon kırılımı yukarı yönlü olursa, hedefe doğru güçlü bir hareket beklenebilir. Sol üstteki grafik ise Bitcoin Dominansı’nın 1D (1 Günlük) görünümüdür. Dominans şu anda önemli bir direnç bölgesinde. Eğer bu bölgede yatay seyir izleyip aşağı yönlü bir kırılım gerçekleşirse, bu durum altcoinler için pozitif bir senaryo yaratır ve altcoinlerde ciddi primlenmeler görebiliriz. Ancak, Bitcoin yükselişine devam ederken Dominans da direnç bölgesini kırarak yükselirse, altcoinlerin Bitcoin karşısında ezilme ihtimali azalır. Bu senaryo, piyasa açısından dengeli bir yükseliş anlamına gelir. 🚨 Dikkat edilmesi gereken en olumsuz senaryo: Bitcoin fiyatının düşüşe geçerken, Dominans'ın direnç bölgesini yukarı kırması. Bu durumda hem Bitcoin düşer hem de altcoinlerde çok daha derin geri çekilmeler görülebilir. Bu, bizim için en istenmeyen senaryodur. ENGLİSH : 📈 Current Bitcoin Analysis and Dominance Commentary The chart shows a short-term bull flag formation for Bitcoin. The technical target of the formation is approximately 126,000 USDT. If the formation on the right breaks to the upside, a strong move towards the target can be expected. The upper left chart is the 1D (1-Day) view of Bitcoin Dominance. Dominance is currently in a key resistance zone. If it continues trading sideways in this zone and breaks downwards, this could create a positive scenario for altcoins, and we could see significant gains in altcoins. However, if Bitcoin continues its rise and the Dominance breaks through the resistance zone, the likelihood of altcoins being crushed by Bitcoin decreases. This scenario suggests a balanced rise for the market. 🚨 The most negative scenario to consider: Bitcoin price declines while the Dominance breaks above the resistance zone. In this case, both Bitcoin and altcoins could see a much deeper pullback. This is the most undesirable scenario for us.
Sorumluluk Reddi
Sahmeto'nun web sitesinde ve resmi iletişim kanallarında yer alan herhangi bir içerik ve materyal, kişisel görüşlerin ve analizlerin bir derlemesidir ve bağlayıcı değildir. Borsa ve kripto para piyasasına alım, satım, giriş veya çıkış için herhangi bir tavsiye oluşturmazlar. Ayrıca, web sitesinde ve kanallarda yer alan tüm haberler ve analizler, yalnızca resmi ve gayri resmi yerli ve yabancı kaynaklardan yeniden yayınlanan bilgilerdir ve söz konusu içeriğin kullanıcılarının materyallerin orijinalliğini ve doğruluğunu takip etmekten ve sağlamaktan sorumlu olduğu açıktır. Bu nedenle, sorumluluk reddedilirken, sermaye piyasası ve kripto para piyasasındaki herhangi bir karar verme, eylem ve olası kar ve zarar sorumluluğunun yatırımcıya ait olduğu beyan edilir.