
ManiMarkets
@t_ManiMarkets

Ne tavsiye etmek istersiniz?
önceki makale
پیام های تریدر
filtre
ManiMarkets
طلا (XAUUSD) رکورد شکست! هدف بعدی: ۴۴۰۰ دو قله!

🚀 XAUUSD: Altının Yeniden Dirilen Rallisi Kilit Seviyeyi Kırdı, 4400 Çift Zirve Görünüyor! Zaman Aralığı: 4 Saatlik Grafik 4 saatlik grafikte Altın (XAUUSD) şu anda olağanüstü bir yükseliş momentumu sergiliyor ve 4.220 $ civarında güçlü bir şekilde işlem görüyor. Değerli metal, tarihsel olarak önemli bir fiyat bölgesini kararlı bir şekilde kırarak güçlü bir toparlanma gerçekleştirdi ve güçlü bir alıcı inancının sinyalini verdi. Güncel Fiyat Hareketi ve Trend Analizi: Altın, Ekim ortasında '4400'de Çift Tepe' oluşturduktan ve ardından 3900 'Acil Destek' bölgesinde önemli destek bulan keskin bir düşüş yaşadıktan sonra dikkat çekici bir yükseliş yoluna girdi. Fiyat mevcut rallisini bu güçlü temelden başlattı ve sistematik olarak kaybettiği zemini geri kazandı. İlk önce (daha önce kırılmış olan) 4000 'Anahtar Bölge'nin üzerine çıktı ve sağlıklı bir geri çekilme ve yükselişin ardından 4100'ü 'Yeni Destek' olarak belirleyerek konumunu sağlamlaştırdı. En önemlisi, XAUUSD şu anda başarılı bir şekilde deldi ve 'Önceki Destek' olarak etiketlenen 4150 ila 4250 bölgesinin üzerinde işlem görüyor. Bu bölge önemliydi; Başlangıçta destek görevi gördü, kırıldıktan sonra dirence dönüştü ve şimdi tekrar aşıldı, bu da kontrolde güçlü bir değişime işaret ediyor. white oku bu belirleyici kırılmayı açıkça gösteriyor. Bu güçlü, çok çubuklu yükseliş, boğaların sıkı bir kontrole sahip olduğunu ve önceki düşüş yapısının etkili bir şekilde tersine döndüğünü gösteriyor. Temel Direnç Seviyeleri: 4150 ila 4250 Önceki Destek (artık direnç olarak kırılıyor): 'Önceki Destek' olarak işaretlenmiş olsa da white oku, bunun artık yukarıya doğru kırıldığını ve esasen ilk kırılmadan sonra oluşan önemli bir direnç bariyerinin aşıldığını gösteriyor. Bu bölgenin üzerinde sürekli bir tutunma çok önemlidir. 4400'de çift tepe: Bu, önceki tüm zamanların en yüksek seviyesini temsil eder ve nihai, önemli psikolojik ve teknik engeldir. Mevcut momentum göz önüne alındığında, bu seviye yükseliş eğiliminin bir sonraki major hedefi olacak. Temel Destek Seviyeleri: 4100 Yeni Destek: Güçlü yükseliş ve kırılmanın ardından bu seviye, kritik acil destek olarak belirlendi. Burada yeniden test ve başarılı bir tutunma, devam eden yükseliş momentumu için sağlıklı bir konsolidasyon olacaktır. 4000 Anahtar Bölge Kırıldı: Daha önce yukarıdan kırıldıktan sonra direnç görevi gören bu bölge, artık güçlü bir ikincil destek olarak duruyor. Bu önemli bir psikolojik ve teknik düzeydir. 3900 Acil Destek: Bu düz yeşil bölge, mevcut rallinin fırlatma rampası görevi gördü ve en güçlü temel desteği temsil ediyor. Daha geniş yükseliş trendini sürdürmek için hayati önem taşıyor. Boğa Senaryosu: Altının görünümü şu anda yüksek oranda yükselişe işaret ediyor. XAUUSD, 4150 ila 4250 'Önceki Destek' bölgesinin üzerindeki konumunu koruyabildiği ve herhangi bir küçük geri çekilmede ideal olarak 4100 'Yeni Desteği' koruyabildiği sürece, '4400'de Çift Tepe'ye doğrudan meydan okumanın yolu açık. Artan satın alma hacmi ve daha yüksek seviyelerdeki kapanışların devam etmesi, bu güçlü yükseliş gidişatını daha da güçlendirecektir. Ayı Senaryosu: Mevcut güce rağmen keskin bir dönüş meydana gelebilir. 4100 'Yeni Desteğin' altındaki belirleyici bir kırılma, ilk önemli uyarıcı işaret olacaktır. Bu, 4000 'Anahtar Bölge'nin yeniden test edilmesine yol açabilir. 4000'in altındaki bir kırılma, 3900 'Acil Destek'e doğru daha derin bir düzeltmeye işaret edecek ve mevcut kısa vadeli yükseliş tezini ciddi şekilde tehlikeye atacaktır. Sonuç: Altın şu anda güçlü bir yükseliş trendinde ve 4150 ile 4250 arasındaki kritik bölgeyi kararlı bir şekilde kırdı. Momentum boğaların yönünde ve '4400'deki çift tepe' bir sonraki zorlu hedef. Yatırımcıların sürdürülebilir güç için 4100 'Yeni Desteğini' yakından izlemesi gerekiyor, ancak şimdilik en az direncin yolu yukarıya doğru görünüyor. Yasal Uyarı: Bu tabloda verilen bilgiler yalnızca eğitim ve bilgilendirme amaçlıdır ve yatırım tavsiyesi olarak değerlendirilmemelidir. Ticaret ve yatırım önemli riskler içerir ve her yatırımcı için uygun değildir. Herhangi bir yatırım kararı vermeden önce mali durumunuzu dikkatle değerlendirmeli ve bir mali müşavirle görüşmelisiniz. Bu grafiğin yaratıcısı herhangi bir spesifik sonucu veya kârı garanti etmez ve bu bilgilerin kullanılması sonucunda ortaya çıkan hiçbir zarardan sorumlu değildir. Geçmiş performans gelecekteki sonuçların göstergesi değildir. Bu bilgileri kullanmak kendi sorumluluğunuzdadır. Bu grafik Ticaret ve Yatırım Analizi konusunda kendimi geliştirmek için oluşturulmuştur. Lütfen herhangi bir yatırım yapmadan önce kendi analizinizi yapın.
ManiMarkets
سولانا در خطر سقوط: آیا حمایت ۱46-148 تاب میآورد؟

📉 SOLUSD: Kilit Bölgenin Altında Düşüş Trendiyle Mücadele - 146-148 Odak Noktasında Destek! Zaman Aralığı: 4 Saatlik Grafik Giriş: Solana (SOLUSD) 4 saatlik grafikte hakim düşüş eğilimini yansıtmaya devam ediyor ve şu anda 153,97 dolar civarında işlem görüyor. Fiyat, kritik direnç seviyelerinin üzerinde sürekli bir toparlanma sağlayamayarak sürekli bir düşüş trendine yakalandı. Güncel Fiyat Hareketi ve Trend Analizi: Solana Ekim sonundaki zirvesinden bu yana önemli bir satış baskısı altındaydı ve bir dizi düşük yüksek ve düşük dipler aracılığıyla gözle görülür net bir düşüş trendi oluşturdu. Belirgin bir red alçalan trend çizgisi sürekli olarak dinamik bir direnç görevi görerek boğaların daha yükseğe çıkma yönündeki birçok girişimini reddetti. Son zamanlarda SOLUSD, 160 ila 165 'Anahtar Bölge'ye ulaşarak bir toparlanma girişiminde bulundu, ancak hem bu bölgeden hem de 10-11 Kasım civarında alçalan trend çizgisinden güçlü bir reddedilmeyle karşılaştı. Bu reddedilme, fiyatı tekrar aşağı itti ve şu anda doğrudan genel direnç olarak işlev gören 160-165 'Anahtar Bölge'nin altında konsolidasyona giriyor. Fiyat şu anda 146 ila 148 destek alanının üzerinde riskli bir şekilde işlem görüyor. Bu aralıkta potansiyel kısa vadeli bir tabana işaret eden bazı sıçramalar görüldü, ancak alçalan trend çizgisinin genel bağlamı ve 160-165 'Anahtar Bölge'nin geri alınamaması, düşüş baskısının hakim olmaya devam ettiğini gösteriyor. Temel Direnç Seviyeleri: Azalan Red Trend Çizgisi: Bu dinamik trend çizgisi en acil ve önemli engeldir. Bunun üzerinde bir kırılma, momentumdaki herhangi bir değişim için çok önemli olacaktır. 160 ila 165 Anahtar Bölge: Bu alanın daha önce destek görevi gördükten sonra güçlü bir direnç olduğu kanıtlandı. Boğalar için bu bölgenin kararlı bir şekilde geri kazanılması çok önemlidir. 175 Önceki Destek: Bir zamanlar destek seviyesi olan seviye artık daha zorlu bir direnç olarak duruyor, mevcut işlem aralığının üzerinde bulunuyor ve aşılması için önemli bir yükseliş gücü gerektiriyor. 190 ila 195 Temel Direnç: Bu bölge mevcut major düşüş trendinin kökenini temsil ediyor ve çok güçlü bir uzun vadeli direnç olmaya devam ediyor. Temel Destek Seviyeleri: 146 ila 148: Bu gri band şu anda test edilen acil destek bölgesidir. Bu seviyenin altındaki bir kırılma, düşüş eğiliminin devamını doğrulayabilir. 135: 146-148 desteğinin başarısız olması durumunda 135 seviyesi bir sonraki önemli aşağı yönlü hedef olarak belirleniyor. Bu, daha derin bir satışı önlemek için hayati önem taşıyan kritik bir psikolojik ve teknik desteği temsil ediyor. Boğa Senaryosu: SOLUSD'nin anlamlı bir yükseliş eğilimi göstermesi için öncelikle alçalan red trend çizgisinin üzerinde kararlı bir şekilde kırılması ve aynı zamanda inanç ve artan hacimle 160 ila 165 'Anahtar Bölge'yi geri kazanması gerekiyor. Bu kombinasyonun üzerinde sürdürülebilir bir move, 175 'Önceki Destek'e (şimdiki dirence) meydan okumanın yolunu açacaktır. Ayı Senaryosu: Mevcut teknik yapı büyük ölçüde devam eden düşüş eğilimini destekliyor. 160 ila 165 'Anahtar Bölge'nin geri alınamaması ve alçalan trend çizgisinin reddedilmeye devam edilmesi, muhtemelen 146 ila 148 destek alanının altında kesin bir kırılmaya yol açacaktır. Bu acil desteğin kırılması satış baskısını hızlandıracak ve bir sonraki major aşağı yönlü hedef olarak 135 seviyesini hedefleyecektir. Sonuç: Solana kritik bir kavşakta, açık bir düşüş trendi içinde mücadele ediyor ve güçlü bir genel dirençle karşı karşıya. Acil savaş, tavan görevi gören 160-165 'Anahtar Bölge' ve geçici destek sağlayan 146-148 alanı üzerinde yoğunlaşıyor. Yatırımcıların bu seviyeleri yakından izlemesi gerekiyor; Her iki yönde de kesin bir kırılma Solana'nın kısa vadeli gidişatını muhtemelen belirleyecektir. Yasal Uyarı: Bu tabloda verilen bilgiler yalnızca eğitim ve bilgilendirme amaçlıdır ve yatırım tavsiyesi olarak değerlendirilmemelidir. Ticaret ve yatırım önemli riskler içerir ve her yatırımcı için uygun değildir. Herhangi bir yatırım kararı vermeden önce mali durumunuzu dikkatle değerlendirmeli ve bir mali müşavirle görüşmelisiniz. Bu grafiğin yaratıcısı herhangi bir spesifik sonucu veya kârı garanti etmez ve bu bilgilerin kullanılması sonucunda ortaya çıkan hiçbir zarardan sorumlu değildir. Geçmiş performans gelecekteki sonuçların göstergesi değildir. Bu bilgileri kullanmak kendi sorumluluğunuzdadır. Bu grafik Ticaret ve Yatırım Analizi konusunda kendimi geliştirmek için oluşturulmuştur. Lütfen herhangi bir yatırım yapmadan önce kendi analizinizi yapın.
ManiMarkets
ایکسآرپی در آستانه انفجار: کلید رسیدن به ۲.۷۰۰ کجاست؟
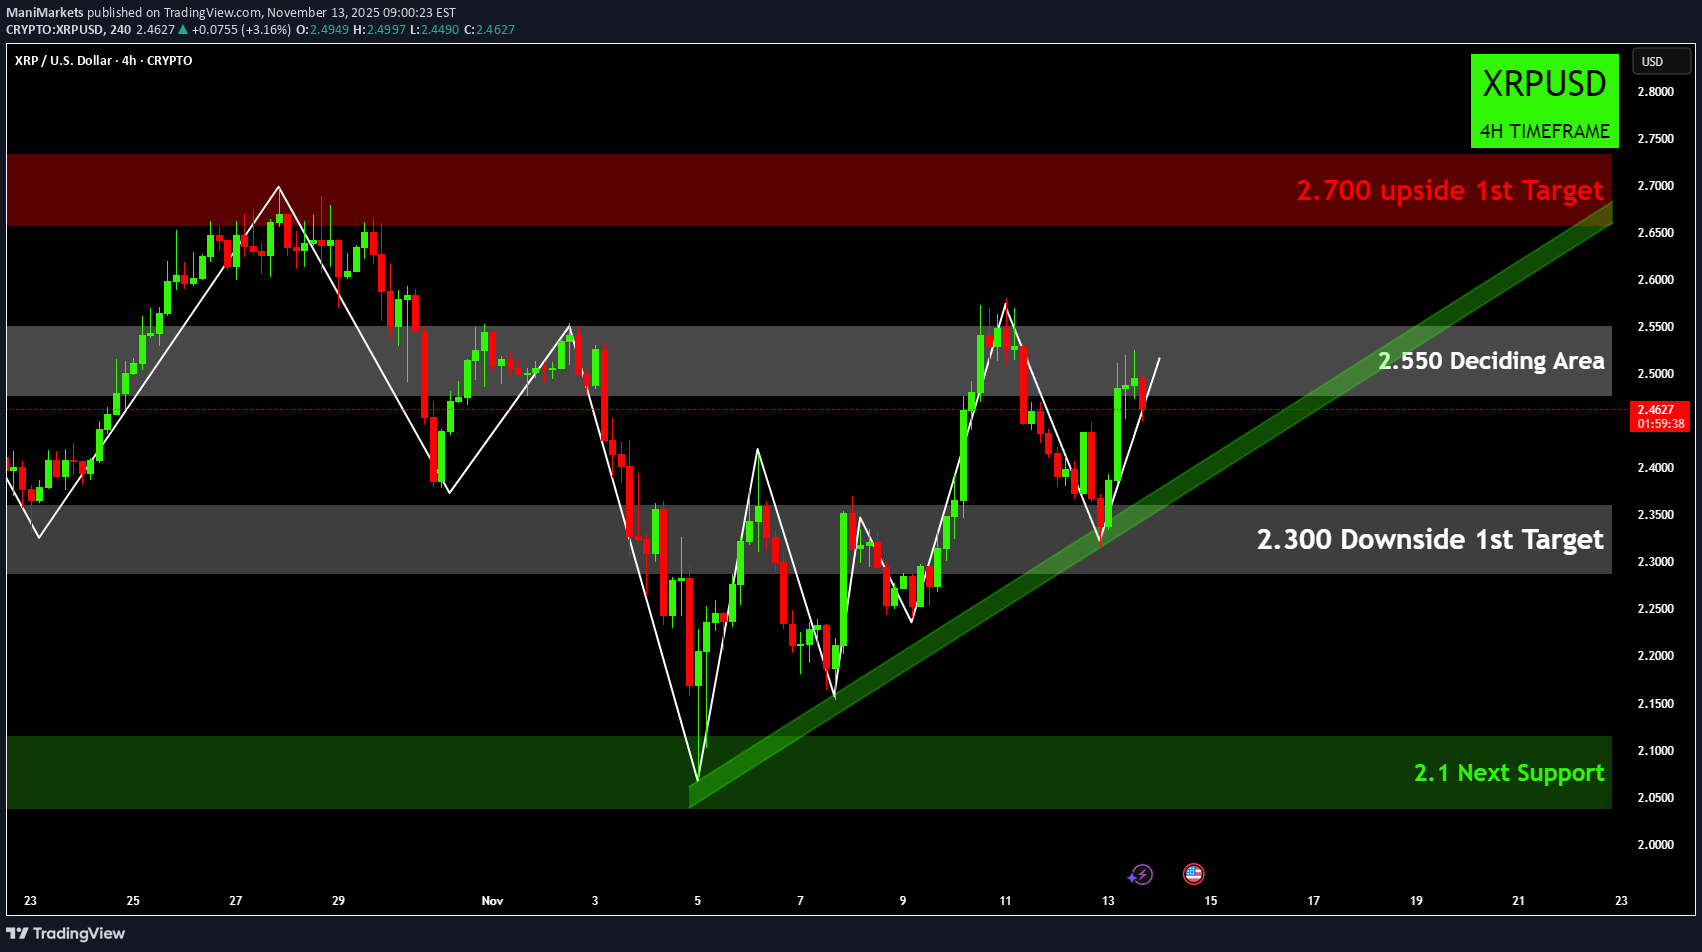
📈 XRPUSD: Oyunda Yükselen Üçgen – 2.700'ü Hedefliyor Ama 2.550 Anahtar! Zaman Aralığı: 4 Saatlik Grafik 4 saatlik grafikte Ripple (XRPUSD) şu anda 2,458 dolar civarında işlem görüyor ve büyüleyici bir konsolidasyon modeli gösteriyor. Fiyat, güçlü bir yükselen trend çizgisi tarafından desteklenirken kritik bir "Karar Alanında" seyrediyor ve potansiyel olarak anlamlı bir move için zemin hazırlıyor. Güncel Fiyat Hareketi ve Trend Analizi: XRPUSD, Kasım ayı başında 2,1 seviyesi civarında güçlü bir temel bulmasından bu yana yukarı yönlü bir konsolidasyon sürecinde. Bu toparlanma, dinamik destek görevi gören yükselen yeşil trend çizgisiyle açıkça gösterilen daha yüksek diplerle karakterize ediliyor. Son zamanlarda fiyat bu trend çizgisinden başarılı bir şekilde sıçradı, direnç gösterdi ve daha düşük seviyelerde satın alma ilgisinin devam ettiğini gösterdi. Ancak 2.550 'Karar Alanı' civarındaki genel direncin önemli bir zorluk olduğu kanıtlandı. XRP bu bölgeden defalarca reddedildi, bu da daha yüksek hedeflere doğru açık bir kaçışı önledi. Yükselen destek ile 2.550 civarındaki yatay direnç arasındaki bu etkileşim, bir yükseliş üçgeni formasyonunun oluşumunu akla getiriyor; bu da birikim veya bir kırılma hazırlığının göstergesi. Mevcut fiyat hareketi XRP'nin 2.550 bölgesinin alt sınırını test ettiğini ve bir ihlal için momentum oluşturmaya çalıştığını gösteriyor. Temel Direnç Seviyeleri: 2.550 Karar Alanı: En acil ve kritik dirençtir. İdeal olarak artan hacimle birlikte bu bölgenin üzerinde kararlı bir kırılma ve kalıcı bir kapanış, güçlü bir yükseliş sinyali olacaktır. 2.700 Yukarı Yönlü 1. Hedef: XRP'ün 2.550'yi başarıyla aşması durumunda, 2.700 seviyesi 'Yukarı Yönlü 1. Hedef' olarak tanımlanır. Önceki bu yüksek salınım bir sonraki major engeli olacaktır. 2,90 ila 2,95 Dönüş Bölgesi: 2,700'ün ötesinde, bu bölge, önceki direncin desteğe dönüşebileceği veya tam tersinin önemli bir yükseliş eğilimine işaret edebileceği önemli bir 'Dönme Bölgesi'ni temsil ediyor. Temel Destek Seviyeleri: Yükselen Yeşil Trend Çizgisi: Bu dinamik trend çizgisi, mevcut konsolidasyonda daha yüksek dipleri dikte ederek anında destek sağlıyor. Bu trend çizgisinin altında bir kırılma mevcut yükseliş yapısını geçersiz kılacaktır. 2.300 Aşağı Yön 1. Hedef: Yükselen trend çizgisi başarısız olursa, bir sonraki önemli destek 2.300 'Aşağı Yön 1. Hedef' olacaktır. Bu seviye alıcıları çekebilir ancak buradaki bir kırılma, düşüş yönlü baskının arttığına işaret edebilir. 2.1 Sonraki Destek: Bu güçlü yeşil bölge, Kasım ayının başlarında güçlü kalan önemli bir alan olan 'Sonraki Destek' seviyesini temsil ediyor. 2.300 seviyesinin altındaki bir kırılma, bu önemli psikolojik ve teknik seviyenin test edilmesine yol açabilir. Boğa Senaryosu: En olumlu sonuç, XRPUSD'nin 2.550 'Karar Alanı' üzerinde kesin bir kırılmayı garantilemesi olacak. Bu direncin üzerinde sürdürülebilir bir move, yükselen üçgen formasyonunun gücünü teyit edecek ve muhtemelen 2,90-2,95 'Flip Zone'a doğru daha fazla yukarı yönlü potansiyelle birlikte 2,700 'Artan 1. Hedef'e doğru bir rallinin yolunu açacak. Ayı Senaryosu: Tersine, 2.550'nin üzerine çıkılamaması, yükselen yeşil trend çizgisinin altında kesin bir kırılma ile birleştiğinde önemli bir düşüş eğilimi olabilir. Böyle bir move muhtemelen 2.300 'Dezavantajlı 1. Hedef'in test edilmesine yol açacaktır. Bu desteğin de ihlal edilmesi durumunda XRP, güçlü 2.1 'Sonraki Destek' seviyesine doğru daha da düşüş görebilir. Sonuç: XRPUSD şu anda yüksek riskli bir konsolidasyon içerisinde ve 2.550 'Karar Alanı' kritik bir savaş alanı görevi görüyor. Yükselen yeşil trend çizgisi önemli bir destek sağlıyor ancak genel direncin tekrar tekrar reddedilmesi, kesin bir kırılma ihtiyacını vurguluyor. Yatırımcıların, XRP'nin bir sonraki major move'unu tahmin etmek için bu modelden her iki yönde de net bir kırılmayı titizlikle izlemesi gerekiyor. Yasal Uyarı: Bu tabloda verilen bilgiler yalnızca eğitim ve bilgilendirme amaçlıdır ve yatırım tavsiyesi olarak değerlendirilmemelidir. Ticaret ve yatırım önemli riskler içerir ve her yatırımcı için uygun değildir. Herhangi bir yatırım kararı vermeden önce mali durumunuzu dikkatle değerlendirmeli ve bir mali müşavirle görüşmelisiniz. Bu grafiğin yaratıcısı herhangi bir spesifik sonucu veya kârı garanti etmez ve bu bilgilerin kullanılması sonucunda ortaya çıkan hiçbir zarardan sorumlu değildir. Geçmiş performans gelecekteki sonuçların göstergesi değildir. Bu bilgileri kullanmak kendi sorumluluğunuzdadır. Bu grafik Ticaret ve Yatırım Analizi konusunda kendimi geliştirmek için oluşturulmuştur. Lütfen herhangi bir yatırım yapmadan önce kendi analizinizi yapın.
ManiMarkets
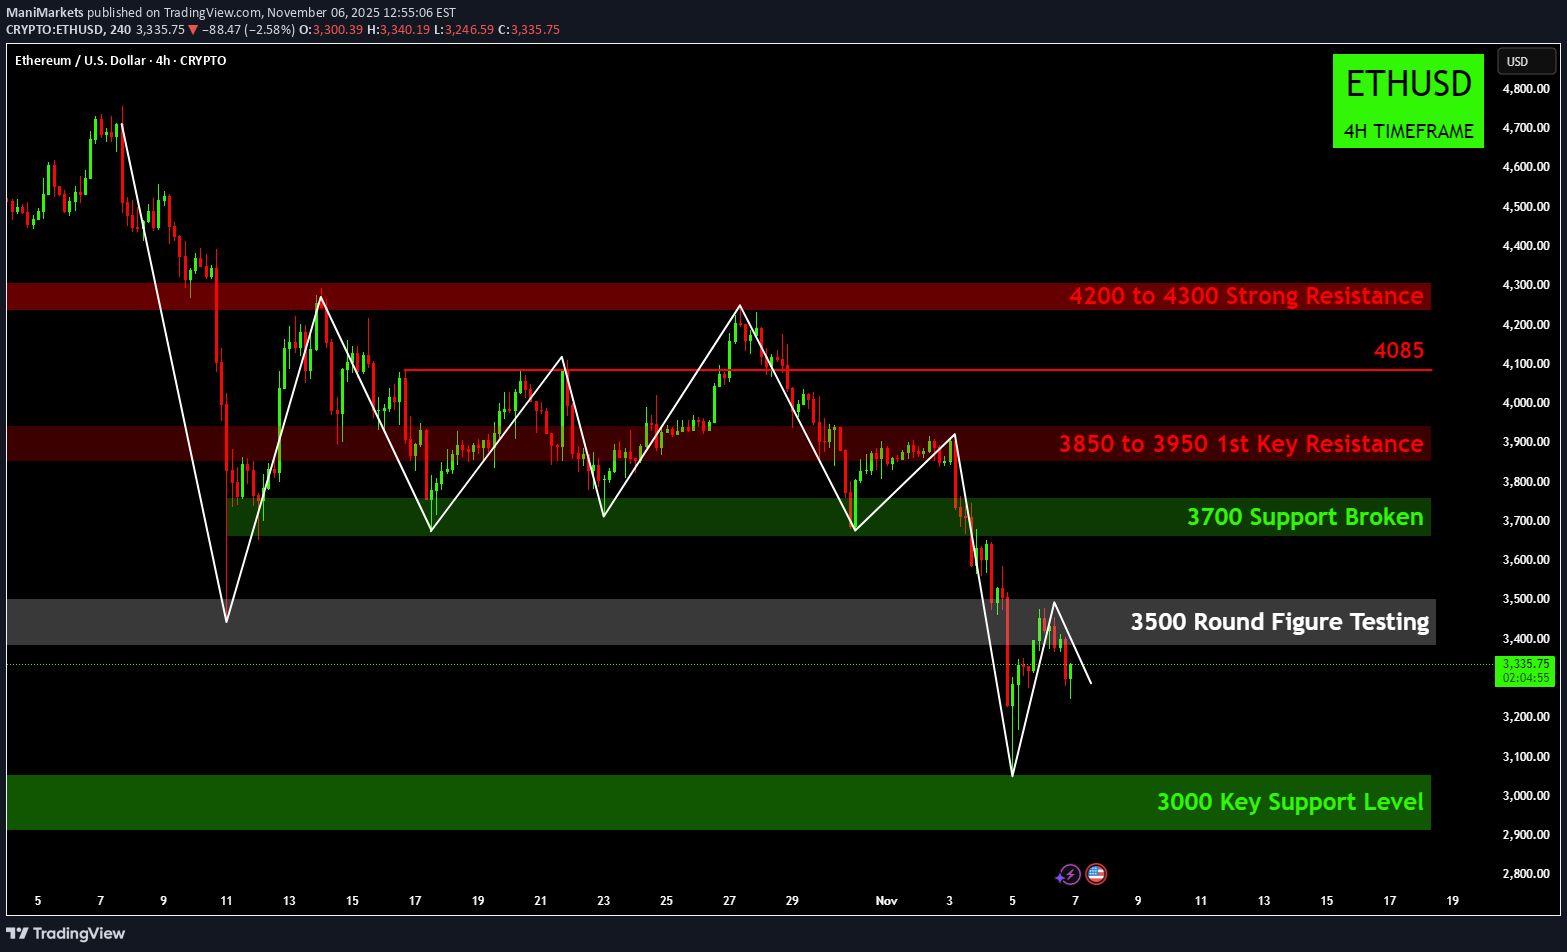
اتریوم در دام مثلث نزولی؛ آیا قیمت ETH به زیر 3200 سقوط میکند؟

📉 ETHUSD: Temel Hedeflerin Altında Bir Düşüş Trend Üçgenine Yakalandı – Ethereum İçin Sırada Ne Var? Zaman Aralığı: 4 Saatlik Grafik Ethereum (ETHUSD) şu anda 3.440$ civarında işlem görüyor. Fiyat, daha yüksek seviyeleri sürdüremedikten sonra gelişen bir model içerisinde sıkışıp kaldığından, düşüş yönlü baskının açık işaretlerini gösteriyor. Güncel Fiyat Hareketi ve Trend Analizi: Ethereum, Ekim sonundaki zirvelere ulaştığından bu yana, bir dizi düşük zirvenin damgasını vurduğu sürekli bir düşüş trendi içinde. En son toparlanma girişimi, 10-11 Kasım civarında 3700 'Artan 1. Hedef' bölgesinde kesin bir şekilde reddedildi. Bu reddedilmeden bu yana, ETHUSD konsolidasyona giriyor ve büyük ölçüde dinamik direnç görevi gören belirgin bir red azalan trend çizgisinin altında çalışıyor. Fiyat şu anda acil destek görevi gören 3350 'Karar Alanı' civarında seyrediyor. Bununla birlikte, alçalan trend çizgisinin tekrar tekrar reddedilmesi (potansiyel bir alçalan üçgen veya takoz formasyonu oluşturarak), ısrarcı satış baskısının altını çiziyor. Fiyat bu 'Karar Alanı'ndan geçici sıçramalar bulsa da, genel trend çizgisinin kırılamaması zayıflığın devam ettiğini gösteriyor. Temel Direnç Seviyeleri: Azalan Red Trend Çizgisi: Şu anda 3500 noktasının hemen üzerinde olan bu dinamik trend çizgisi, herhangi bir yükseliş toparlanmasının önündeki en acil engeldir. Bunun üzerinde bir kırılma momentumun değişmesinin ilk ipucu olabilir. 3700 Yukarı Yön 1. Hedef: Bu, mevcut düşüşten önceki son yüksek noktaydı ve boğaların inancını yeniden kazanmak için aşması gereken önemli bir direnç seviyesini temsil ediyor. 3850 - 3950 1. Temel Direnç ve 4085: Bu yüksek direnç bölgeleri şu anda hemen ulaşılamıyor ancak daha geniş bir trend dönüşü için önemli engeller olmaya devam ediyor. 4200 ila 4300 Güçlü Direnç: Bu major genel direnç önceki zirvenin alanını işaret eder ve meydan okumak için önemli bir yükseliş eğilimi gerektirir. Temel Destek Seviyeleri: 3350 Karar Verme Alanı: Bu gri bölge acil destek görevi görüyor. Bu bölgenin altında devam eden ticaret, açık bir düşüş sinyali olacaktır. 3200 Dezavantajlı 1. Hedef: 'Karar Verme Alanı'nın tutunamaması durumunda, grafik 3200'ü 'Dezavantajlı 1. Hedef' olarak tanımlar. Bu seviye alıcıları çekebilir ancak aynı zamanda kritik bir kırılma noktasını da temsil eder. 3000 Temel Destek Seviyesi: Bu güçlü psikolojik ve teknik destek seviyesi, 3200'ün aşılması durumunda devreye girecektir. Daha geniş orta vadeli yükseliş yapısı için son savunma hattını temsil ediyor. Boğa Senaryosu: Ethereum'nın kısa vadede yükselişe geçmesi için, azalan red trend çizgisinin kararlı bir şekilde üzerine çıkması ve ardından güçlü hacimle 3700 'Yukarı Yöndeki 1. Hedef'ini sağlam bir şekilde geri alması gerekiyor. Bu, mevcut düşüş eğilimini geçersiz kılacak ve daha yüksek direnç seviyelerine doğru bir potansiyel move önerecektir. Ayı Senaryosu: Hakim olan düşüş eğilimi, düşüşün devam etme olasılığının daha yüksek olduğunu gösteriyor movement. Alçalan trend çizgisinin kırılamaması ve 3350 'Karar Alanı'nın altında kesin bir kırılma, muhtemelen 3200'ün 'Aşağı Taraf 1. Hedefi'nin test edilmesinin yolunu açacaktır. 3200'ün ihlali, 3000 'Temel Destek Seviyesine' doğru hızlı bir düşüşe yol açabilir. Sonuç: Ethereum şu anda kritik bir kavşakta, düşüş eğilimi çizgisi altında mücadele ediyor ve 3350 'Karar Alanı' desteğine tutunuyor. ETHUSD'nin yakın geleceği, bu alçalan formasyondan yukarı doğru çıkıp çıkamayacağına veya devam eden satış baskısının onu 3200 ve 3000 destek seviyelerine doğru itip itmeyeceğine bağlı. Yatırımcılar bir sonraki yönün move doğrulanması için mevcut konsolidasyon modelinde net bir kırılma beklemelidir. Yasal Uyarı: Bu tabloda verilen bilgiler yalnızca eğitim ve bilgilendirme amaçlıdır ve yatırım tavsiyesi olarak değerlendirilmemelidir. Ticaret ve yatırım önemli riskler içerir ve her yatırımcı için uygun değildir. Herhangi bir yatırım kararı vermeden önce mali durumunuzu dikkatle değerlendirmeli ve bir mali müşavirle görüşmelisiniz. Bu grafiğin yaratıcısı herhangi bir spesifik sonucu veya kârı garanti etmez ve bu bilgilerin kullanılması sonucunda ortaya çıkan hiçbir zarardan sorumlu değildir. Geçmiş performans gelecekteki sonuçların göstergesi değildir. Bu bilgileri kullanmak kendi sorumluluğunuzdadır. Bu grafik Ticaret ve Yatırım Analizi konusunda kendimi geliştirmek için oluşturulmuştur. Lütfen herhangi bir yatırım yapmadan önce kendi analizinizi yapın.
ManiMarkets
سقوط بزرگ سولانا تایید شد: آیا حمایت ۱۷۵ دلار از دست میرود؟
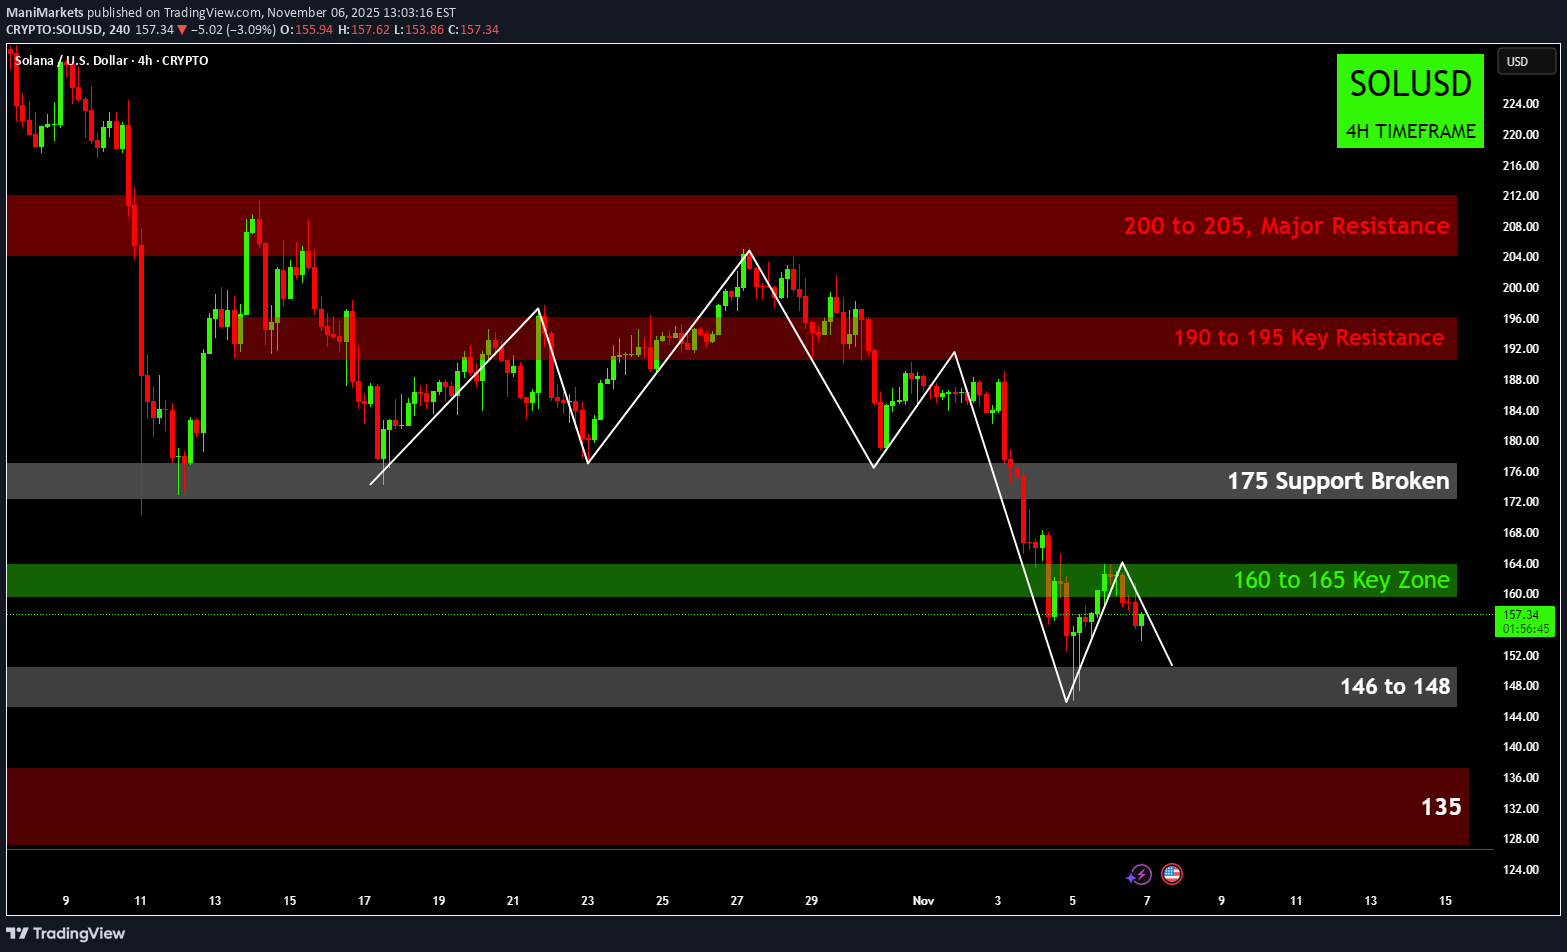
🔥 SOLANA (SOL/USD) 4 Saat: Devasa Çift Tepe Kırılımı Onaylandı! 🔥 175 Doların Altındaki Destek Avı Başlıyor 4 saatlik SOL/USD grafiği, 175 $ ile 205 $ arasında oluşan büyük Çift Tepe formasyonunun (veya karmaşık bir M-top yapısının) kırılmasından kaynaklanan major düşüş eğilimini doğruladı. Genellikle güçlü bir sinyal olan bu modelin tersine çevrilmesi, önemli kazanımları silen keskin bir düzeltmeyi başlattı. Kritik 175 dolarlık destek (çift tepenin boyun çizgisi) kesin olarak kırıldı ve düşüş eğilimini doğruladı ve daha fazla aşağı yönlü ölçülü hareketlerin yolunu açtı. Mevcut Aralığı Tanımlayan Temel Seviyeler Fiyat şu anda oldukça değişken bir aşamada ve istikrarlı bir taban bulmaya çalışırken direnç seviyelerini test ediyor. 🛡️ Anında Direnç (Anahtar Bölge): 160 ila 165 ABD Doları (Yeşil Bölge) Bu, fiyatın şu anda mücadele ettiği alandır. Kısa süreliğine geri alındı ancak tutunamadı, bu da onu en acil ve kritik direnişe dönüştürdü. Ayılar bu bölgeyi agresif bir şekilde savunuyor. 📉 Anında Destek (Kat): 146 ila 148 ABD Doları Bu, son dönemdeki en düşük seviye ve ilk önemli destek seviyesidir. Fiyat bu bölgeden güçlü bir şekilde sıçradı, bu da satın alma ilgisinin mevcut olduğunu, ancak daha sonraki yeniden testlerde devam etmesi gerektiğini gösteriyor. 🛑 Major Kapsamlı Direnç: 190 ila 195 ABD Doları Orta vadeli düşüş görünümüne son vermek için bu bölgenin geri kazanılması gerekiyor. O zamana kadar, bunun altındaki herhangi bir movement düzeltici kabul edilir. 🚨 Nihai Ayı Hedefi: 135 Dolar (Major Talep Bölgesi) 146-148 dolar arasındaki acil destek kırılırsa, model dökümünden elde edilen bir sonraki major hedefi 135 dolar civarındaki deep talep bölgesi olacaktır. Solana için sırada ne var? İki Kritik Senaryo Düşüş eğiliminin devamı (Baskın Trend): Fiyat 160-165 dolar direnç bölgesinde reddedildi. Ayılar, fiyatı 146-148 dolar arasındaki düşük seviyeyi test etmek için geri çekti. Belirleyici bir kırılma ve 146 doların altında kapanış, formasyonun devam ettiğini doğruluyor ve 135 dolar birincil hedef haline geliyor. Boğa Rahatlaması (Tersine Dönme Girişimi): Boğalar, fiyatı 165 doların üzerine başarıyla çıkarmayı ve onu tutmayı başardı. Bu, yerel düzeltmenin sona erdiğinin sinyalini verebilir ve orijinal kırılma bölgesini 175 dolarda (şu anda müthiş bir direnç olarak hareket ediyor) test etmek için bir rahatlama rallisine yol açabilir. move ila 175 dolar iyi bir işaret olabilir, ancak ana trend 195 dolar geri kazanılana kadar düşüşte kalacak. Sonuç: En az direnç yolu, 175 dolar boyun çizgisinin kırılmasının ardından aşağıya doğru devam ediyor. Yatırımcılar potansiyel kısa girişler için 160-165 dolar bölgesini ve kritik destek hattı olarak 146-148 dolar bölgesini izlemelidir. Yasal Uyarı: Bu tabloda verilen bilgiler yalnızca eğitim ve bilgilendirme amaçlıdır ve yatırım tavsiyesi olarak değerlendirilmemelidir. Ticaret ve yatırım önemli riskler içerir ve her yatırımcı için uygun değildir. Herhangi bir yatırım kararı vermeden önce mali durumunuzu dikkatle değerlendirmeli ve bir mali müşavirle görüşmelisiniz. Bu grafiğin yaratıcısı herhangi bir spesifik sonucu veya kârı garanti etmez ve bu bilgilerin kullanılması sonucunda ortaya çıkan hiçbir zarardan sorumlu değildir. Geçmiş performans gelecekteki sonuçların göstergesi değildir. Bu bilgileri kullanmak kendi sorumluluğunuzdadır. Bu grafik Ticaret ve Yatırım Analizi konusunda kendimi geliştirmek için oluşturulmuştur. Lütfen herhangi bir yatırım yapmadan önce kendi analizinizi yapın.
ManiMarkets
تحلیل تکنیکال XRP/USD: آیا 2.10 دلار سکوی پرتاب بعدی برای صعود است؟
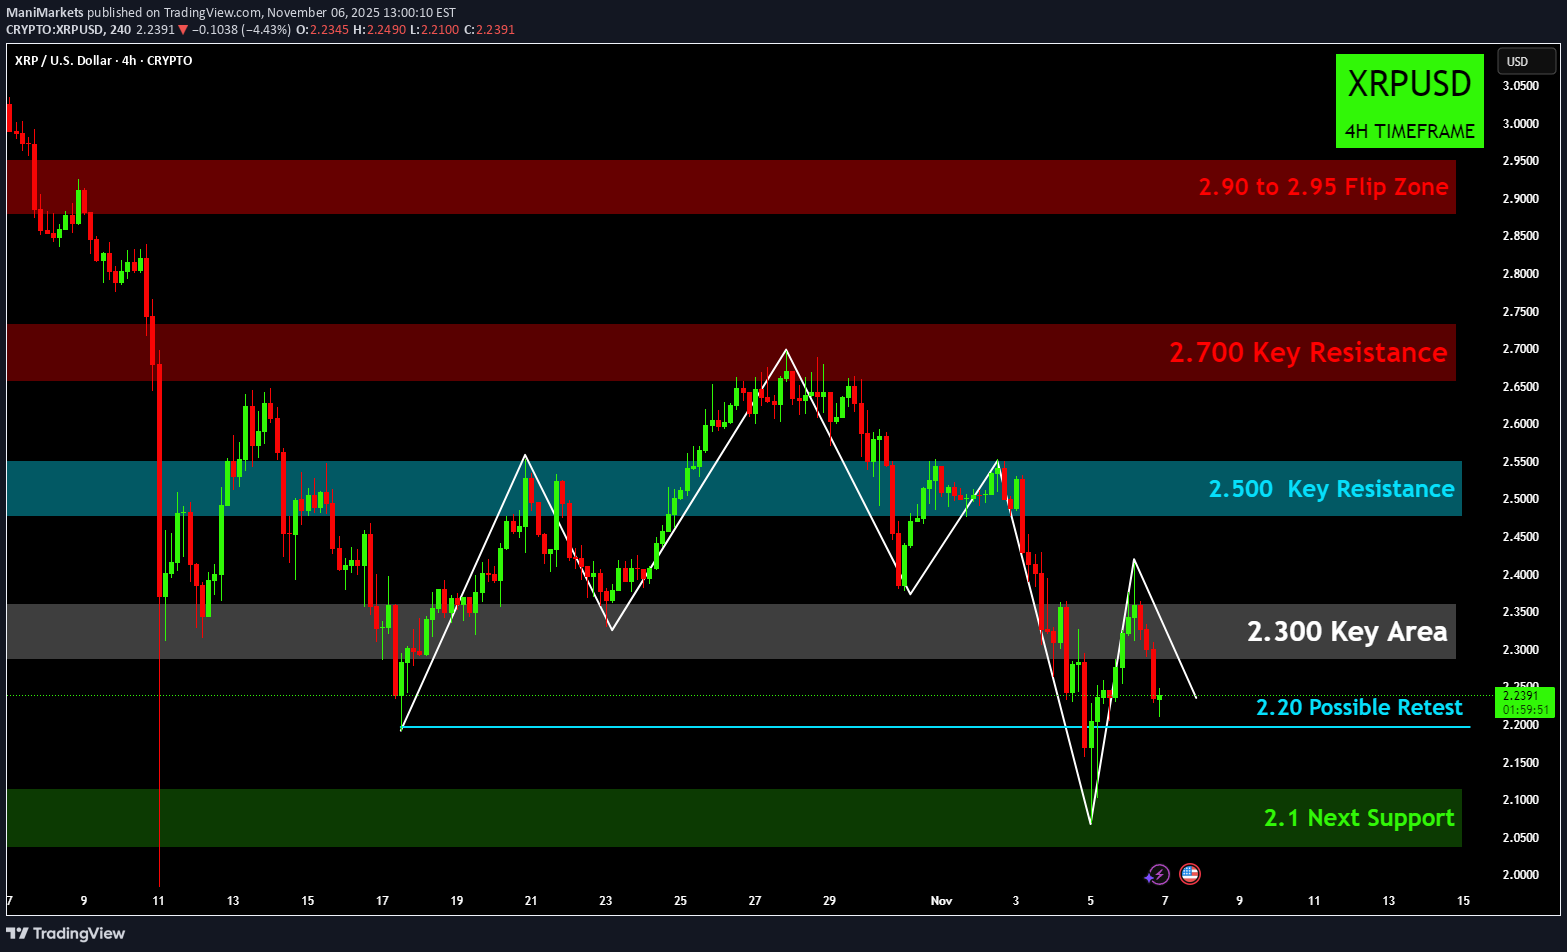
🚀 XRP/USD (4 Saat) Analizi: 2,10 Dolarlık Başlatma Paneli 🌊 Mevcut Pazar İçeriği XRP/USD 4 saatlik grafik, son yüksek seviyelerinden major düşüş eğiliminin net bir resmini sunuyor. Fiyat hareketi, klasik bir Baş ve Omuz (H&S) modelinin muhtemelen tamamlandığını, boyun çizgisinin (zirveler arasındaki dipler) altında keskin bir düşüşe yol açan kesin bir kırılma ile işaretlendiğini gösteriyor. Önemli gelişme, fiyatın 2,10 Dolar (Yeşil Bölge) destek alanından son zamanlarda sıçraması. Bu bölgenin güçlü bir talep alanı olarak hareket etmesi, Sağlık ve Güvenlik modelinin tetiklediği ilk agresif düzeltme aşamasının sona erebileceğini gösteriyor. Boğalar şimdi yerel bir üs kurmaya çalışıyor. İzlenecek Temel Seviyeler ⚡️ Anında Direnç (İlk Engel): 2,20$ Bu acil engeldir. Kısa vadeli yükseliş momentumunu teyit etmek ve bir sonraki major direncine doğru ilerlemeye zemin hazırlamak için temiz bir kırılma ve 2,20 doların üzerinde tutunma gerekiyor. 🎯 Anahtar Direnç Alanı (Çevirme Bölgesi): 2,30 ABD Doları (Gri Bölge) Kısa vadede en kritik direnç bu. 2,30$ bölgesi önceden güçlü bir destekti ve şimdi major psikolojik ve teknik direnç olarak test edilecek. Bu bölgenin kırılması ve desteğe dönüştürülmesi, kısa vadeli piyasa yapısını önemli ölçüde düşüş eğiliminden nötr/yükseliş yönüne kaydıracaktır. 🛡️ Major Destek (Tutulmalıdır): 2,10$ (Yeşil Bölge) Bu, boğalar için sand'teki çizgidir. 4 saatlik grafikte sürekli bir kırılma ve mumun 2,10 doların altında kapanması, aşağı yönlü hareketin devam ettiğini doğrulayacak ve H&S hedefi bir sonraki ilgi noktası olacak ve çok daha derin bir düzeltmeye yol açacak. Potansiyel Senaryolar Boğa Senaryosu (Sıçrama ve Kırılma): XRP 2,10$ desteğini başarıyla elinde tutuyor. Fiyat 2,20 doları aştı ve ardından 2,30 doları (Gri Bölge) geri aldı. 2,30 $'lık teyit edilmiş bir dönüş, 2,50 $'lık (Mavi Bölge) ve sonuçta 2,70 $'lık (Red Bölge) yüksek direnç bölgelerine doğru bir yükselişin kapısını açıyor. Ayı Senaryosu (Reddetme ve Yeniden Test Etme): XRP son yükselişi tutamadı ve 2,20 $ veya 2,30 $ seviyesinden reddedildi. Fiyat 2,10 Dolar (Yeşil Bölge) desteğini yeniden test etmek için geriledi. 2,10 doların altında sürekli bir kırılma, mevcut temel oluşturma çabalarını geçersiz kılacak ve sağlık ve güvenlik yönündeki aşağı yönlü hedefin hâlâ geçerli olduğunu göstererek, daha da önemli bir düşüşe yol açacaktır. kayıplar.
ManiMarkets
اتریوم در خطر: نبرد حساس ۳۵۰۰، آیا ۳۰۰۰ در انتظار است؟
🌊 Ethereum Boğulma: 3500 Yuvarlak Şekil Tehlikede, 3000 Bekliyor mu? 📉 ETH/USD (4 Saatlik Zaman Dilimi) Analizi Ethereum, daha geniş kripto pazarındaki gerilemeyi yansıtan yoğun bir satış baskısıyla karşı karşıya. Kritik direnç seviyelerini geri kazanmayı başaramayan ETH, birkaç major desteğini kırdı ve şu anda temel psikolojik seviye olan 3500'ü test ediyor. 1. Düşüş Yapısı ve Direnç Bölgeleri Grafik, boğaların ivmeyi sürdürmede önemli bir başarısızlığa uğradığını ve bunun güçlü bir düşüş eğilimine yol açtığını açıkça gösteriyor. 🛑 4200 ila 4300 Güçlü Direnç: Bu üst red bölgesi, gösterilen dönemin tamamı için tavandı. Bu alanın üzerine tekrar tekrar çıkılamaması, güçlü genel arzın doğrulandığını doğruladı. 🔴 3850 ila 3950 1. Anahtar Direnç: Bu bölge, konsolidasyon aşamasında sık sık bir dönüm noktası görevi gördü. Kaybedildiği için artık ETH için en acil ve kritik direnci temsil ediyor. Bu bölgenin geri kazanılması, yükseliş eğiliminin herhangi bir işareti için hayati önem taşıyor. ⚠️ 4085 Orta Direnç: Genel düşüş yapısına da katkıda bulunan önemli bir küçük seviye. 2. Mevcut Fiyat Hareketi ve Destek Seviyeleri Son fiyat hareketi, belirlenen konsolidasyon aralığının altında keskin bir kırılma ile tanımlanıyor. 💥 3700 Desteği Kırıldı: Uzatılmış konsolidasyon dönemi boyunca destek görevi gören 3700'deki yeşil kutu kesin olarak kaybedildi. Bu, aşağı yönde yapısal bir kırılmaya işaret ediyor. ⚪ 3500 Yuvarlak Rakam Testi: Fiyat şu anda 3500 major yuvarlak rakamı civarında mücadele ediyor. Kara kutu devam eden bu testi vurgulamaktadır. Onaylanmış bir kırılma ve 3500 seviyesinin altında tutunma, daha fazla satış için kapıları açacaktır. 🛡️ 3000 Temel Destek Seviyesi: Piyasa artık 3000 Temel Destek Seviyesindeki (deep yeşil kutu) nihai talep bölgesine bakıyor. Bu, bir sonraki major psikolojik ve teknik destektir ve 3500'ün tutunamaması halinde muhtemelen hedef olacaktır. 3. Ticaret Planı Senaryoları Ayılar (Kısa): Giriş Tetikleyicisi: 3500 Yuvarlak Şekil Test bölgesinin altında onaylanmış bir arıza ve mum kapanışı. Hedef: 3000 Temel Destek Seviyesindeki sonraki major talep bölgesi. Boğalar (Uzun): Giriş Tetikleyicisi: 3500 seviyesinin başarılı bir savunması, ardından güçlü bir kapanış ve kırılan 3700 desteğinin üzerine itme. Hedef: 3850 ila 3950 Temel Direnç bölgesinin yeniden test edilmesi. Özetle, Ethereum temel destek yapısını kaybetmiş durumda ve istikrarsız bir zemin üzerinde. 3500'deki savaş kritik; başarısız olursa, 3000'e doğru bir move olasılığı oldukça yüksektir. Yasal Uyarı: Bu tabloda verilen bilgiler yalnızca eğitim ve bilgilendirme amaçlıdır ve yatırım tavsiyesi olarak değerlendirilmemelidir. Ticaret ve yatırım önemli riskler içerir ve her yatırımcı için uygun değildir. Herhangi bir yatırım kararı vermeden önce mali durumunuzu dikkatle değerlendirmeli ve bir mali müşavirle görüşmelisiniz. Bu grafiğin yaratıcısı herhangi bir spesifik sonucu veya kârı garanti etmez ve bu bilgilerin kullanılması sonucunda ortaya çıkan hiçbir zarardan sorumlu değildir. Geçmiş performans gelecekteki sonuçların göstergesi değildir. Bu bilgileri kullanmak kendi sorumluluğunuzdadır. Bu grafik Ticaret ve Yatırım Analizi konusunda kendimi geliştirmek için oluşturulmuştur. Lütfen herhangi bir yatırım yapmadan önce kendi analizinizi yapın.
ManiMarkets
بیت کوین در سراشیبی تند: شکست حمایتها و هدف ۱۰۰ هزار دلار!
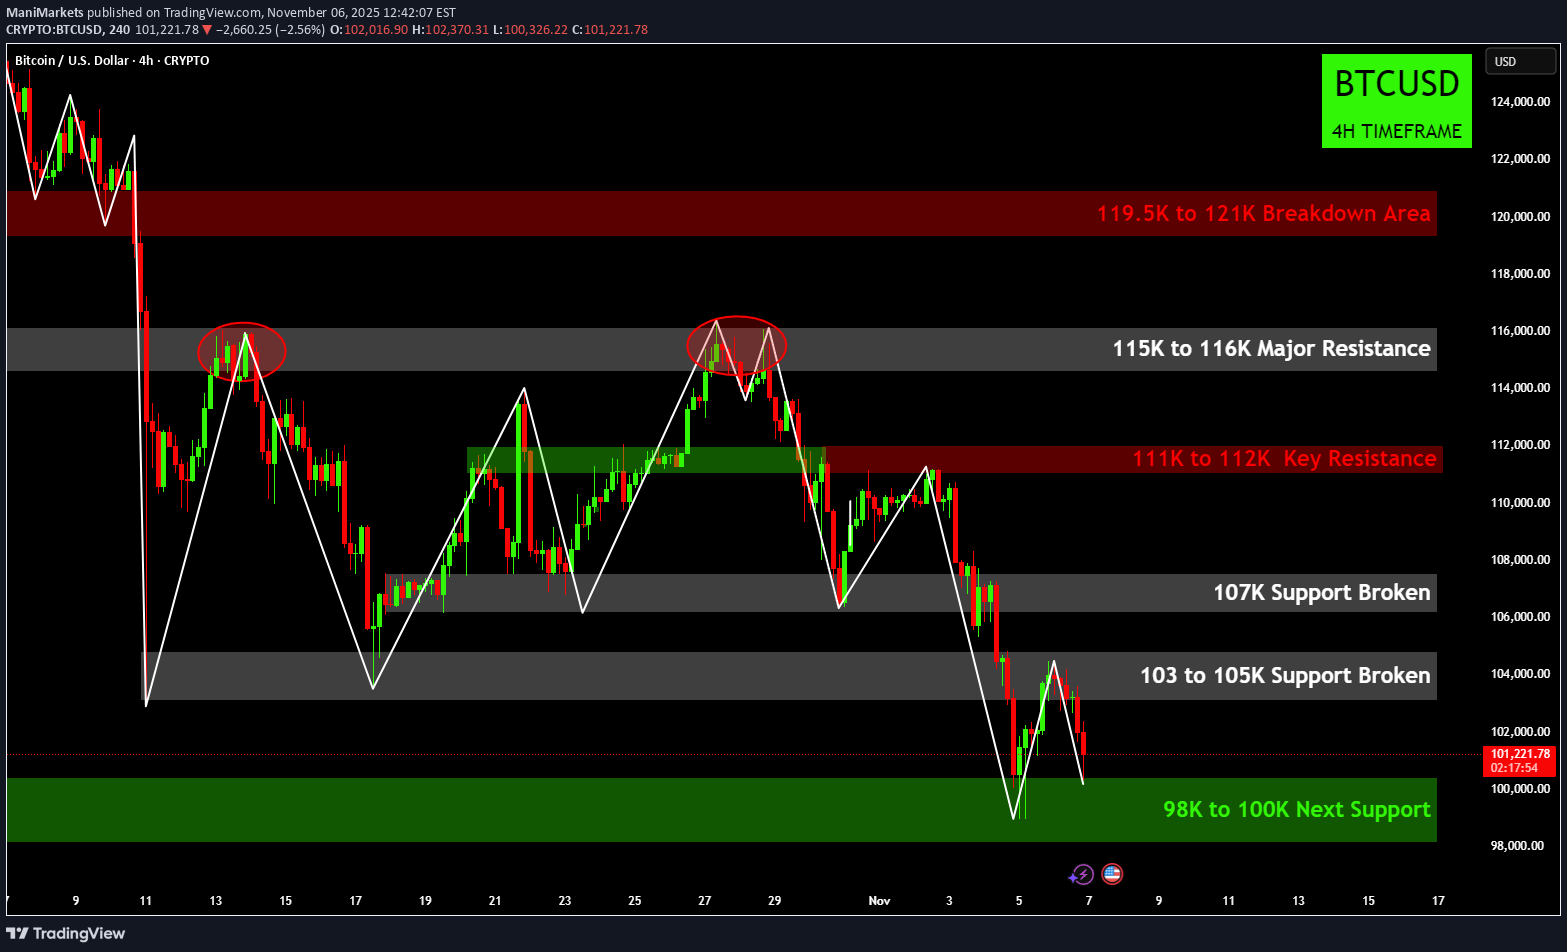
🚨 Bitcoin Kanama: Major Shattered'ı Destekler, Görüş Alanında 100K! 📉 BTC/USD (4H Zaman Dilimi) Analizi Bitcoin şu sıralar ağır satış baskısı altında ve genel direncin önemli ölçüde reddedilmesinin ardından birkaç önemli destek seviyesini kırdı. Fiyat hareketi, boğaların bir taban oluşturmakta zorlanmasıyla düşüş eğiliminin devam ettiğini gösteriyor. 1. Düşüş Yapısı ve Temel Dirençler Grafik, bir yükselişin sürdürülememesi ve doğrulanmış bir geri dönüş modelinin ardından ayıların kontrolü elinde tuttuğunu açıkça gösteriyor. 🛑 115K - 116K Major Direnç: Bu alan major dönüm noktası oldu. Fiyat, bu bölgede (daire içine alınmış) klasik bir Çift Tepe (veya bunun bir varyasyonu) oluşturdu ve güçlü arzı teyit ederek keskin satışları başlattı. 🔴 111K ila 112K Temel Direnç: Yeşilden kırmızıya dönüşen bu bölge, piyasanın kırılmadan önce yaptığı son önemli yüksek seviyeydi. Artık kritik bir engeli temsil ediyor. Herhangi bir sıçramanın burada yoğun satışlarla karşılaşması muhtemeldir. ⚠️ 119,5K ila 121K Arıza Alanı: Bu üst red bölgesi, büyük düşüşün başladığı ilk alanı gösterir. Bu seviyeye ulaşmak ve bu seviyeye geri dönmek olağanüstü bir ralli gerektirir. 2. Mevcut Arıza ve Destek Seviyeleri Son dönemdeki en dikkate değer aktivite, önceki konsolidasyon seviyelerinin kesin bir şekilde kırılması ve bu durumun güçlü bir düşüş momentumuna işaret etmesidir. 💥 107K Desteği Kırıldı: Bu, şu anda kaybedilen önemli bir ara destekti ve aşağı doğru kaymaya katkıda bulundu. 💥 103K'dan 105K'ya Destek Kırıldı: Bu önemli talep bölgesini tutamamak, mevcut düşüş trendinin gücünü teyit ediyor. Bu alan artık herhangi bir sıçrama durumunda muhtemelen act anında direnç olarak görülecektir. 🛡️ 98K'dan 100K'ya Sonraki Destek: Piyasa artık hızla major psikolojik ve teknik seviyeye yaklaşıyor 100.000'lik bölge. Yeşil kutu, 98K'dan 100K'ya kadar olan bir sonraki önemli talep alanını vurguluyor. 3. Ticaret Planı Senaryoları Ayılar (Kısa): Giriş Tetikleyicisi: Yakın zamanda kırılan 103K ila 105K bölgesindeki direncin reddedilmesi ve onaylanması. Hedef: 98K ila 100K Sonraki Destek seviyesinin testi. Boğalar (Uzun): Giriş Tetikleyicisi: 98K ila 100K destek bölgesi içinde onaylanmış bir ters dönüş formasyonu (çift dip veya güçlü bir yutan mum gibi). Hedef: Şu anda direnç olarak act olması beklenen 103K ila 105K arasındaki kırılmış desteğin yeniden test edilmesi. Özetle, Bitcoin psikolojik açıdan önemli olan 100K seviyesini hedefleyen kararlı bir düşüş trendinde. major destek seviyesi güçlü, ikna edici bir sıçrama sağlayana kadar ayılar açıkça kontroldedir. Yasal Uyarı: Bu tabloda verilen bilgiler yalnızca eğitim ve bilgilendirme amaçlıdır ve yatırım tavsiyesi olarak değerlendirilmemelidir. Ticaret ve yatırım önemli riskler içerir ve her yatırımcı için uygun değildir. Herhangi bir yatırım kararı vermeden önce mali durumunuzu dikkatle değerlendirmeli ve bir mali müşavirle görüşmelisiniz. Bu grafiğin yaratıcısı herhangi bir spesifik sonucu veya kârı garanti etmez ve bu bilgilerin kullanılması sonucunda ortaya çıkan hiçbir zarardan sorumlu değildir. Geçmiş performans gelecekteki sonuçların göstergesi değildir. Bu bilgileri kullanmak kendi sorumluluğunuzdadır. Bu grafik Ticaret ve Yatırım Analizi konusunda kendimi geliştirmek için oluşturulmuştur. Lütfen yatırım yapmadan önce kendi analizinizi yapın.
ManiMarkets
طلا در نقطه حساس: آیا الگوی سقف دوقلو قیمت را سقوط میدهد؟
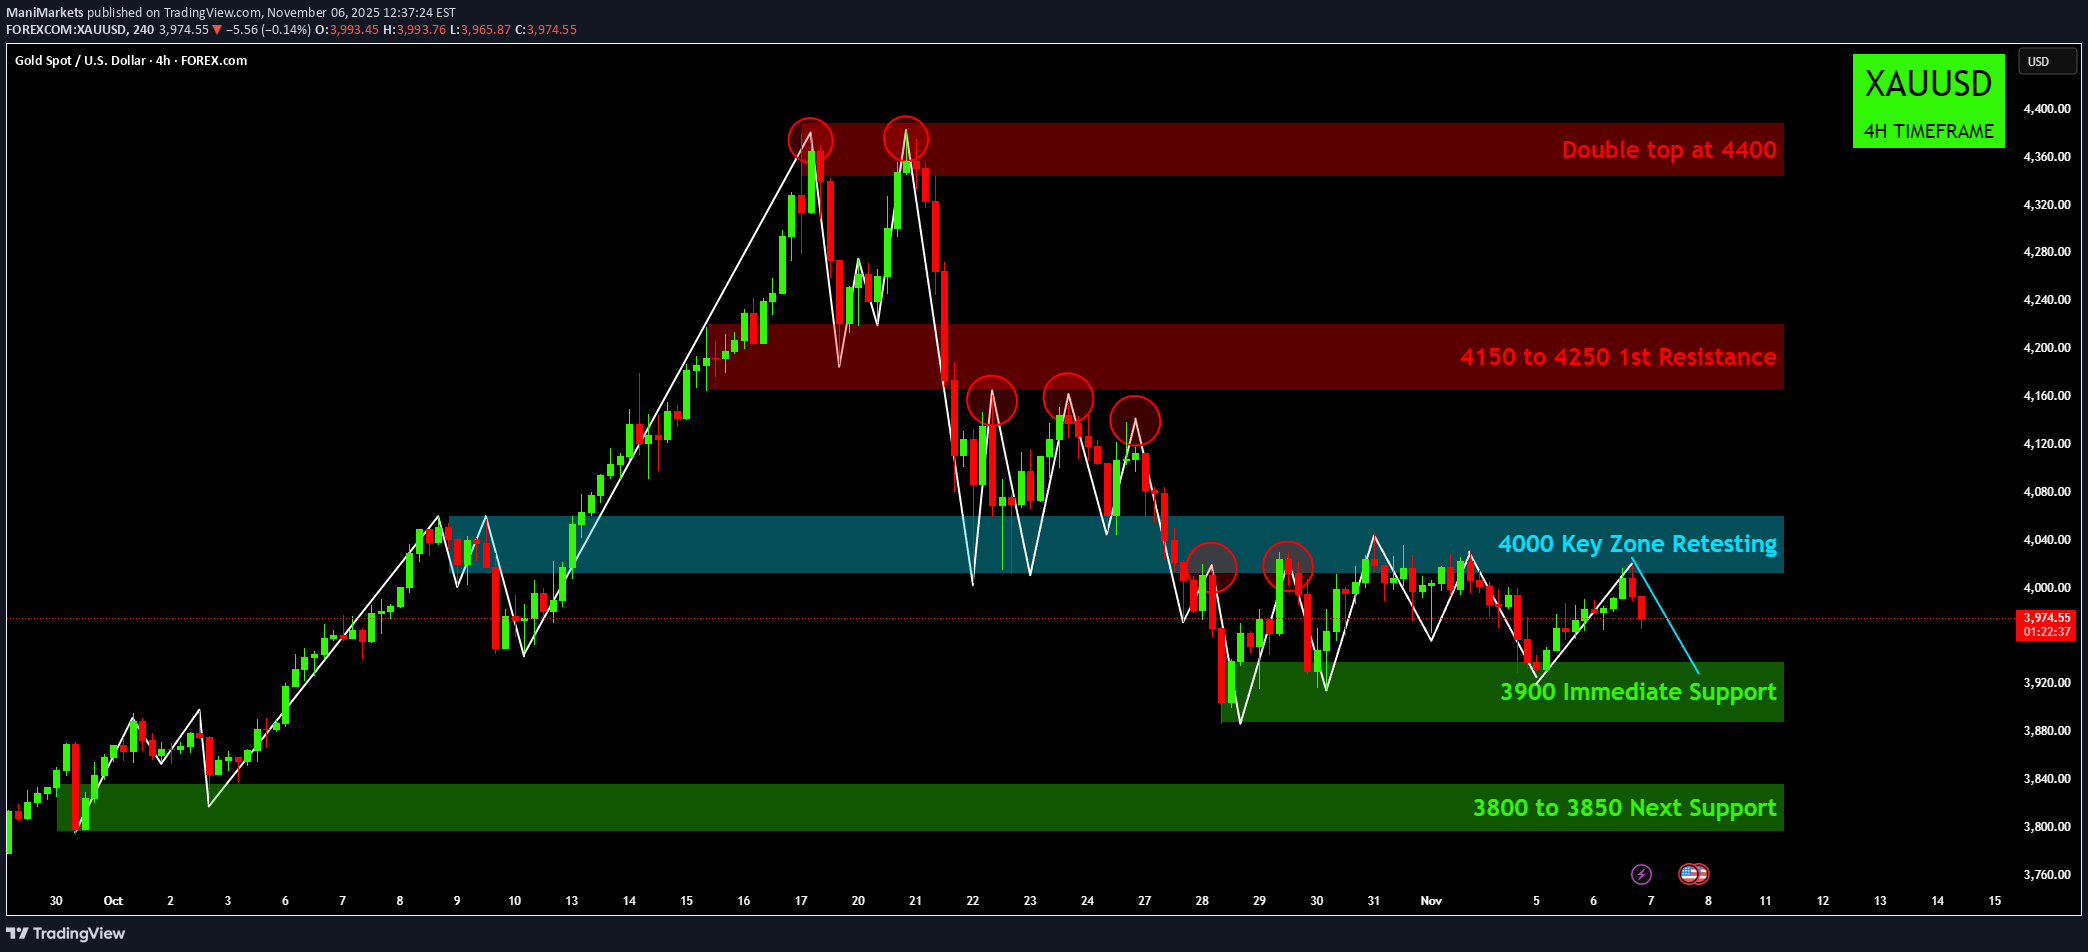
👑 Altının Kritik Kavşağı: Çift Tepe Tehdidi Tersine Dönüyor! 📉 XAU/USD (4H Zaman Dilimi) Analizi Altının önemli bir yükseliş trendi ve ardından keskin bir dönüş paterni yaşaması, yatırımcıların çok önemli bir konsolidasyon ve yeniden test dönemi geçirmesine neden oldu. Grafik, metalin bir sonraki major move'ini belirleyecek önemli arz ve talep bölgelerini vurguluyor. 1. Düşüş Kurulumu: Çift Tepe ve Kilit Bölge Kaybı Grafik, yükseliş momentumunun 4400 civarında bir zirveye ulaştıktan sonra durduğunu açıkça gösteriyor. ⚠️ 4400'de Çift Tepe: Bu major düşüş eğilimi formasyonu oluştu ve tepede güçlü bir satış baskısı olduğunu gösteriyor. Fiyat, yükselişi sürdüremedi ve hızlı bir düşüşe yol açtı. 📉 4000 Anahtar Bölgesinin Dağılımı: Çift tepenin ardından Altın, daha önce güçlü destek (turuncu kutu) görevi gören kritik 4000 Anahtar Bölgesini kaybetti. Fiyat şu anda bu bölgeyi aşağıdan yeniden test ediyor ve direnç alanına geçişini doğruluyor. 🛑 4150 ila 4250 (1. Direnç): Bu büyük red bölgesi, ilk major genel besleme alanını temsil eder. Boğaların güvenini yeniden kazanmaları için bu bölgeyi fethetmeleri gerekiyor, ancak şimdilik bu bölge yoğun bir şekilde savunuluyor gibi görünüyor. 2. Mevcut Fiyat Hareketi ve Destek Seviyeleri Fiyat şu anda 4000 direncinin altında konsolide oluyor ve klasik bir "alçalan üçgen" veya konsolidasyon modeli oluşturuyor. 🛡️ 3900 Acil Destek: Fiyat, 3900 acil destek seviyesi (yeşil kutu) tarafından destekleniyor. Daha fazla kaymayı önlemek için bu seviyenin korunması önemlidir. 3900 seviyesinin altına bir kırılma muhtemelen daha fazla aşağı yönlü hareketin sinyali olabilir. 🎯 3800 ila 3850 Sonraki Destek: Daha derin olan bu yeşil bölge, mevcut yapının son savunma hattıdır. Bu alan önceki major rallinin tabanıyla aynı hizada olduğundan kritik bir talep bölgesi haline geliyor. 3. Ticaret Planı Senaryoları Boğalar (Uzun): Giriş Tetikleyicisi: 4000 Anahtar Bölgenin üzerinde sürekli bir kırılma ve mum kapanışı. Hedef: 4150 ila 4250 direnç alanının yeniden test edilmesi. Ayılar (Kısa): Giriş Tetikleyicisi: 3900 Acil Desteğin altında onaylanmış bir arıza ve mum kapanışı. Hedef: 3800 ila 3850 arasındaki sonraki major talep bölgesi. Özetle Altın önemli bir noktada. Yatırımcılar bir sonraki yön işareti için 3900 destek ve 4000 dirençteki savaşı izlemelidir! Sizce bundan sonra ne olacak: Altın 3900'ü tutacak mı yoksa sonunda 4000'in üzerine mi çıkacak? Yasal Uyarı: Bu tabloda verilen bilgiler yalnızca eğitim ve bilgilendirme amaçlıdır ve yatırım tavsiyesi olarak değerlendirilmemelidir. Ticaret ve yatırım önemli riskler içerir ve her yatırımcı için uygun değildir. Herhangi bir yatırım kararı vermeden önce mali durumunuzu dikkatle değerlendirmeli ve bir mali müşavirle görüşmelisiniz. Bu grafiğin yaratıcısı herhangi bir spesifik sonucu veya kârı garanti etmez ve bu bilgilerin kullanılması sonucunda ortaya çıkan hiçbir zarardan sorumlu değildir. Geçmiş performans gelecekteki sonuçların göstergesi değildir. Bu bilgileri kullanmak kendi sorumluluğunuzdadır. Bu grafik Ticaret ve Yatırım Analizi konusunda kendimi geliştirmek için oluşturulmuştur. Lütfen yatırım yapmadan önce kendi analizinizi yapın.
ManiMarkets
بیت کوین در منطقه طلایی: منتظر تایید صعودی بزرگ در نمودار ماهانه!
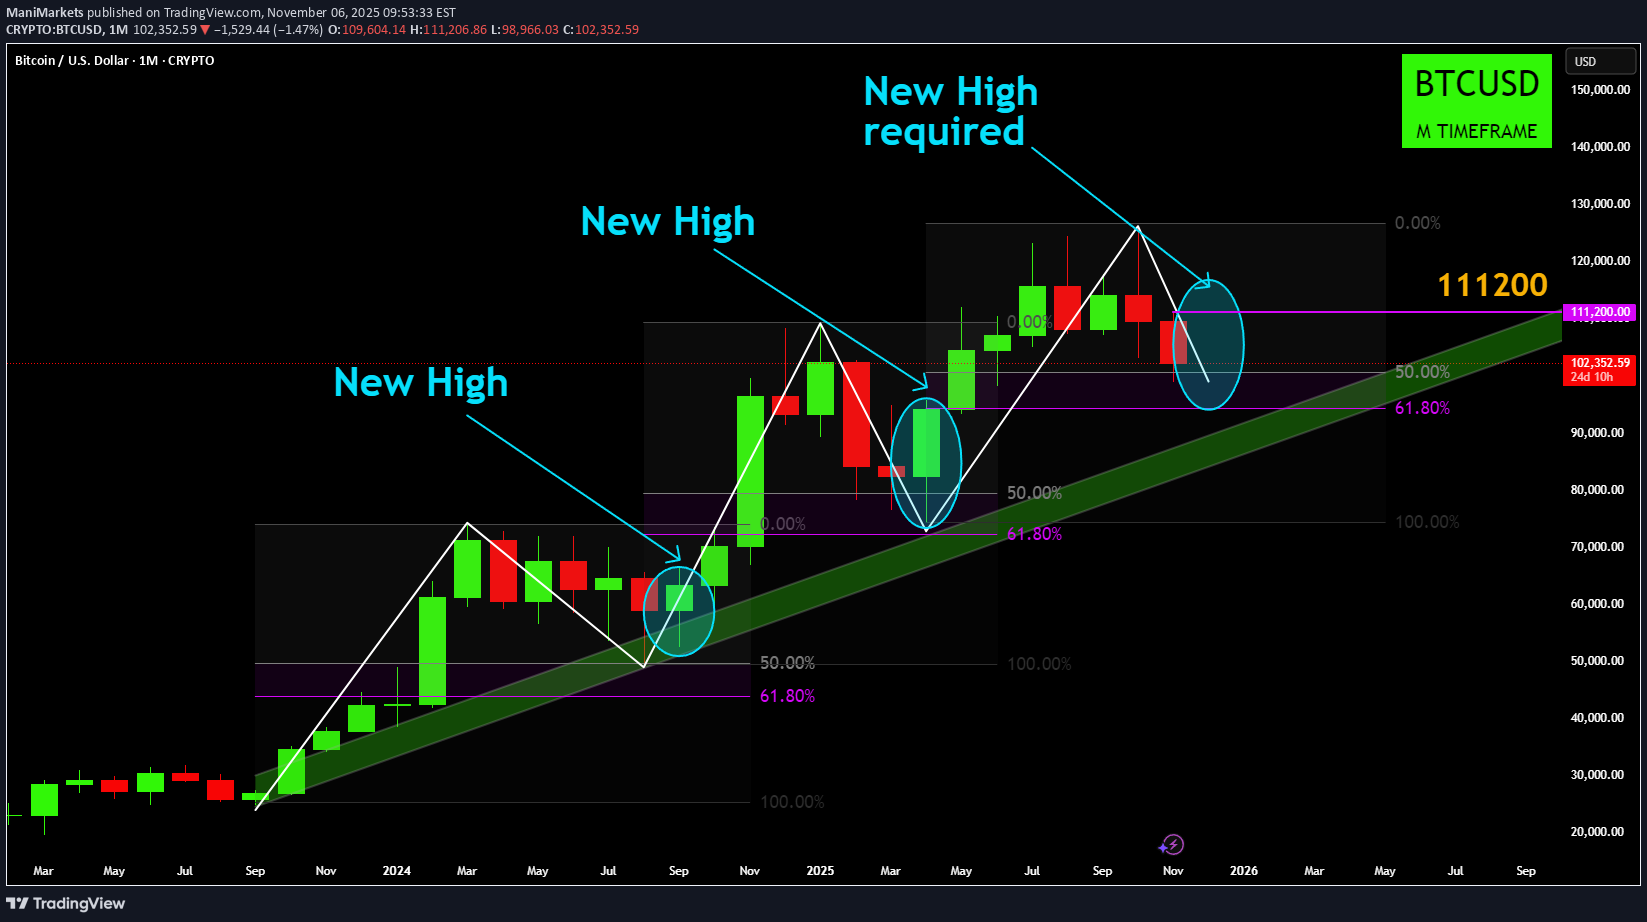
BTC Aylık: Fibonacci Altın Bölgesinden Yükseliş Teyidi Bekleniyor Merhaba tüccarlar. Bu, Bitcoin'in makro trendinin üst düzey, aylık zaman dilimi analizidir. Bu fikir, Eylül 2023'ten bu yana boğa piyasasını tanımlayan açık ve tekrar eden bir kalıba dayanıyor. Bu daha büyük yapıyı anlayarak, mevcut oynaklığı daha iyi çerçeveleyebilir ve bir sonraki major ayağın onayı olarak nelere bakacağımızı belirleyebiliriz. 🔍 Core Analizi Aylık grafikte BTC'nin yükseliş eğilimi tutarlı bir plan izliyor: move yukarıya doğru güçlü bir ivme. Fibonacci "Altın Bölgesi"ne (%50 ile %61,8 geri çekilme seviyeleri arasındaki alan) düzeltici bir geri çekilme. Desteğin bulunduğu bu bölgede bir konsolidasyon dönemi. Bu bölgeden bir çıkış, Yeni Yüksek'e ve trendin devamına yol açar. Grafikten de görebileceğiniz gibi, bu "geri çekilme ve kırılma" modeli bu yükseliş trendi sırasında zaten iki kez gerçekleşti. 📍 Şimdi Neredeyiz Şu anda kritik bir noktadayız. Önemli bir yeni zirve (yaklaşık 128.000 $) gördükten sonra fiyat bir kez daha düzeltme aşamasına girdi. Fiyat şu anda %50 Fibonacci seviyesini yaklaşık 102.404 dolarda test ediyor. Bu bizi doğrudan, geçmişte fiyat için destek ve sıçrama tahtası görevi gören aynı alan olan "Altın Bölge"ye geri getiriyor. 🐂 Boğa Tezi (Onay) Uzun vadeli yükseliş eğiliminin teyit edilmesi için formasyonun tekrarlanması gerekiyor: Desteğin bu %50 - %61,8 Fib bölgesi içinde kalması gerekiyor. Fiyatın eninde sonunda bu düzeltici yapıyı kırması ve önceki zirvenin üzerinde Yeni bir Yüksek seviye oluşturması gerekiyor. Bu yeni yüksek seviye, geri çekilmenin tamamlandığının ve makro yükseliş trendinin devam ettiğinin gerekli onayıdır. 🐻 Düzeltici/Geçici Aşama ("Bekle") Bu yeni zirve oluşana kadar mevcut piyasa aşamasına saygı duymalıyız. Fiyat teknik olarak "geri çekilme modunda". Bu, volatilitenin devam etmesini beklememiz gerektiği anlamına geliyor. Fiyat, net bir yön belirlenmeden önce bu düzeltme bölgesinde haftalarca, hatta aylarca kolayca dalgalanabilir. Aylık kapanış bazında %61,8 Fib seviyesinin altına bir kırılma önemli bir uyarı işareti olabilir ve tüm bu yükseliş yapısının geçerliliğini sorgulayabilir. ⚠️ Önemli: Makro Görünüm Bu bir Aylık Grafiktir. Her mum 30 günlük fiyat hareketini temsil eder. Bu analiz, büyük resmi anlamak amacıyla uzun vadeli bir bakış açısı (yatırımcılar, pozisyon tüccarları) için idealdir. Kısa vadeli ticarete uygun DEĞİLDİR. Bu "altın bölge" içindeki hareketler hala onbinlerce dolar değerinde olabilir. Aynı kavram (impuls, Fib geri çekilmesi, yeni yüksek), kısa vadeli ticaret kurulumlarını bulmak için daha kısa zaman dilimlerine (Günlük veya 4 Saatlik gibi) uygulanabilir, ancak bu özel grafik kesinlikle bir makro görünümdür. Yasal Uyarı: Bu tabloda verilen bilgiler yalnızca eğitim ve bilgilendirme amaçlıdır ve yatırım tavsiyesi olarak değerlendirilmemelidir. Ticaret ve yatırım önemli riskler içerir ve her yatırımcı için uygun değildir. Herhangi bir yatırım kararı vermeden önce mali durumunuzu dikkatle değerlendirmeli ve bir mali müşavirle görüşmelisiniz. Bu grafiğin yaratıcısı herhangi bir spesifik sonucu veya kârı garanti etmez ve bu bilgilerin kullanılması sonucunda ortaya çıkan hiçbir zarardan sorumlu değildir. Geçmiş performans gelecekteki sonuçların göstergesi değildir. Bu bilgileri kullanmak kendi sorumluluğunuzdadır. Bu grafik Ticaret ve Yatırım Analizi konusunda kendimi geliştirmek için oluşturulmuştur. Lütfen herhangi bir yatırım yapmadan önce kendi analizinizi yapın.
Sorumluluk Reddi
Sahmeto'nun web sitesinde ve resmi iletişim kanallarında yer alan herhangi bir içerik ve materyal, kişisel görüşlerin ve analizlerin bir derlemesidir ve bağlayıcı değildir. Borsa ve kripto para piyasasına alım, satım, giriş veya çıkış için herhangi bir tavsiye oluşturmazlar. Ayrıca, web sitesinde ve kanallarda yer alan tüm haberler ve analizler, yalnızca resmi ve gayri resmi yerli ve yabancı kaynaklardan yeniden yayınlanan bilgilerdir ve söz konusu içeriğin kullanıcılarının materyallerin orijinalliğini ve doğruluğunu takip etmekten ve sağlamaktan sorumlu olduğu açıktır. Bu nedenle, sorumluluk reddedilirken, sermaye piyasası ve kripto para piyasasındaki herhangi bir karar verme, eylem ve olası kar ve zarar sorumluluğunun yatırımcıya ait olduğu beyan edilir.