
MELANIA
Official Melania Meme
| تریدر | نوع سیگنال | حد سود/ضرر | زمان انتشار | مشاهده پیام |
|---|---|---|---|---|
Sonuç bulunamadı. | ||||
Official Melania Meme Fiyat Grafiği
سود Üç Ay :
سیگنالهای Official Melania Meme
filtre
Mesajı şuna göre sırala
Tüccar Türü
timeframe

behdark
MELANIA Analysis (8H)
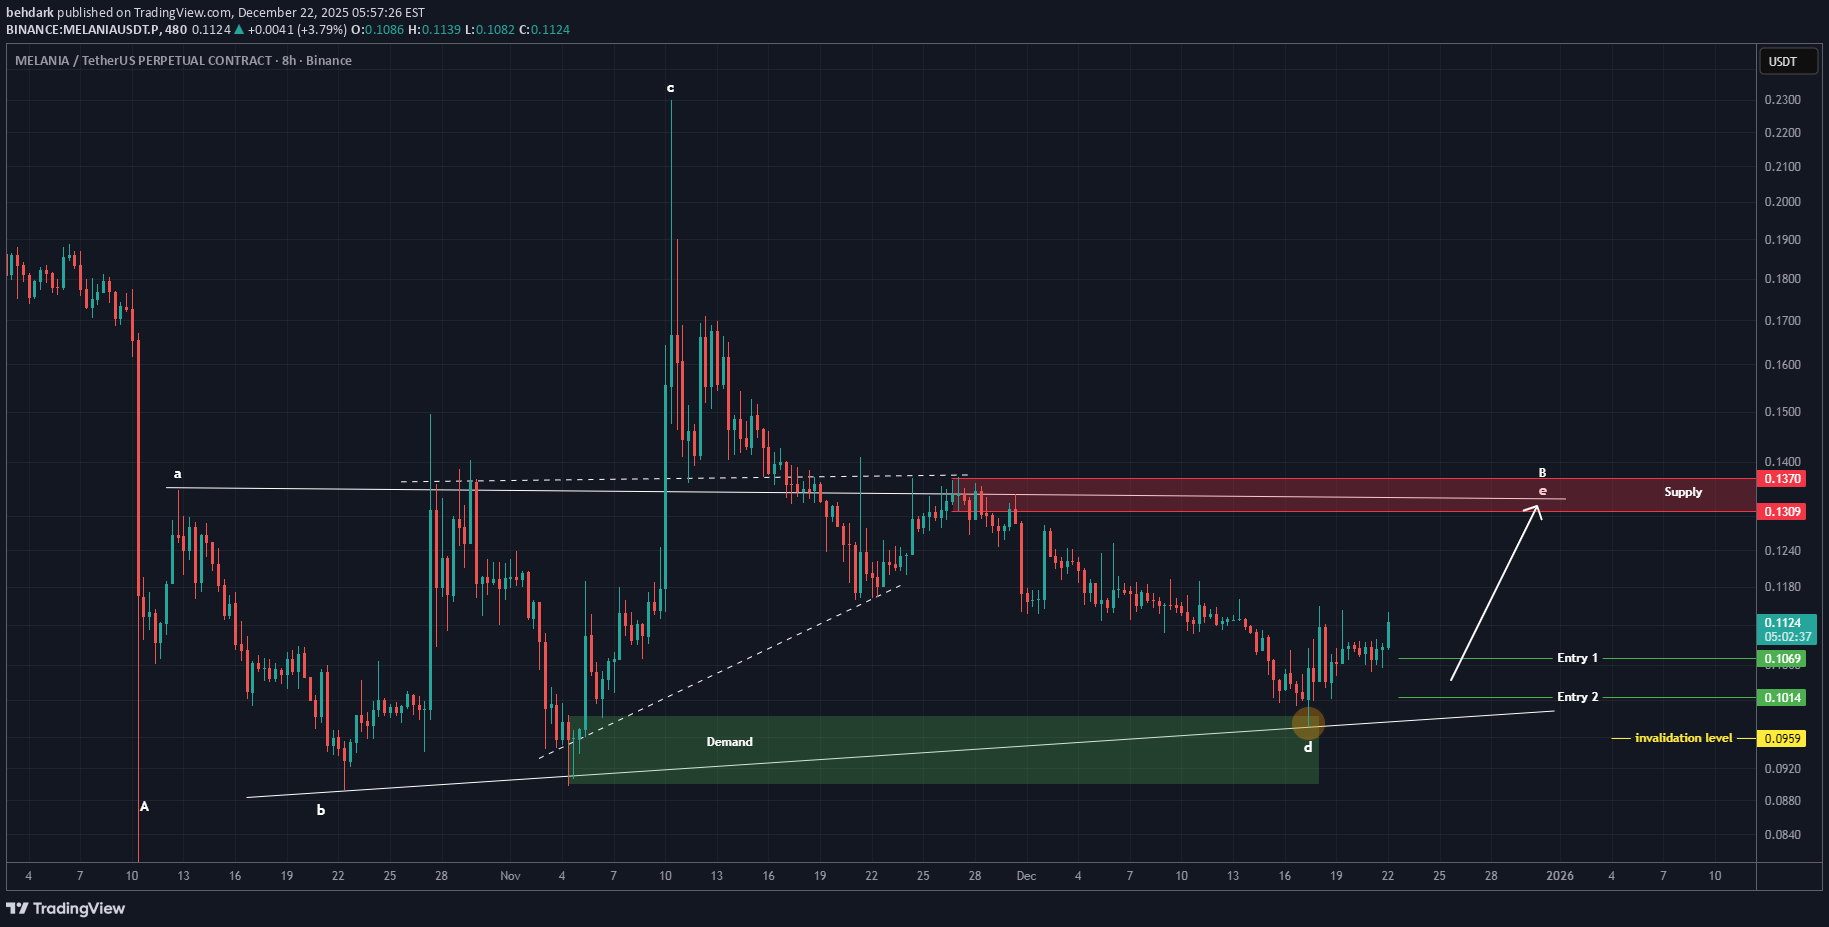
Görünüşe göre bir üçgen oluşuyor ve D dalgası henüz tamamlanmadı. Fiyat, E dalgası için move yükselişini gösterebilir. Bu wave için DCA kullanılarak girilmesi gereken iki giriş noktası işaretledik. Hedefler grafikte işaretlenmiştir. Geçersiz kılma seviyesinin altında 4 saatlik bir mum kapanışı bu analizi geçersiz kılacaktır. Risk yönetimi için zararı durdurma ve sermaye yönetimini lütfen unutmayın İlk hedefe ulaştığımızda, bir miktar kârdan tasarruf edin ve ardından durağı giriş olarak değiştirin Sorularınız varsa yorum yapın teşekkür ederim

asilturk
ملانیا (MELANIA): آیا این میم کوین پس از یک سال خواب، آماده انفجار است؟
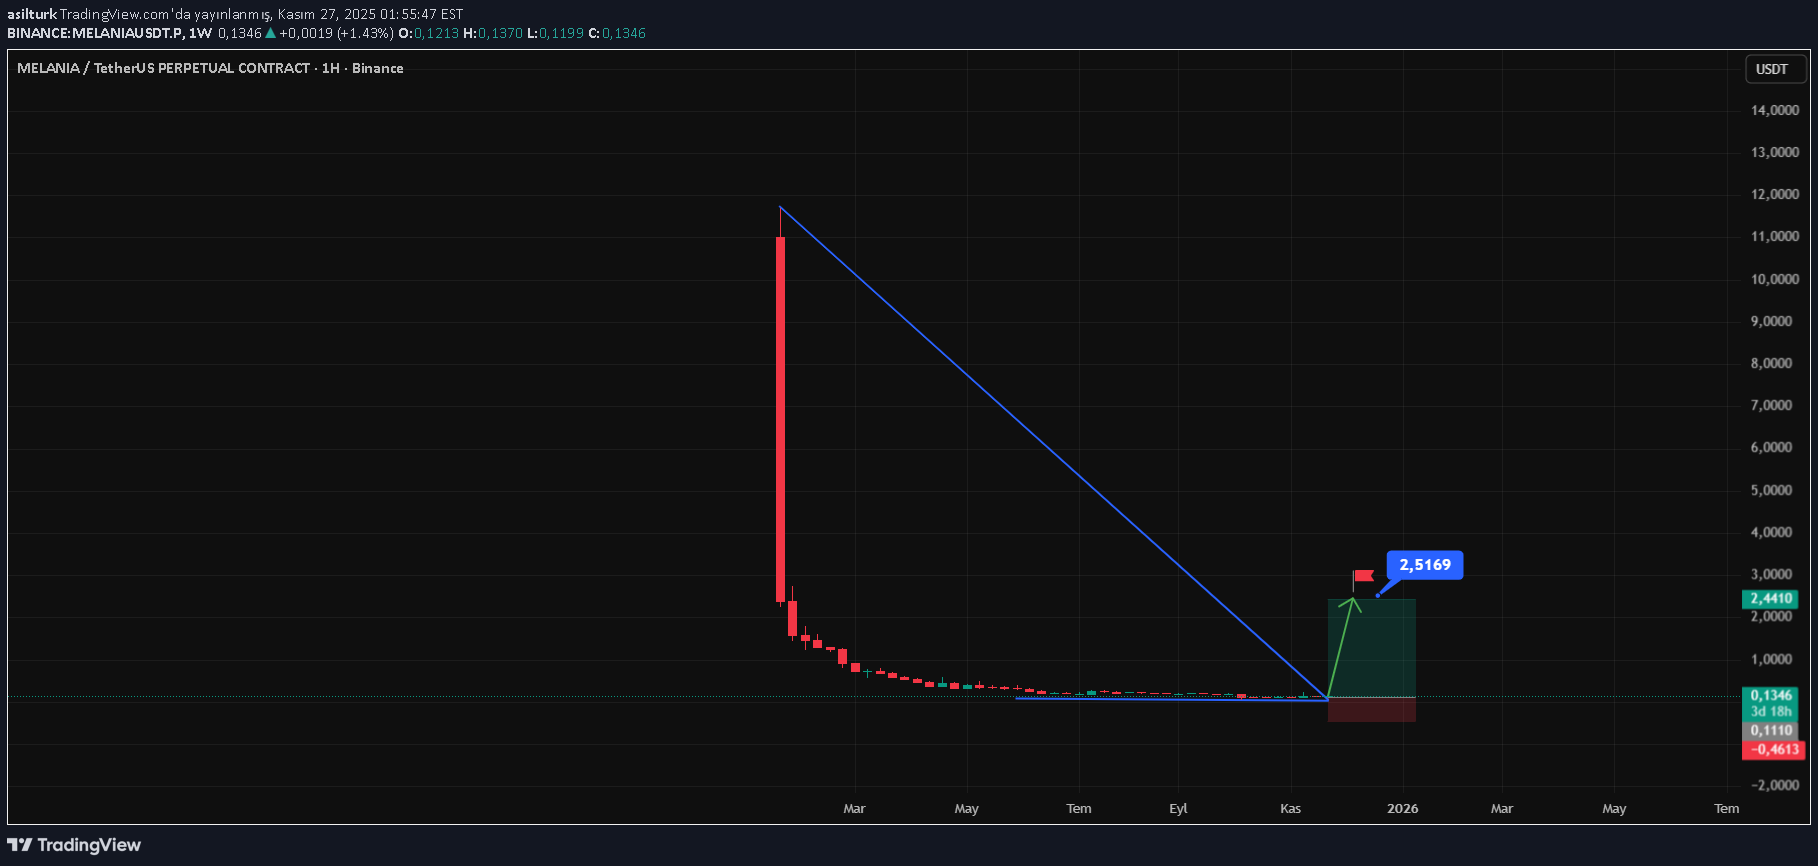
Bugün protföye ekleyeceğimiz bir başka kripto para ise 0,1350 cent fiyattan MELANIA piyasa değeri 135Milyon$ fiili dolaşımı 1Milyar adet market dominance ağırlığı %0,0041 teknik olarak incelediğimizde SOL ağı üzerinde işlem gören MELANIA coin arz tarihinde 11,69$ fiyat bandını test ederek neredeyse bir yıldır sert düşüşlerle devam ederek 0,1360 cent fiyatlarına kadar geri çekilmiş olduğunu görüyoruz. Meme coin olduğu için kesinlikle çok sert yukarı ve aşağı yönlü fiyat hareketlilikleri yaşana bilir netice de meme coin olduğunu hatırlatmak gerekiyor. Ancak son bir haftadır kademeli fiyat hareketlilikleri ve hacimsel artışları gözlemleye biliyoruz resmen bir yıldır uyuyan son bir haftalık periyotta ise genel düşüş eğiliminden fazlasıyla nasibini almış ancak BTC fiyatlanmaları ve dalgalanmalarında fazlasıyla direnç göstermiştir. Haftalık grafiğini paylaşmamdaki esas ana neden 11$ malliyetle bekleyenlerin 0,1cent fiyat bandında hareket edene MELANIA için önümüzdeki günlerde sert düzeltmelerin geleceğine inanıyorum. Sonuç olarak orta ve uzun vadeli yatırımcıların MELANIA için yatırım yapıla bilinir seviyelerde olduğunu söyleye biliriz ancak kademeli alımlar gerçekleştirmelerini şiddetle tavsiye ederim yapısı gereği çok şiddetli aşağı ve yukarı yönlü hareketleri sebebi ile kademeli yatırım yapmanın doğru olacağı kanaatindeyim.

Mihai_Iacob
چرا سرمایهگذاران کریپتو زود فراموش میکنند؟ شبیه به قماربازان کازینو!
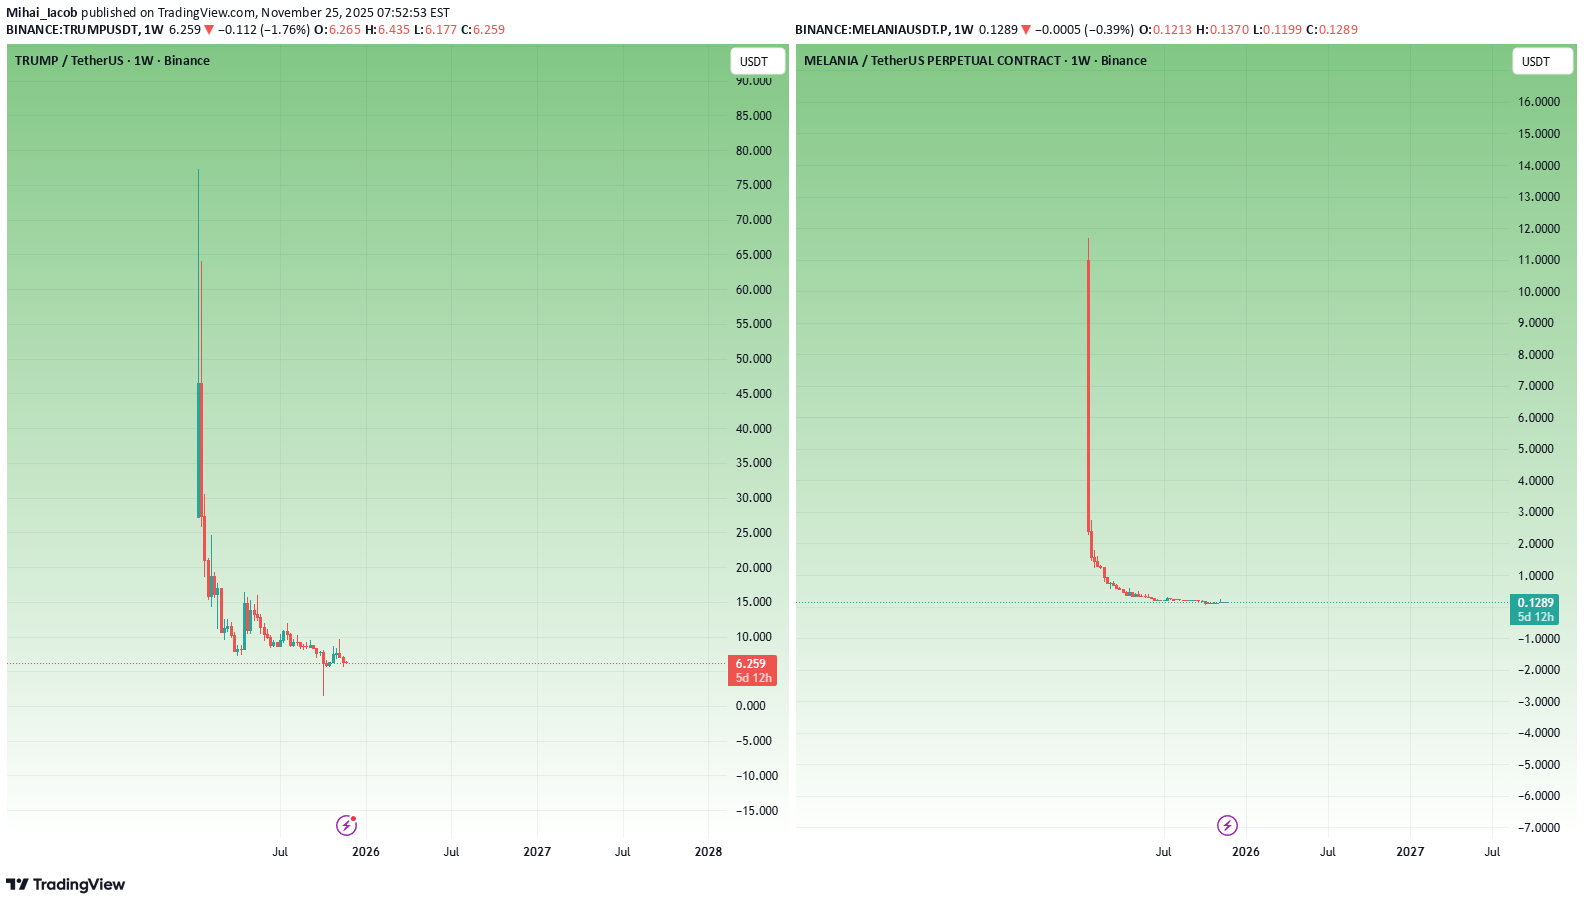
I’ve never been much of a gambler. I don’t chase roulette, I don’t play blackjack regularly, and casinos have never been my second home. But on the rare occasions when I did go—usually dragged by friends who actually like gambling—something strange happened to me. I ended up losing considerable amounts of money. - Not because I thought I’d win. - Not because I had a “system.” - Not because I felt lucky. It was the environment: - the lights - the noise - the adrenaline - the drinks - the atmosphere that hijacks logic And the next morning, the internal monologue was always the same: “See, idiot? Again you drank one too many and managed to lose a Hawaii vacation.” - The regret is real. - The pain is real. - The stupidity is, HOHO, WAY TOO REAL. But the disturbing part? Even though I don’t gamble… even though I don’t chase casinos… the environment alone was enough to override my reasoning. And if that can happen to someone who isn’t a gambler, imagine what happens to someone who willingly walks into a casino every day —because that’s exactly what crypto "investors" do. Crypto markets are casinos with better screens, countless memes, screaming influencers and worse odds. And "investors" forget far too quickly. Crypto "Investors" Forget Too Quickly — Just Like Casino Gamblers Who Keep Coming Back for More Crypto "investors" have one of the shortest memories in financial markets. - Not because they are stupid. - Not because they don’t care. - But because the entire crypto environment is engineered to erase pain and preserve hope — exactly like a casino. Put a gambler in a casino, and he forgets last night’s disaster the moment he sees the lights again. This comparison is not metaphorical. It is psychologically identical. Let’s break it down properly. 1. The Human Brain Is Not Built for Crypto — or Casinos Both environments share the same psychological architecture: - bright colors - fast feedback loops - uncertainty - intermittent rewards - emotional highs - catastrophic lows - near-wins that feel like wins - an illusion of control Neuroscience calls this: Intermittent Reinforcement The most addictive reward structure ever discovered. Slot machines are built on it. Most crypto charts mimic it. Volatility fuels it. When rewards arrive unpredictably: - dopamine spikes - memory of losses fades - the brain overvalues the next opportunity - the pain of the past gets overwritten - the hope of future reward dominates This is why gamblers return. And this is why crypto "investors" buy the same s..ts. 2. The Crypto Cycle Erases Memory by Design After every bull run for an obscure coin: - big money is made (by insiders) - screenshots are posted - what if you have bought with 100usd appear - influencers multiply - everyone becomes a “trading wizard” - Twitter becomes an ego playground - greed replaces rationality After every strong bear move: - portfolios crash 90-95% - people swear “never again” - Telegram groups die - influencers delete posts - conviction collapses - despair dominates But then… When a new "narrative" appears: - Everything resets. - Crypto "investors" forget instantly. No other financial market resets memory this fast. - In stocks, a crash leaves scars. - In forex, blown accounts create caution. - In real estate, downturns shape behavior for years. But in crypto? The new "narative"/ the new hyped coin erases the old one like chalk on a board. 3. The TrumpCoin & MelaniaCoin Episode (Just an Example): The Best Proof That Crypto Traders Forget Too Quickly TrumpCoin and MelaniaCoin didn’t have real value. They weren’t serious projects. They weren’t even clever memes. They were psychological traps built on celebrity gravity. People bought because: - the names were big - the media amplified the narrative - the symbolism felt powerful - the story was exciting And the wipeout was brutal. But the key point is: traders forgot instantly. Within weeks, they were already hunting for: - “the next TrumpCoin” - “the next politician meme” - “the next celebrity pump” - “the next token with a ‘name’ behind it” - "the next 100x" "the next, the next, the next" and is always the same - Not the next valuable project. - Not the next real innovation. - Not the next sustainable investment. No. The next symbol. This is not market behavior. This is casino relapse psychology. 4. These Coins Didn’t Fail Because They Were Memes —They Failed Because They Were Nothing TrumpCoin & MelaniaCoin ( Again, is just an example) pretended to matter because the names mattered. - Traders didn’t buy utility. - They bought a fantasy. The same way gamblers believe a “lucky table” changes their odds. In crypto, people believe: - the celebrity matters - the narrative matters - the hype matters Reality doesn’t. 5. Why Crypto "Investors" Don’t Learn: Because They Don’t Remember Crypto "investors" are not stupid. They are forgetful. They forget the months of pain and remember only the few happy moments. They forget: - drawdowns - stress - panic - illusions - scams - broken promises - influencers lies They remember: - one good run - one moonshot - one dream This is why most altcoins and memes thrive. Not because they deserve to. But because forgetting resets demand every time. 6. The Industry Is Designed to Exploit This Amnesia If traders remembered: - Luna - FTX - SafeMoon - ICO (2017) crashes - NFT (2021) collapses - Meme mania recently …the most of the altcoin sector would evaporate overnight. But "investors" forget —so altcoins with a "nice" story resurrect. Like slot machines resetting after every gambler walks away. 7. The Cure: You Don’t Need Better Tools — You Need a Better Memory The greatest edge in crypto is not fancy indicators, bots to be the first in, or whatever invention comes next. It’s remembering. Remember: - why you lost - how you lost - which narrative fooled you - how the market humiliated you - what the casino environment does to your brain - how celebrity tokens wiped people out Crypto trading requires memory, not optimism. Conclusion: Crypto "Investors" Forget Too Quickly —And That’s Why They Keep Losing Crypto "investors" don’t think like REAL investors. They think like gamblers: - emotional - hopeful - impulsive - forgetful convinced “this time will be different” The latest meme mania proved this perfectly. Crypto is not dangerous because it is volatile. Crypto is dangerous because it erases your memory. The "investor" who forgets loses. The "investor" who remembers wins. Because in crypto: The moment you stop forgetting is the moment you finally start winning. P.S. (A Necessary Clarification, Said Gently — and Honestly) Throughout this article I used the word “investors” in quotation marks — and it wasn’t an accident. Most of the people who call themselves investors in crypto are not actually investing. They are speculating, chasing, hoping, and gambling on meme coins and obscure altcoins purely because “they have 100x potential.” Let’s be honest: - buying a token named after a frog - or a coin launched yesterday by anonymous developers - or a “next big narrative” pump with zero product - or a celebrity meme coin - or something that exists only on Twitter…is not investing. It’s gambling dressed in nice vocabulary. And that’s okay — as long as you know what it is. Also, to be clear: When I critique “altcoins,” I am not talking about all of them. There are real infrastructure projects, real protocols, real technology, and real builders out there. But let’s not pretend: 90% of altcoins exist for hype, for extraction, for speculation, and for the dopamine of “maybe this one will moon.” I’m talking about those coins — the ones that behave like slot machines and survive only because traders forget too quickly. If this article made you uncomfortable, good. Sometimes the truth has to sting before it can help.

CryptoVhagar
آیا ریزش میلینا تمام شد؟ پیشبینی حرکت برگشتی و فرصتهای خرید!
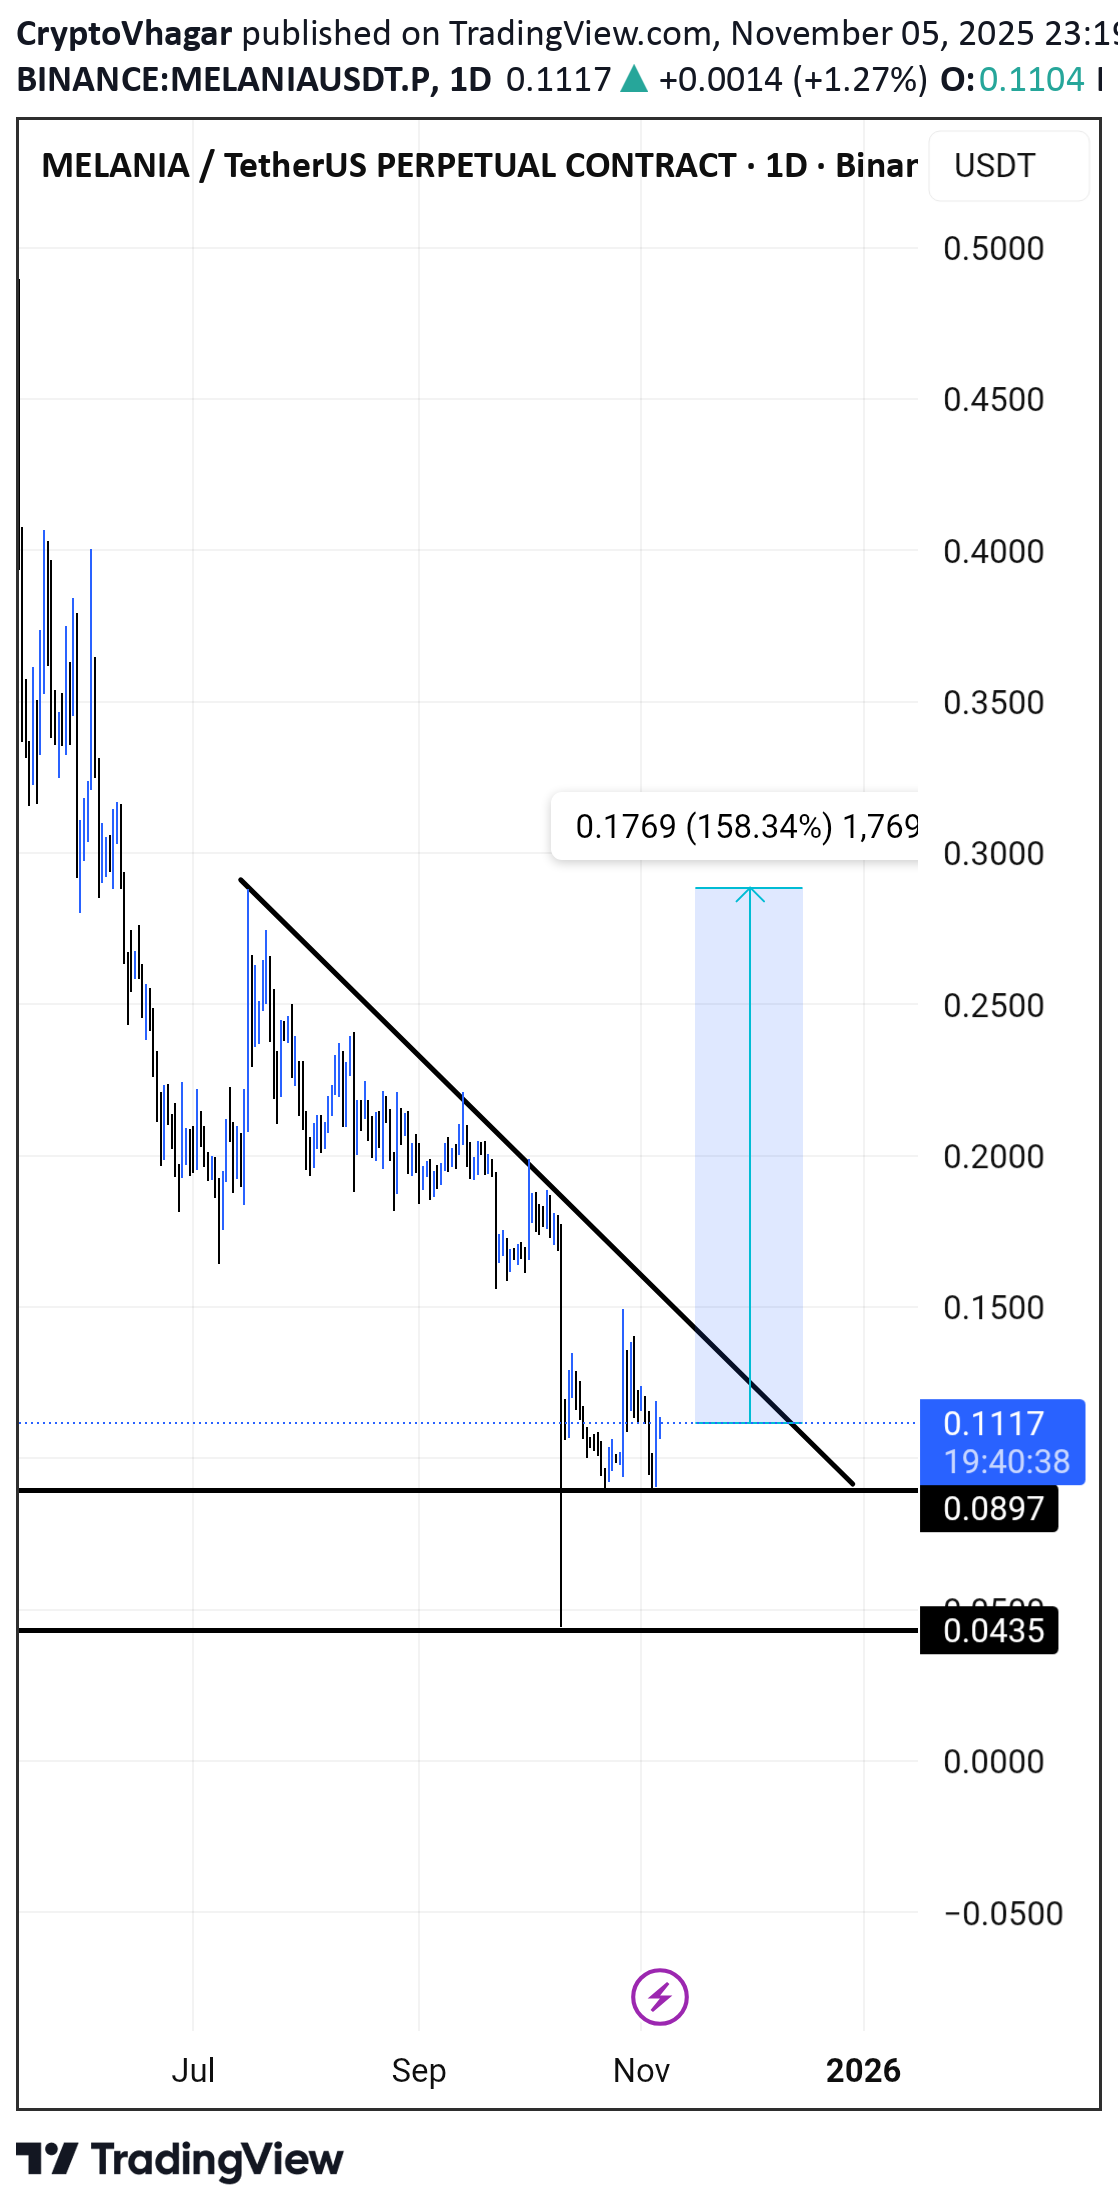
Melania çok düştü. Dip yönlü bir dönüş yaşanacağını düşünüyorum.

SevenStarBuySell
سیگنال فروش داغ در ملانیا: آیا وقت خروج است؟ (تحلیل با اندیکاتور 7 ستاره)
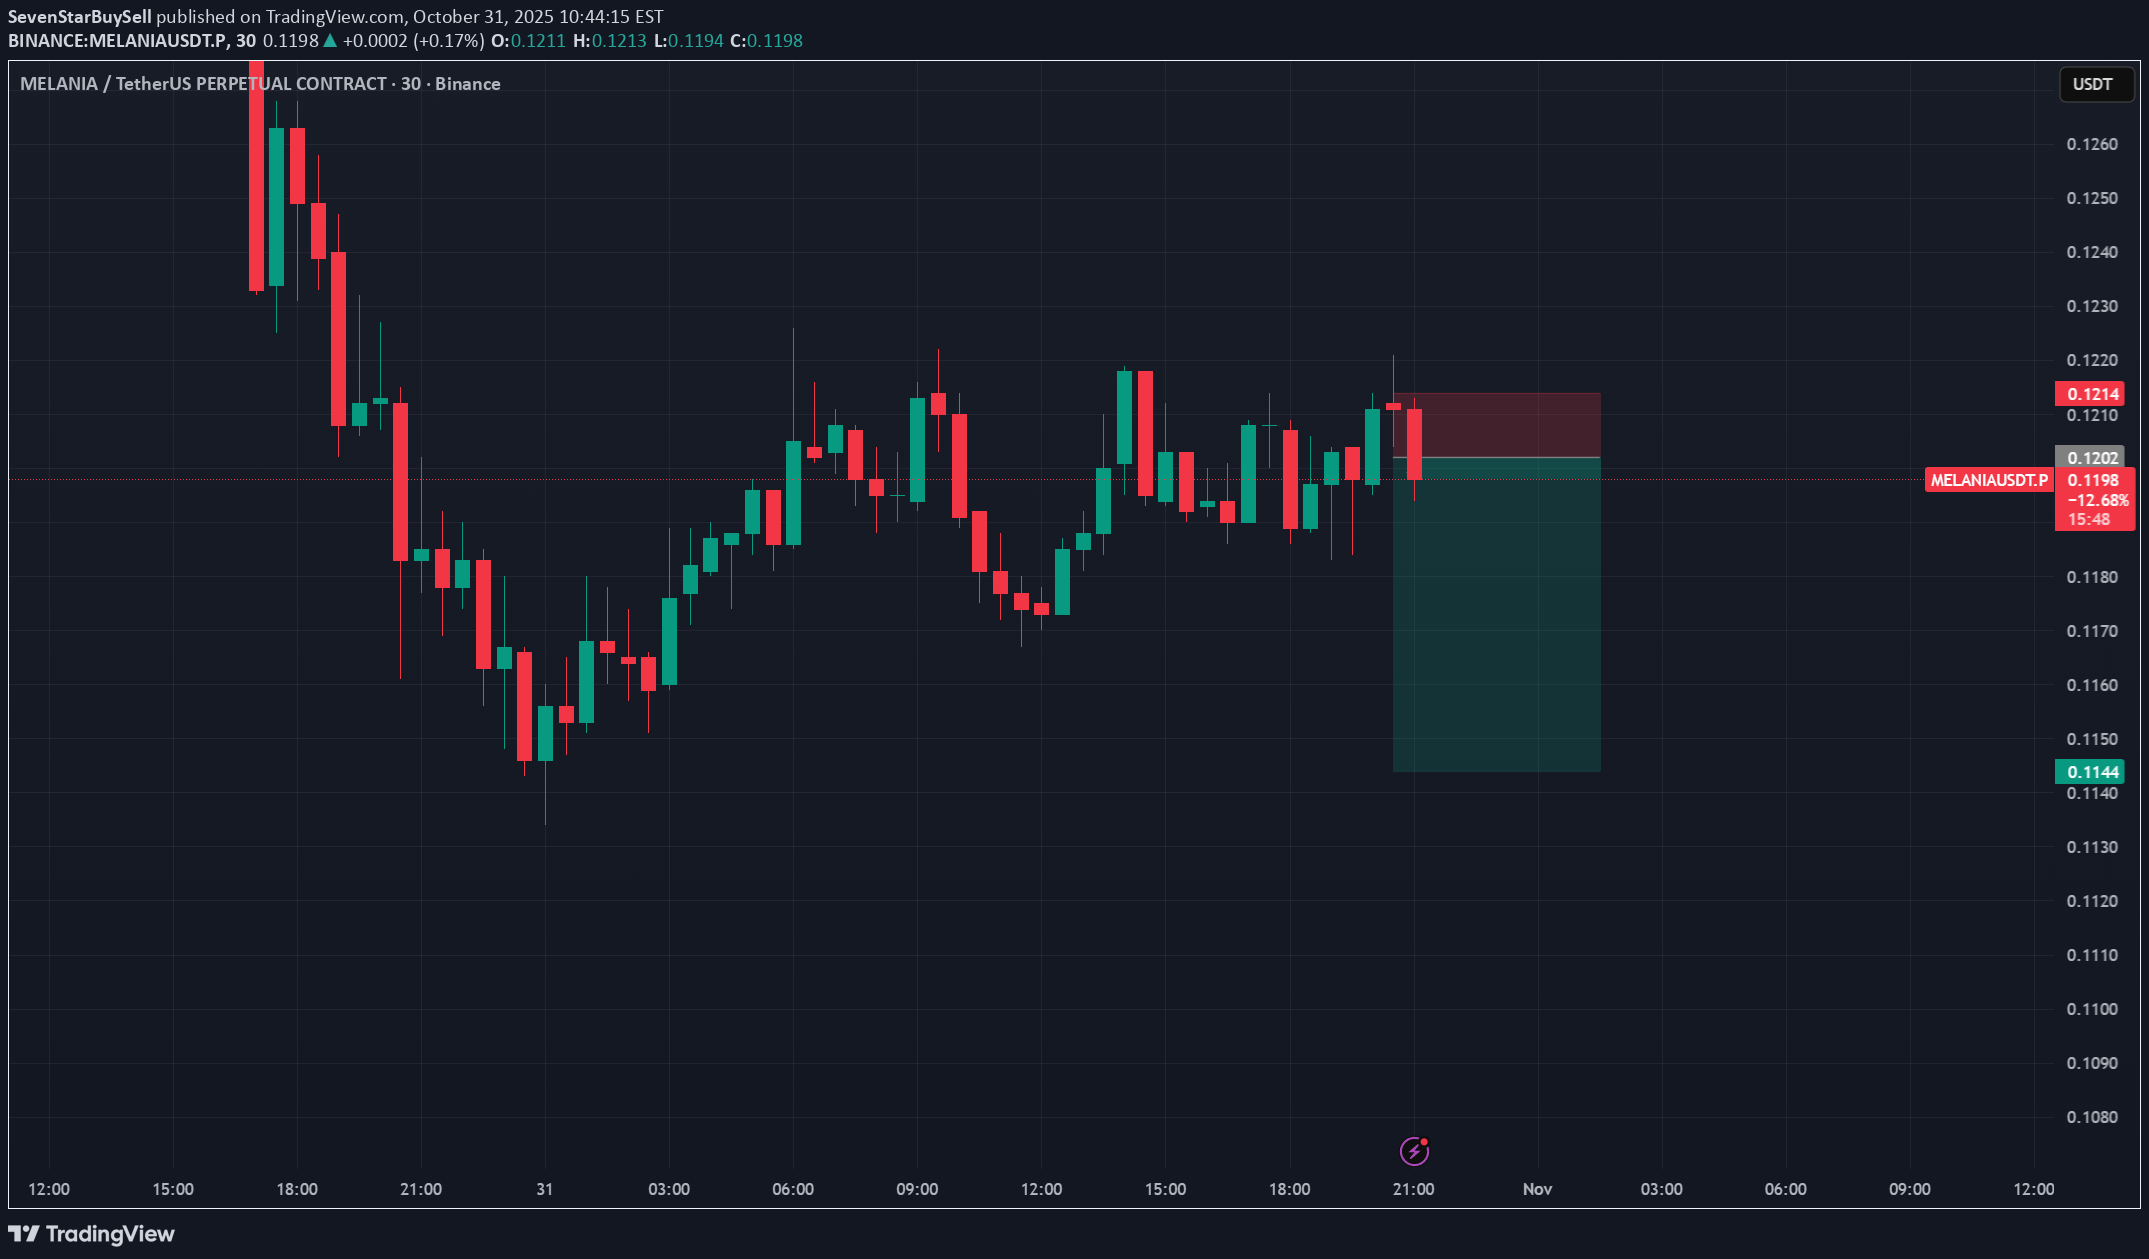
7 yıldızlı alış ve satış göstergemize göre Melania'da satış baskımız var. Bakalım nasıl sonuçlanacak? Grafiklerdeki hedefler. Gösterge erişimi için iletişime geçebilirsiniz. Ben. D YO R
SevenStarBuySell
سیگنال شگفتانگیز در ملانیا: آیا ریزش قطعی است؟ (پیشبینی فوری)
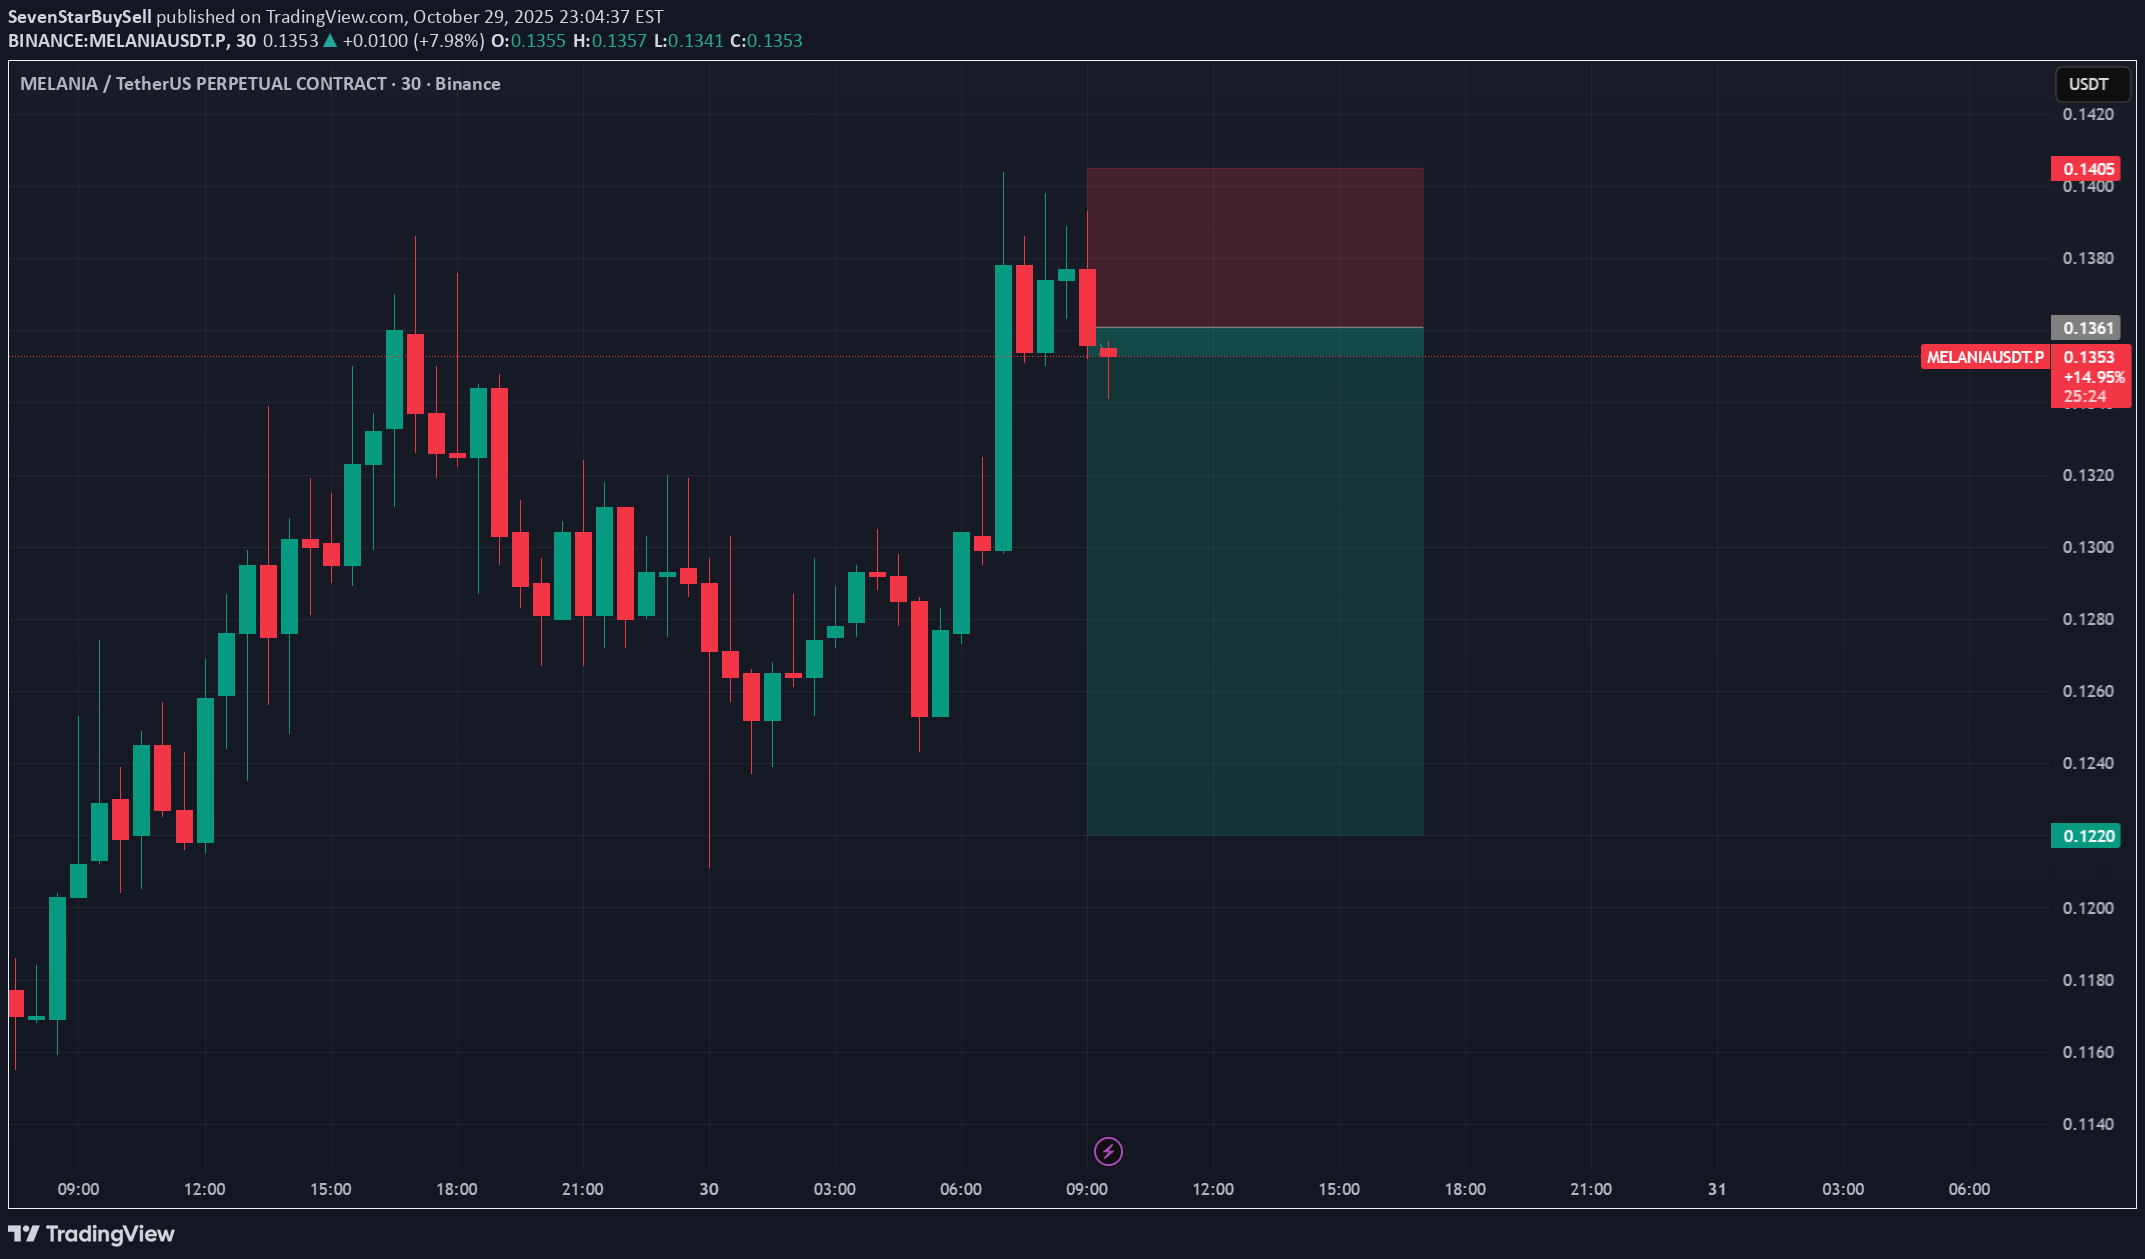
7 yıldızlı göstergemize göre Melania'da kısa bir baskımız var. Bakalım nasıl sonuçlanacak? Sinyallerimize daha erken erişim için göstergemizi kullanabilirsiniz. DYOR

MasterAnanda
Melania Meme · 877% Profits Potential & Technical Analysis

22 Nisan'dan sonra işlem hacmi yükselmeye başlar, hard. Melaniausdt son bir iniş başlatır. 8-Temmuz, aşağı trend altını işaretler ve bir kez daha işlem hacmi yükseliyor, hard. Gerçekten yükseliyor ama yine de yanlara. Çok güçlü bir yükseliş eylemi değil ama en azından düşüş eğilimi gitti. Dün 25 Ağustos; Melaniausdt, Temmuz ayına kıyasla daha yüksek bir düşük üretiyor ve yine sevgili arkadaşım ve okuyucu ticaret hacmim yükselmeye başlıyor. Gerçekten güçlü. Yeni bir yükseliş dalgasına hazırız. Melaniausdt bugün günlük zaman diliminde EMA8 ve EMA34'ün üzerinde hareket ediyor. Bu grafik kurulumu bazı çok iyi sonuçlara yol açabilir. Bir grafikte bulmak istediğimiz şey budur. İlk şey düşük fiyatlar, desteğin yakınında gerçekleşmesi. Bu burada olumlu ve daha yüksek bir düşük seviyemiz var. Sadece düşük fiyatlar istemiyoruz, aynı zamanda kurtarma sinyalleri, ters sinyaller ve onay sinyalleri görmek istiyoruz. »Kurtarma sinyali daha düşüktür. Tersine dönme sinyali, hareketli ortalamaların üzerindeki move ve onay sinyali yükselen hacimdir. Bu güçlü bir kombinasyon. Orta kuvvetli bir yükseliş dalgası,% 487'lik güzel kar potansiyeli için 1.26 dolarlık bir hedefe ulaşabilir. Melaniausdt kolayca yükselebilir. Grafikte%877 için A Hedef 2,10 $ olarak fark edebilirsiniz. Daha fazlası için yer var, bu sadece orta vadeli. Grafiğin sadece bir kısmını gösteriyorum. Namaste.

Crypto-by-PRIME
Melania / USDT : Buy every dip

Melania/USDT, kopmayı teyit ederek azalan trend çizgisinin üstesinden geldi. Bu değişim, a yükseliş hareketini gösteriyor ve fiyat şimdi bir sonraki hedefe 0,40 dolar hedefliyor. Kırılma, piyasa duygularındaki a değişikliği gösterir ve fiyat bu seviyenin üzerinde tutmaya devam ederse, daha fazla yukarı doğru movement görebiliriz. Trend geliştikçe uygun risk yönetimini sağlayın.

SpartaBTC
MELANIA Main Trend. Memes with high hype and risk. July 17, 2025
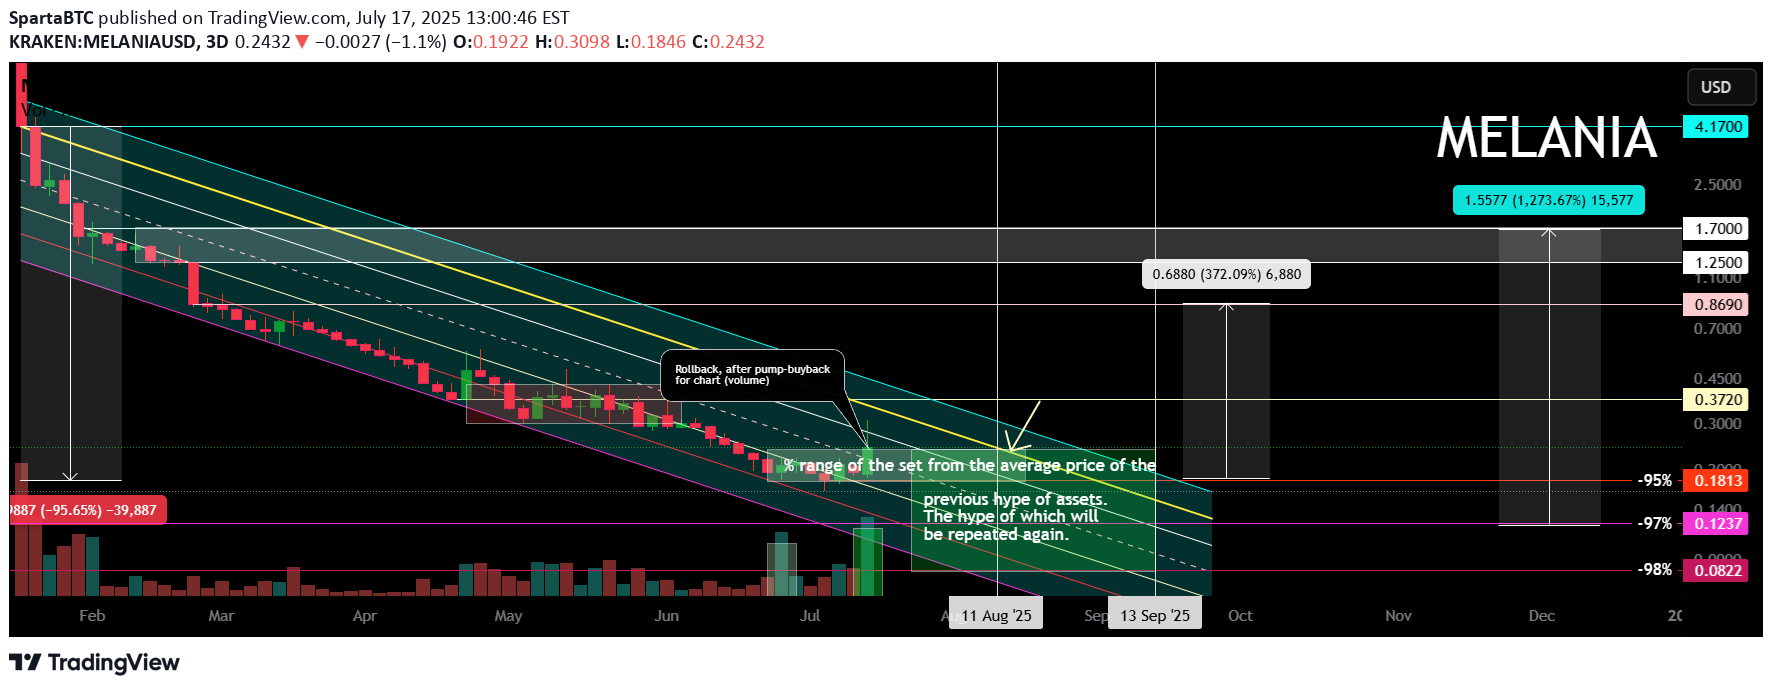
Ana eğilim. Zaman Çerçevesi 3 gün (daha az gerekli değildir). Koşullu seviyeler (yakınlarındaki bölgeler) ve maksimum düşüş yüzdeleri gösterdi (not, "etkilenen yatırımcıların" ana perakendecisinin bağlanmaya başladığı, yani maksimumun grafikten çok daha düşük olduğu bölgeden gösterdim). Şimdi şartlı olarak büyük bir hacim "gir", fiyat grafiğinde görüntülenen (bu önemlidir), yan sıkma başladı. Yerel dürtü ve geri dönüş şu anda. Ayrıca oryantasyon için minimumdan maksimum bölgelere kadar büyük bir % (kasıtlı olarak) gösterdi. Bu tür hype varlıklarında, kural olarak, orta vadeli-uzun vadeli tutma (doğru bölgeden satın alındı) önemli bir gelir gösterir. Tüm seviye bölgeleri, likidite nedeniyle koşulludur, ancak fiyat büyük olasılıkla bu aralıktaki düşüş eğiliminin bozulmasından sonra, başka bir alt mevsimi (birçoğu görüşlerinin yavaş dökümü, haber samanı ve yetersiz hedefleri nedeniyle fark etmez). Bana gelince, bu büyük % (direnç bölgesi veya 0.869'a kadar, zaman kaybetmemek için), bu memden kurtulmalısınız veya önceki pozisyondan % % 5-10) olmalıdır. Hype bölgeleri var, potansiyel kazanç bölgeleri var (solma hype, ilgi ve maksimumlardan büyük bir %). Kripto para biriminin değeri olmadığı "manuel ticaret" varlıklarında, her zaman yavaş yavaş satılır (birçoğu bunu anlamıyor), ancak satmak için bazen ilgi duymanız ve daha önce en azından bir kayıp almak isteyen "yatırımcılar" ında "umut aşılamanız" gerekir. Doğru zamanda, 1-2 tweet - "Olan güçler" deki ifadeler, düşük likidite nedeniyle pompalanır. Bu tür kripto para birimlerinde, "alt" veya maksimumları tahmin etmeniz gerekmez. Gerçek arz/talep, fayda olmadığı için fiyatlandırma farklı şekilde oluşur, ancak sadece psikoloji ve kumar bağımlılarının "ikramiyesine çarpmak". Daha akıllı olun. Bu tür varlıkları çeşitlendirin, riski önceden dağıtın. Duygular olmadan plana göre satın alma/satış yapın. Fiyat yükseldiğinde, çok daha yüksek olacağını düşünüyorsunuz, ancak öyle olsa bile, herhangi bir duygu veya kayıp kar duygusu olmadan belirli bir hacim satmanız gerekir. Benzer şekilde, fiyat düştüğünde, insanlar korkudan kaynaklanır ve satın almayı reddeder ve bunlar muhtemelen korkunun minimumlarıydı. Setin ve sıfırlamanın ortalama fiyatı önemlidir. Minimum ve maksimum gerekmez. Eylemlerinizde ve planlarınızda sabırlı ve tutarlı olun.

TehLamboX
$MELANIA | Descending Channel Breakout Confirmed
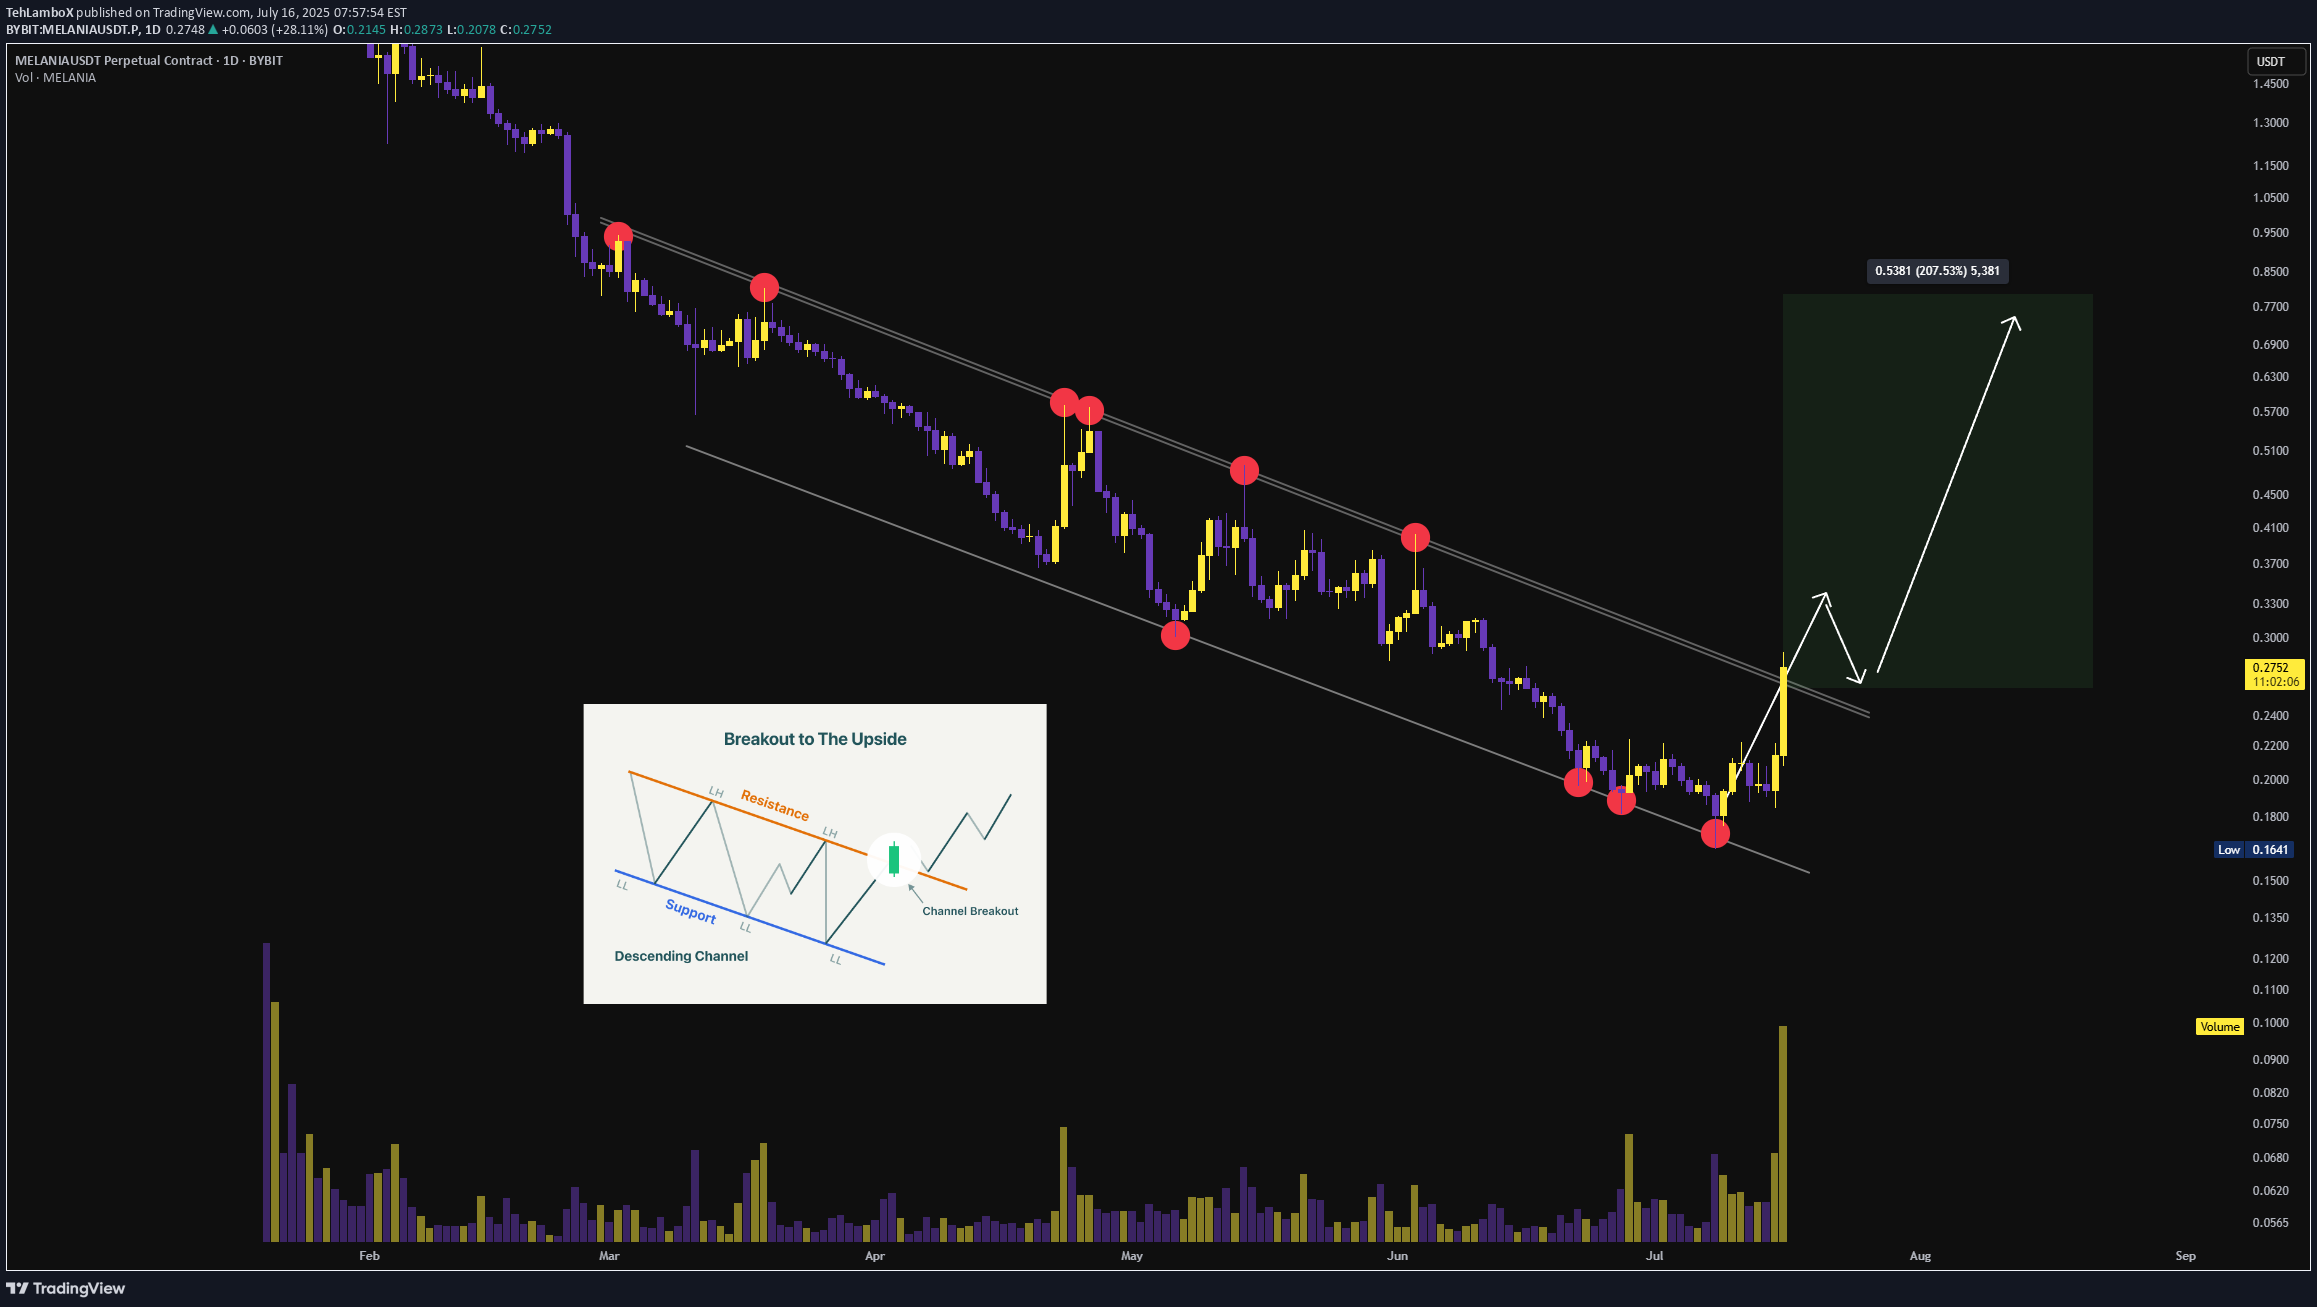
Saygın düşen bir kanalda aylarca sıkıştırmadan sonra, #MELANIA, kanal direncinin üzerinde yüksek hacimli bir kırılma bastı-güçlü momentum genişlemesi ile bir tersine çevirme yapısını doğruladı. 🔍 Teknik onay: • Uzun vadeli aşağı eğilim direnciden koparma • Kanal sınırlarında çoklu temiz dokunuşlar (geçerli yapı) • Volumetrik onay ile mum yutma • Fiyat eylemi, devam etmeden önce potansiyel yeniden testi önerir 🎯 Ölçülen hareket ve FIB projeksiyonlarına dayanan yukarı yönlü hedefler: → 0.40 $ (yapısal pivot bölgesi) → 0.50 $ (Tedarik Birleşmesi) → 0.80 $ (kanal yüksekliği projeksiyonu) Devamını teyit etmek için Breakout bölgesinin yükselişini yeniden test etmeyi izleyin
Sorumluluk Reddi
Sahmeto'nun web sitesinde ve resmi iletişim kanallarında yer alan herhangi bir içerik ve materyal, kişisel görüşlerin ve analizlerin bir derlemesidir ve bağlayıcı değildir. Borsa ve kripto para piyasasına alım, satım, giriş veya çıkış için herhangi bir tavsiye oluşturmazlar. Ayrıca, web sitesinde ve kanallarda yer alan tüm haberler ve analizler, yalnızca resmi ve gayri resmi yerli ve yabancı kaynaklardan yeniden yayınlanan bilgilerdir ve söz konusu içeriğin kullanıcılarının materyallerin orijinalliğini ve doğruluğunu takip etmekten ve sağlamaktan sorumlu olduğu açıktır. Bu nedenle, sorumluluk reddedilirken, sermaye piyasası ve kripto para piyasasındaki herhangi bir karar verme, eylem ve olası kar ve zarar sorumluluğunun yatırımcıya ait olduğu beyan edilir.