
trader-123456
@t_trader-123456

تریدر چه نمادی را توصیه به خرید کرده؟
سابقه خرید
تخمین بازدهی ماه به ماه تریدر
پیام های تریدر
فیلتر
نوع پیام
trader-123456
Chainlink

با توجه به واگرایی ، پیش بینی تظاهرات برتر و موقعیت کوتاه باز آسان بود.
trader-123456
Coinbase
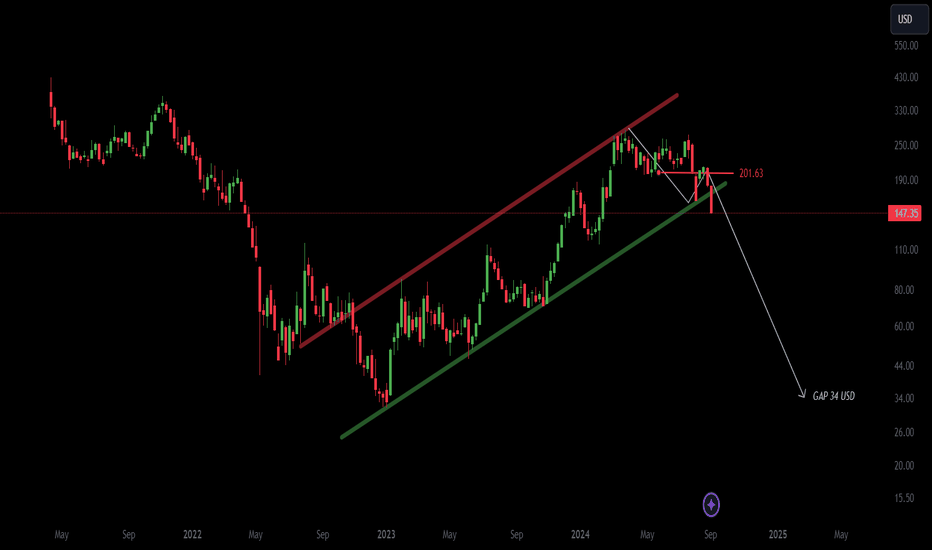
ممکن است یک تله خرس کلاسیک سپتامبر در حال حاضر ادامه یابد. اما اگر بسته شدن بالاتر از 200 دلار وجود نداشته باشد و در ماه های بعد پول از خرده فروشان شروع نمی شود. بنابراین احتمالاً پایین آمد ، هدف افراطی شکاف 34USD است.
trader-123456
MEME COIN PEPE

MEME COIN PEPE اگر بخواهم بین دو طرحی را انتخاب کنم که فکر می کنم PEPE اکنون یک ماه است که در منطقه آبی انجام می دهد. ، قطعاً طرح توزیع خواهد بود. حتی خط روند اصلی پایین شکسته در حال حاضر چندان خوش بینانه به نظر نمی رسد. بزرگترین حرکت توکن ها از بازیکنان بزرگ به دست خریداران دیوانه به طور منطقی در مرحله شیدایی اتفاق افتاد و من فکر می کنم بقیه در طول توزیع این ماه اتفاق افتاد. نمیدانم چند بار تکرار این طرح را دیدهام و همیشه افراد را ترک میکند توکن های بی ارزش بدون توصیه معاملاتی، قیمت ممکن است با توجه به یک خبر منتشر شده افزایش یابد، اما به احتمال زیاد بعداً به همان جایی که شروع شده است ختم شود. یکی دیگر از مجموعه شیت کوین. ارزش فعلی 0.00008221
trader-123456
CARDANO

برنامه بلند مدت من برای ADA ، اما من حتی نمی دانم که فردا چه چیزی را به وجود آورد. اعتبارسنجی وقتی خط زرد شکسته می شود ، اگر آزمایش و خرید با حجم کافی وجود داشته باشد ، من این را پایان نهایی مرحله تجمع می دانم. هیچ توصیه ای برای تجارت.
trader-123456
LITECOIN

LITECOIN اگر تاریخ در LTC تکرار شود، به زودی پمپاژ آن آغاز خواهد شد. البته، او میتواند قبل از سفر، فتیلهای را در فضای سبز بیندازد تا پسران ماه را خیس کند، اما تعداد فیتیلهها در این الگوی پرچم در شش ماه گذشته به رقم باورنکردنی رسیده است، بنابراین یک مضحک خواهد بود. این برای تجارت نیست، فقط نظر من است. شاید این دفعه فرق کنه :)
trader-123456
ETH

ETH لوزی ویتالیکو یک تله گاو نر بسیار طولانی را نشان داد. اما در لحظه ای که برای پمپ بزرگ بعدی قدرت جمع می کند، من در مقابل بزرگترین مقاومت صعودی نخواهم بود، که هرگز اتفاق نخواهد افتاد. آن را به شدت بالای 2000 دلار بشکنید و به عنوان پشتیبانی تست کنید و سپس می توانیم در مورد روند صعودی صحبت کنیم.
trader-123456
ETH - Bull Trap

ETH - تله گاو نر بازار سازنده سناریوی سال 2018 را تکرار می کند، شکستن خط روند گاوها را فریب می دهد و سپس آنها را به داخل می اندازد. the abyss. نظر: من در نظرات سؤالاتی در مورد هدف کوتاه دریافت می کنم، آن را اینجا می نویسم تا مجبور نباشم بیش از یک بار آن را بنویسم، پاسخ من این است که نمی دانم. یک سال پیش، من ایده را ایجاد کردم که در آن تله گاو نر قرار میگرفت. و پس از آن به 1000 دلار، پیش بینی وضعیت در آنجا بسیار آسان بود و اگر کسی دقیقاً از این برنامه پیروی می کرد که شبیه به یک کودک کوچک بود، مدت ها پیش می توانست با نهنگ ها در کارائیب شنا کند و مجبور نبود با آن دست و پنجه نرم کند. اینجا کوتاه یا بلند.. شما حتی لازم نیست بنویسید که من یک rekt می گیرم، زیرا من در بازار فعلی هیچ موقعیتی ندارم، بنابراین اگر شرط نبندم، منطقاً نمی توانم ببازم. مهم نیست که چه حرکت نادرستی ETH نشان میدهد، خطر زیادی وجود دارد که در مرحله شکستن آن قرار گیرد. ماه های آینده من فقط می خواستم در مورد مناطق بالقوه خطرناک هشدار دهم اگر این طرح خوب پیش نرود، بله معجزه گاهی اتفاق می افتد اما من به معجزه اعتقاد ندارم… تله گاو نر هشدار داده شده 3500 دلار و کوتاه تا 1000 دلار ✔ اخطار کوتاه 2700 دلار ✔ اخطار کوتاه 2000 دلار ✔ اخطار کوتاه 1750 دلاری (ادغام) ✔ اخطار کوتاه 1670 دلار ✔ اگر متقاعد شدهاید که نهنگها قبلاً در منطقه 1000 نهنگ جمع شدهاند و موشک آماده پرتاب است، پروازتان به ماه مبارک باشد. نظر دهید: باید اعتراف کنم که موشک برای پسرهای ماه کمی بیشتر از آنچه انتظار داشتم بلند شد، اما هنوز نظرم را تغییر نداده ام. موشک باید از این منطقه خطرناک عبور کند. نظر: اگر شکستی زیر 1400 وجود داشته باشد، من انتظار تست پشتیبانی را در حدود 1200 دارم. بازگشت به منطقه قرمز، تایید شده است که این حرکت به سمت بالا فقط یک تله بود. نظر: موشک بر فراز منطقه خطرناک پرواز نکرد. (نمودار نمودار) آن را به زیر سطح حمایت شکست، حرکت صعودی می تواند برای انحلال موقعیت های فروش کار کند. اما بازار در حال حاضر به سمت بالا حرکت می کند، بنابراین احتمال آن کمتر است. در هر صورت، اگر سطوح بالا به طور معتبر پاک نشده باشد، فکر ورود به آن فایده ای ندارد. نظر: اگر فکر می کنید که در این بازار فقط باید خط روند را بشکنید و روند صعودی در راه است، در معاملات خود موفق باشید. نظر: من انتظار رد شدن از پشتیبانی شکسته و آزمایش بعدی پشتیبانی 1200 را دارم. نظر: گوه در حال افزایش را مجدداً آزمایش کنید، هنوز در ETH چیزی صعودی نیست. کاهش قیمت و سپس بازگرداندن آن صعودی نیست. احتمالاً چند معاملهگر باعث توقف ضرر شد و چه تعداد افراد مجبور به فروش شدند. سپس یک پشتیبان تقلبی ایجاد کنید تا تا حد امکان معاملهگران کمتری بخرند و بعد از چند ساعت آن را دوباره پمپ کنند تا بسیاری از معاملهگران وقت خرید نداشته باشند. بازار سازنده خوب بازی می کند. وقتی رد شد، انتظار بازگشت به هدف قبلی را دارم. نظر: تنظیم برای خرس ها تا اینجا خوب به نظر می رسد. به نظر میرسد که تنها یک شکاف کاذب در گوه در حال افزایش وجود داشته است، بنابراین همانطور که خرسهای پایین را فریب داد، به احتمال زیاد گاوهای نر بالا را فریب خواهد داد. اگر شمع روزانه در زیر خط روند پایین بسته شود، احتمال یک شورت زیاد است. بستن معتبر بالای 1800 این ایده را باطل می کند. نظر: اول خرس ها را گول بزنید، سپس گاوها را. زمان برای این رالی بازار نزولی رو به اتمام است.
trader-123456
Litecoin

Litecoin Many traders are bullish on LTC due to the halving. It reminds me a bit of the situation when he was at 100USD and it was just before the crash. I'm not saying it will happen again here, but the risk in this area will be high. I like LTC, I would easily put it 1st of all coins. LTC reliably serves exactly the purpose for which it was created. I just keep getting the feeling that the whales still haven't reached their destination. I expected the LTC to start the descent earlier, but maybe this is the target destination for the whales where they are just doing the distribution for +100% profit and then start the migration to the plankton rich area. I have no idea if it will happen, but if you choose a part of the profit at this point or set a stop loss appropriately and do not enter leveraged long positions here, I think it will be reasonable.Comment: I didn't expect LTC to go this far, so I don't dare to guess if it's the end or if his favorite ending 30% pump will follow.Comment: LTC is currently exactly in the area where the big decline followed in May, this may not happen again, but a test of the trend line in the 82 USD area is likely.Comment: LTC is at a decision point. The ascending channel has not yet been broken. If the channel holds, the bulls will head for $120, but at the moment it is quite uncertain, LTC is at a point with a possible 100% profit for 28 days, if the distribution took place, there is a risk that it currently gives a chance to buy on support and subsequently there will be a breakthrough under. But this will be confirmed after the lower trend line is broken and confirmed as resistance. If this happens, I expect a subsequent significant downward movement.Comment: LTC potential bearish flag in log. chart. Bulls lose strength, after 50 days they return to the same place, for bullish continuation it is necessary to break above the red zone. I don't want to say that it's impossible, because LTC has surprised me several times, but I have to admit that there are a lot of obstacles. If the line is broken in the 75 USD area and confirmed as resistance, a bearish flag can play out.Comment: A breakout of LTC below an ascending channel, if previous support is confirmed as resistance, can create a descending channel into the demand zone.Comment: Bears are strong, currently trying to break the support in the log. chart.Comment: LTC immediately broke through the descending channel that I prepared for him there, I expect further decline. Watch out for the SP500Comment:Trade activeComment: Just as I expected, rejection from the broken descending channel.Comment: There is a good chance that the bulls will take the $60 area for a while and there will be a temporary pullback, but this is crypto, so I have an idea in reserve for the extreme case that the bears manage to break below $60, followed by a decline to the previous low. The whales re-suck the plankton and create a double bottom (attracts the bulls). Bear flag test (+50%).Comment: Middle path at breaking 60 usd and the same potential 50% profit.Comment: The LTC may currently be in the end zone if the rejection occurs. I don't think he would have given the people trapped above a chance to leave without loss. Only a valid breakout back above the trendline will invalidate this idea.Comment: Looks like rally time is running out. If the bulls fail to break through the resistance and close there, then LTC will not levitate here. I think the bears will head for the June low area. If there was a drop even lower, I consider it a premium price for the next cycle.Comment: LTC is probably preparing for a false breakout from the descending channel. A subsequent liquidation of the short positions can make his favorite 40% finish. Buyers after a break through resistance will provide liquidity for distribution.
trader-123456
BTC

BTC BTC Lots of people expect 20K and want to shop there. If that happens, I expect a nice reflection there (maybe 40%), but precisely because the 20k tech was a very predictable bottom, I expect a correction even lower. The correction will be fast (not like 2018). Due to the rapid recovery (stock exchanges and miners also need to eat something). Not the financial board. Just for fun.Comment:Comment:Comment:Comment:Comment:Comment:Comment:Comment:Comment:Comment:Comment:Comment: The sand continues to pour down.Trade activeComment:Comment:Comment:Comment:Comment:Trade activeComment:Comment:Comment:Comment:Comment: On retest, there was a break above support (new resistance), there was a quick rejection. On closing under, I expect target number 1.Comment:Comment: Many traders see a triangle test on BTC and believe in an upward continuation. Yes, there is a small chance. Rather, I see a bearish flag that could reach the 14K area and failure to recapture 20K could result in a final capitulation. There is still greed in the market, we are not at the bottom.Comment:Comment: In a bull run BTC goes significantly above its true value, in a bear market it goes below its true value. This cycle will be no different.Comment:Comment:Comment:Comment:Comment:Comment: I use Litecoin as an indicator of what stage the crypto market is in because it's not a shitcoin or a meme coin. So there is no noise around. There hasn't been a close this long (50 days) below major support since 2017. If it fails to close above the (valid) support, I expect a more than 50% downward correction by early September at the latest.Comment: Created just to imagine if BTC kept repeating the same cycle.Comment:Comment: My LTC indicator is still confirming my opinion on the crypto market. If there is no turnaround, I see a good chance of reaching the finish line.Comment:Comment:Comment: The sand started pouring down a few days later than I expected.Comment:Comment: Current situation on LTC vs BTCTrade activeComment: We are getting close to our target, watching the area of the June low.Comment:Comment: I created this chart sometime in June, the current situation there looks like this. BTC is at a crucial phase.Comment: When the stock market starts trading and it is confirmed that the SP 500 is currently in the Bull Trap, BTC will follow.Comment: The chart clearly shows that there has been no change in the market yet, LTC is still under support (unless there is a valid close above $65), the current situation seems to me to be set up for the big players starting to come back into the market and can short it . Its simple whoever tried to catch the bottom will likely provide liquidity, LTC is 60% higher than the low and that would be an incentive for the big players to dump it now. I still see more than a -50% drop in BTC and LTC before the market turns around.Comment:Comment:Trade activeComment: Sorry for bringing LUNC garbage to the profile for BTC, but to give you an idea of how the cycle works, here is an illustrative example, the cycle compressed into 30 days. People never learn. It will happen again and again.Comment: In the previous post I warned that the stock exchange will confirm the bull trap and BTC will follow suit. But crypto players are already starting to have a good estimate on the market and preferred to send it down earlier.Comment: BTC has broken below the Real Value, if it will not be able to get back (Valid), the Blow off Phase can be triggered.Comment:Comment:Comment: BTC Hourglass is about to make another sand fall, they have worked reliably so far. Unless the BTC hourglass fails, but it has no complex mechanism, just sand.Comment: It looks like the market maker used his favorite 6% pump as bait again, there was already a lot of fear in the market, so some greed needs to be instilled again. It can fall from the pump, but there is also the possibility of going sideways, where traders are trapped before the breaking point. Simultaneously with SP 500, where I correctly determined the place for the end of the Bear Market Rally and the point for the Bull Trap.Comment:Comment: I made a small update to the June 6th idea. A few lines on a graph often give a better estimate than a hundred indicators. Simple things often work well.Comment: So far everything is according to plan, the rocket is fueling and the Moon Boys are boarding.Comment:Comment: The Apollo 1 rocket finishes fueling on the LC-34 launch pad. There will be several days of pre-flight testing. After rocket engine ignition there may be a slight jump upwards. Subsequently, a fatal malfunction with a subsequent accident is likely to occur.Comment: I uploaded Elon to the BTC page because he had a lot to do with BTC. He used exactly the right moment in the BTC chart and released a positive news for BTC to hype the market and trigger a stronger mania phase. Elon has a sense for simple design and the Tesla chart follows a simple formula. From the point I marked back in August, Tesla has already written off -30%.Comment: Don't be easily lured in, it often looks bullish right before a crash.Comment: No matter what false moves occur, I still believe that -50% drop on BTC is inevitably coming.Comment: The Apollo 1 rocket completed pre-flight tests and fired its engine. As I expected, there was a slight bounce, fueled by the liquidation of short positions. It is currently in an area that attracts many bulls, if a large number of them pile up on board, the rocket will overload and likely crash.Comment: Here are the situations I guessed correctly, but past success doesn't guarantee anything in the future, so it's possible I'm wrong on this point. But the way up doesn't make sense to me right now, not in this way. I don't believe the market maker wouldn't go down first. It is as tempting to him as a sweet shop to a small child.Comment: I wondered what this cycle would look like without manipulation and without the use of trading bots that create fake trades (some exchanges have fake trade volume of up to 95%). Is the moment approaching when most bots will receive a SELL command? We'll see.Comment: Watch out for a bear hug on Monday so it's not your last :) Only a valid close above the short zone can change the situation.Comment: The Apollo 1 rocket overloaded and lost the important flight level of 19600, the next flight level is 18000, there I assume that there will be an effort to gain altitude back up, but if the attempt fails and it will fall below. Houston we have a problem.Comment:Comment: The Apollo 1 rocket has dropped below another flight level of 18,000 and here it has trouble regaining altitude because it is already in the atmosphere where there are dust particles of sand and sand is not good in a rocket engine.Comment: The Apollo 1 rocket is still having trouble breaking out of the sandy atmosphere. A repeated fakeout is possible, but it would be embarrassing from the market maker. I believe many bulls would still be enticed, but repeating the joke is no longer funny.Comment: I recently uploaded a Tesla graph here, so let's see how it follows the route. From the beginning of the route, the Tesla should have covered -50%, it almost reached the target -46%, but I think it will only charge the battery a little and finish the journey down.Comment: I posted this fakeout alert on October 29th, it was playing well. I currently see the possibility of a descending triangle. If a market maker looks at their order books and sees a lot of short positions, there may be a smaller draw to liquidate them before going down.Comment: The market maker activated his popular 6% bait.Comment: I added another short zone, we'll see if it goes as easily as last time or if the market maker is preparing a surprise for us here.Comment:Comment:Comment:Comment:Comment: Whenever the rocket left the BTC hourglass atmosphere, it was only for distribution purposes. It was always enough to enter a short and the success rate was 100%. There will be a moment when the rocket leaves the clock permanently and takes off, but I'm not sure it will be this moment, I can also imagine a false start and subsequent crash about the R.V.Comment: Tesla is slowly reaching its target. From the point I determined in September, right now -50%.Comment: The touch is over, the market maker is currently looking for shocking news for the market, or he will have to make it himself and then use it as a trigger for the dump.Comment: The Apollo I rocket is still preparing to fly to the 10K region. The whales rescheduled their Apollo 7 flight for the simple reason that there are still many traders who are hungrily buying every dip and running DCA at 50K, 40K, 30K, 20K and other nonsense... so they have to wait until the retailers are out of money and then hit the real bottom where the whales buy and we patient. FOMO must be suppressed at the ATH, but also on the way down.Comment: In February I created an idea called (Bull Trap on BTC ?). Playing well so far, history repeats itself. Here I created an idea - Bull Trap on BTC in 2025? It is likely to happen, the market is made by people and people do not change.Comment: One of the ways whales could get fuel for their Apollo 7 rocket.Comment: It's possible that I'm already too bearish, but I don't like traps. First I'll see if the bulls stay alive.Comment: I see that the market is absurdly bullish again. It is currently under resistance, yes, the line is not a wall, but so far there has been no crossing and, above all, no valid closing above, so it is not entirely reasonable to enter at this point. As a reminder, I'll re-upload similar situations where the market was ridiculously greed.Comment: BTC is currently testing its golden vein, if it is rejected it would finally go to the final bottom. It would be about time.Comment: The market was set to go down, realistically it would currently be in the 13700 area, but the whales stepped in and liquidated the short positions. This market is funny, one person or a small number of individuals who have a lot of capital can win over the rest of the market. The green candle, which subsequently formed only due to the liquidation of short positions, acts as a magnet and subsequently absorbed a lot of moonboys due to FOMO. But it's FOMO pushed too far against market belief, so nothing healthy and I don't know if it's sustainable. He is currently in the danger zone, so nothing is decided. I don't know how this liquidation of short positions and then trying to trigger FOMO will play out, if it turns into a bear market rally, it is possible. But I am still convinced that the real bottom will come later. And these green candles only confirm it to me, because if it still looks bearish and only goes down, it is very easy to wait to buy, but few people can stand such growth anymore and jump in. And the bottom is not for everyone, the vast majority have to lose for the minority to take such large and meaningless percentage increases that are in the crypt. Moonboys think money grows on trees in crypto, but crypto doesn't produce any money. If you have a profit, someone on the other side had a loss.Comment: For a few more days, the moonboys will provide liquidity to the whales to make the distribution. After the 18K support is broken and then confirmed as resistance, I expect a return to the original trend.Comment:Comment: Be careful here and don't succumb to FOMO because there isn't a reason to be yet. BTC is in a dangerous area where rejection may occur soon or a bit higher. If there is a valid breakout above and you close above it, it makes sense to look at it again. But right now, all it takes is one bad news and the market collapses like a house of cards.Comment: Bulls should be more bullish here, it is necessary to break above resistance and then break above 25K to open the way to 30K. If the market maker sees weakness, he will use the hammer. This eventual rally is quite uncertain for me, so I will patiently wait below for a rejection here, at 25K and or above. There is a good chance it will come back, and if it doesn't, I can live with not being a BTC shrimp.Comment: Many bulls are already calling for a new bull run, but I think such a call is ridiculous and very premature. So far nothing bullish has happened, according to history there has always been growth before a crash. It stands to reason that if you need to get liquidity for distribution, you need to convince traders that we are going up. I even think that in the next bullrun, BTC will not cross its ATH for the first time in history, because if it were to reach the 100K area, surely everyone would want to take at least some of that profit there and that is not possible, the whales need the opposite side of the buyer at that time. There is a possibility that many short positions will accumulate below the ATH and the subsequent liquidation will move higher. In any case, one doesn't have to be a super analyst to see how the performance is constantly decreasing as the global market cap increases, it is getting harder and harder to achieve the same performance as in previous years. This may change if a major event occurs in the future. But be careful and don't invest more than you can afford to lose.Comment: Just my opinion so don't cancel your Lambo reservations and do your own analysis.Comment: If a miracle happens and Jesus Christ gives life to this cat and she subsequently overcomes this resistance (and especially a valid closure, because the amount of fakeouts is ridiculous), then maybe I will become bullish. I think it will be more realistic to come to the funeral later.Comment:Comment: When returning to the risk zone +10% to bounce and create right shoulder. You can try to catch it and put a stop loss, there is always a possibility if a head and shoulders form and many traders see this pattern, then again the market maker can liquidate the short positions and move a bit higher. My guess is that the right shoulder is more likely to take more bulls on board and then point it down.Comment: The bulls tried to break through the border for 7 days, but the bears defended it. The bulls are retreating further from the border to the safety of USDT (although calling USDT a safety is probably bold). Right now there is a potential formation of right shoulder (head and shoulders inverted pattern). If this pattern is not invalidated and especially if the lower trend line is still valid, I will be on the side of the bears.Comment: BTC is only retesting the trend line, which I previously identified as important and decisive for me. Be aware of the possibility of a rapid decline when rejected (watch out for the fakeout above). I understand that traders are excited to go up after such a period of decline, but that's exactly why it's dangerous. Few people caught the upward movement in January from the bottom, so when it soon starts to fall to lower levels, traders will buy it, because they don't want to let the opportunity slip away again, and this will be an opportunity for market makers to move deeper and deeper, because long positions will be liquidated. Or I'm wrong and it's already going to the moon, as a lot of other ideas here have already pointed out.Comment: Observing market practices, I'm glad that I didn't end up selling my car and kidney, and didn't buy BTC just because it broken some ridiculous trend line that the market maker prepared for you there.Comment:Comment: BTC has broken back below its real value and is now trying to get above, on rejection I expect the blow of phase to continue. I still consider it a manipulation on the part of exchange offices. To initiate trading interest and provide liquidity for subsequent distribution. Exchanges logically need fees from purchases and sales, and they like it best when people sell at a loss.Comment: No method works 100% but this one worked pretty well for me, we'll see if it works again. I was always three steps ahead of this slump. There is currently an option to play the pennat pattern. Bearish on BTC and Bullish on USDT.D. Playing out the pattern makes sense to me because they let people buy and go long over the weekend and they can dump it in the following hours, the target is the demand zone.Comment: Bears, don't give up yet, hope dies last :)Comment:Comment: For a minute it starts to rise exactly where I expected. It looks like the bears will protect it if today's daily candle closes above support.Comment: As I watch the BTC pumping, I am reminded of an idea from September 13th. Will the situation repeat itself? Probably yes. Calling it pumping is a bit of an exaggeration if the market maker lowers the price in advance and then returns it to the same level. For how many traders probably the previous decline activated a stop loss and how many preferred to sell at a loss. Subsequently, the bottom did not let him into the demand zone because there would be a lot of buying, then he pumps the bearish pattern quickly up and people buy something at the top again, then you flush them. BTC has been in this range for almost 300 days, it's a playing field that the market maker is completely in control of. In that time at this range I have already heard 1000x bull run calls on every small pump. I don't even want to imagine how much money was transferred from traders into the hands of the market maker and how many dreams of getting rich quick were extinguished. I can't predict what will happen, even if it breaks above the range, it will pump higher within a few hours, so most people will miss the move and then create another range to distribute there. A bull run will not be triggered from this range. Just my opinion.Comment: Regardless of the bulls getting higher than I expected, I still haven't changed my mind about this bear market rally. The month of May is approaching, there is quite a risk that the whales will take the profit and swim off to enjoy the warm waters of the Caribbean. Pensioners are already talking about a guaranteed bounce from the 25K area and a continuation of the uptrend while waiting in line at the supermarket, so I remain skeptical of this rally. If it goes down in the next few months, I will focus on the area of the previous low. If we are there before September, I can imagine that the double bottom will attract a lot of bulls, then the big players can send it under and the subsequent activation of the stop loss could cause a drop to the 9-12K area. This rally is a climb against the direction of the sand, and the sand will eventually reach the bottom. Why should this happen? Because they can do it, who's to stop them? I'm watching the Tesla chart, which has similar market behavior to BTC.Comment:Comment: Short positions are accumulating on the exchanges, so a false price increase can be expected before the start of a decline, but no manipulation is sustainable in the long term.Comment: Looks like USDT.D is ready to go up and send the crypto down.
trader-123456
Cardano

ada پس از شکست حمایت 330 و تایید به عنوان مقاومت، من انتظار حمله عقاب و ادامه در لانه را دارم. فقط در صورتی که یک بسته بالاتر از مقاومت معتبر باشد می تواند این idea.comment را باطل کند: ada با معامله گرانی که می خواستند خیلی زود کوتاه بیایند و منتظر شکست به زیر 0.330 نبودند، خوب بازی کرد. باید مثل عقاب صبورانه منتظر شکارت باشی. منتظر بازگشت احتمالی به پایین ترند line.com باشید: عقاب دقیقاً در جایی که باید انتظار داشت، رد را تماشا می کند، اگر ناحیه 0.330 شکسته شود و به عنوان مقاومت تأیید شود، ممکن است حمله ای دنبال شود. نظر: نظر من نزولی است، اما اگر ببینم که گاوها واقعاً قدرت دارند و این فقط یک تله گاو نر نیست، ممکن است نظرم را تغییر دهم. زیرا شکستن خط روند و سپس آزمایش آن صعودی است و دعوتی است برای گاوهای نر طولانی، اما در بازار فعلی مکان مناسبی برای تله گاو نر است. من در حال حاضر در نمودار ada ضعف می بینم، گاوها نتوانسته اند از آن عبور کنند. من شاهد رد مقاومت و در حال حاضر شکسته شدن زیر خط روند پایین هستم. اگر این فقط نمایشی برای خرسها باشد و گاوها تلاش کنند یک بار دیگر از آن عبور کنند، نمیتوان آن را رد کرد. اما اگر هیچ شکست و بسته معتبری در بالا وجود نداشته باشد، هیچ چیز تغییر نمی کند. اگر به نزول خود ادامه دهد، احتمالاً ظرف دو ماه به پایین ترین سطح خود می رسد. من می توانم یک ته گرد را در زیر تصور کنم. نظر: ada در حال تلاش برای شکستن 0.330 است. از قبل آن را بشکنید، عقاب منتظر غذا است و بسیاری از تاجران دوست دارند چمدان های خود را پر کنند. نظر: ada به نقطه ای رسیده است که می تواند قبل از ادامه کاهش، یک عقب نشینی جزئی رخ دهد. اگر مستقیم خراب شود، ممکن است اتفاق بیفتد. نظر: عقاب حمله کرد. نظر: در idea قبلی من انتظار یک جهش کوچکتر را داشتم، این اتفاق افتاد. اما ما هنوز در طرف خرس هستیم، بنابراین این یک بازی خطرناک است. نظر: ada به برنامه پایبند است، تا اینجای کار به نظر ادامه نزولی است. بازگشت بالای خط آبی این نظر idea. را موقتاً باطل می کند: فکر می کنم ada هنوز زمان زیادی تا بازار صعودی بعدی دارد، احتمالاً در حال حاضر در این مرحله از چرخه است. باید از طریق تثبیت طولانی تری به پایین بروید. اگر x10 ada بالا رفت، حداقل مقداری سود از آنجا ببرید یا ببینید که دوباره پایین می آید.comment:comment: ada حتی به اولین پشتیبانی هم اکتفا نکرد و فوراً دومین فروش مناسب را شکست. اخبار را نادیده بگیرید، در واقع نمودار برای این حرکت خیلی قبل از اینکه هر گونه اتهامی توسط دوم منتشر شود تنظیم شده بود. این تنها محرک حرکت و منطق بازار است که چرا این اتفاق افتاده است. هنگامی که زمان مناسب برای بالا رفتن است، اخبار مثبت تصادفی وجود داشت (cardano برنده اختلاف شد، شارژ متوقف شد، یا چیزی شبیه به آن). دنبال کردن اخبار فایده ای ندارد، همه چیزهایی که باید بدانید در نمودار کامنت است: به نظر من، ada هنوز در حال ساختن پایین است، در حال حاضر جایی در وسط راه است. اگر میخواهید درصدی از رشد را بدست آورید، خوب است، اما اگر میخواهید cardano را برای مدت طولانیتری نگه دارید، هنوز فکر میکنم قیمتهای بهتری آمد. گاهی نگاه کردن به نمودار معکوس برای بدست آوردن یک idea بهتر کمک می کند. اگر نمودار معکوس نبود، احتمالاً یک شکست strong را می دیدید و پس از عقب نشینی می به long.comment بروید: مراقب این منطقه باشید، میتواند آلتکوینها را پاک کند، میتواند دوباره 400b را آزمایش کند، اما منطقی نیست زیرا آزمایش از قبل 100 روز انجام شده است. نظر: ada عقب نشینی را انجام داد که انتظار داشتم، در حال حاضر مقاومت را می شکند و می خون پمپاژ کند. بدون توصیه تجاری، فقط یک مسیر ممکن را به پایین ترسیم کنید.comment:comment: ada احتمالاً پرچم خرس را آزمایش می کند. من در معامله به این موضوع اهمیتی نمی دهم، من پایین را می خرم یا اگر اشتباه می کنم، ترجیح می دهم بعد از آزمایش خط زرد خرید کنم، همه چیز زیر نزولی است و هر چیزی ممکن است در آنجا اتفاق بیفتد. در هر صورت، اگر به قمار علاقه دارید، می توانید آن را بخرید، شاید دوباره بالا بپرد، اما احتمالاً نمی دانید آن را کجا بفروشید، بنابراین دوباره سقوط کرد.
سلب مسئولیت
هر محتوا و مطالب مندرج در سایت و کانالهای رسمی ارتباطی سهمتو، جمعبندی نظرات و تحلیلهای شخصی و غیر تعهد آور بوده و هیچگونه توصیهای مبنی بر خرید، فروش، ورود و یا خروج از بازارهای مالی نمی باشد. همچنین کلیه اخبار و تحلیلهای مندرج در سایت و کانالها، صرفا بازنشر اطلاعات از منابع رسمی و غیر رسمی داخلی و خارجی است و بدیهی است استفاده کنندگان محتوای مذکور، مسئول پیگیری و حصول اطمینان از اصالت و درستی مطالب هستند. از این رو ضمن سلب مسئولیت اعلام میدارد مسئولیت هرنوع تصمیم گیری و اقدام و سود و زیان احتمالی در بازار سرمایه و ارز دیجیتال، با شخص معامله گر است.