
trade-God
@t_trade-God

تریدر چه نمادی را توصیه به خرید کرده؟
سابقه خرید
تخمین بازدهی ماه به ماه تریدر
پیام های تریدر
فیلتر
نوع پیام
trade-God
A Tolled Bell
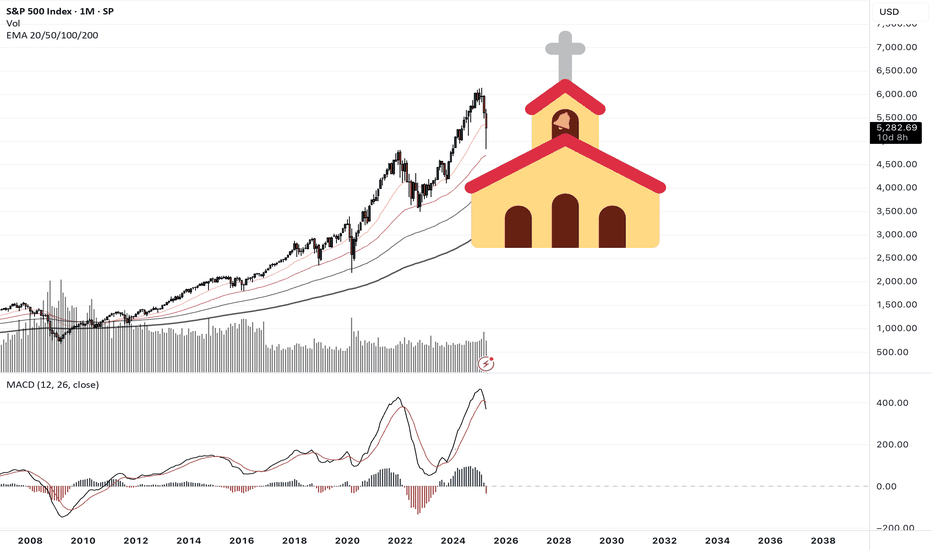
اولین زنگ دارای Rung است. یک پل در محدوده 6000 دلار آسفالت می شود. اگر منفجر شود ، احتمالاً تا زمان ساخت این پل اتفاق نمی افتد و احساسات بهبود نمی یابد. انتظار داشته باشید که چند تلاش صمیمانه از 6،660 دلار شلیک کنید. مورد پایه بازار خرچنگ بلند مدت است. این کار را در کنار 20 EMA اجرا کنید. دسته 6 فعلی خیلی دیرتر در آینده بود. من تا سال 2027 نگران آن بود.
trade-God
Chips and Dip
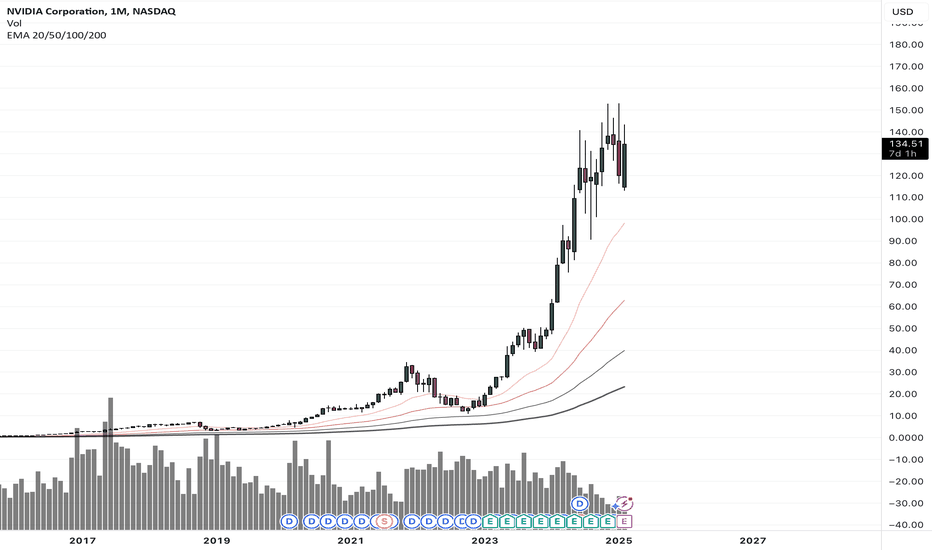
تمام شد ماهانه در هفته در مورد پول flow. پس از این اقدام قیمت در جایی است که بسیاری از دارندگان "انتخاب و بیل" را تصمیم گرفتند که باید همه وارد شوند. امیدوارم خیلی بد نباشد. 70 دلار برای من درست به نظر می رسد. دیر یا زود. رشد رشد درآمد چیز جدیدی نیست. سوال این است که ، آیا تا به حال به سطحی باز می گردد که باعث ایجاد فوم سرخوش می شود؟ یا مدتی پول مرده است؟ در هر صورت تا زمانی که رشد درآمد افزایش یابد ، فرصت خرید وجود ندارد.
trade-God
Goldaholics Anonymous

Pour yourself a glass of Goldschläger and let's review the 12 steps before diving into this. 1. We admitted that we were powerless over the Fed -- that our balance sheet had become unmanageable. 2. Came to believe that a Power greater than our central bank could restore us to solvency. 3. Made a decision to turn our fiat over to the care of sound money, as we understood it. 4. Made a searching and fearless inventory of our finances. 5. Admitted to Peter Schiff, Lyn Alden, and Pomp the exact nature of our wrongs. 6. Were entirely ready to have big, fat Gains. 7. Humbly asked to avoid getting short squeezed. 8. Made a list of all the naysayers about to be harmed. 9. Sent direct messages to them to gloat in victory. 10. Continued to count our gains and polish our bullion. 11. Sought through fundamental and technical analysis to improve our entries and exits. 12. Having had a financial awakening as the result of these steps, we tried to carry this message to other goldaholics, and practice these principles in all of our trades. Macro Fibonacci Below we can see the magic of Fibonacci extensions, measuring the last macro bull run to the 2016 low. Zooming in a bit, it is clear that these levels attract attention. Each one of these fibs acts as a step in the staircase. All we need to do is look at volume and price action to validate each level. The smart money had their sell orders at the 0.618 Fibonacci extension. The 0.5 could not hold which indicates that the next level down will be tested. Watch for heavy volume to come in there near the 0.382 level. In the U.S. stock market and many other developed financial markets, about 70-80 percent of overall trading volume is generated through algorithmic trading. Historical Price Action Looking back to the last bull run there are a few simple patterns to watch for... 1. Weekly MACD flailing around above the zero level. 2. Mark the down trends and wait for the break. 3. Price action is above the 20 Week EMA. Trading Setup Using historical price action the trading setup becomes clear... 1. Weekly MACD is flailing above the zero level. 2. The down trend line is clear. Wait for the break. 3. Wait for 20 Week EMA support. Now, the targets are the Fibonacci levels above, and the ghost bars look reasonable, however, it would be wise to take a look at what exactly is driving Gold on this path. The U.S. Dollar The Dollar index inversely pressures Gold prices so this is worth noting. 1. Momentum is shifting bullish as a bullish MACD divergence reveals itself on the daily chart. 2. This recent move was the 3rd wave down which often precedes a reversal. 3. The index is at the bottom of this future channel. As this index recovers back towards the 200 Week EMA, it will surely scare the metals market. However, the macro downtrend is only on it's first wave down. From a technical standpoint, the second wave is often the deepest as panic sets in from the failed recovery. Treasury Yields Yields recently had a similar bullish MACD divergence with a very weak recovery that followed. The trend is still clear and it's highly likely to roll over as it timidly approaches the trendline in the coming months. Gold has been riding along side Bonds so this should continue to drive up prices. Depending on the severity of falling yields, it could trigger temporary crashes in the metals. But longer term, buying the dips is the way to go. Trading is risky. Don't do it. Long Bullion: Gold, Silver, Platinum Equities: GDX, PHYS, CEF, SLV, RIO, SPPP Futures: (Not yet)Comment: 1. The daily MACD has crossed above zero... 2. The price action is supported, for now, above the fib level... 3. Sort of broke the down trend... If there is a break higher it could be time to buy... BUT the DXY is still poised for a rally so caution is important. Stay tuned.Trade active: I like buying dips in Gold futures now that price has stabilized above resistance with the daily MACD above zero... I'll be using the 4hr chart, the 50 EMA, and the RSI set at 10. RSI is now near the bottom of the range and price is supported by the 50 EMA +1 @ 1921Comment: Gold price is right at the 200 day EMA so could be a bounce here. The problem is DXY looks like it could make that reversal so I'll set a stop loss on Gold below that 200 day EMA. In that case I would take a short term loss and just wait to get in at a better price.Comment: I'm going to play this by holding through this sell off and buying more if there's a bounce at the next fib level. But to hedge my losses, I'll look to short oil if this DXY rally continues to demolish the markets.Comment: Still coasting above the main trendline. I think downside is limited but will remain cautious about adding here to a leveraged futures position. However, I am still accumulating a core position in gold/silver/metal equities like PHYS, CEF, SLV, RIO.Comment: Once it gets back above that fib level (again) I'd expect a short squeeze.Trade active: Frankly, gold has been such a pain in the ass. I'm slightly net red from last years big win and this years big loss. Long @ 1734 on the August contract. Trusting the fib gods on this one.Comment: Fib bounce, good. Above the 50 EMA, good. 1,800 almost hit, almost good. Probably will be a messy journey but the 0.5 fib is where I'd consider selling this long.Comment: Taking a step back on the weekly view, the MACD is showing momentum is much stronger now than in the last few attempts to break trend. The downside risk is there but the upside looks much bigger but could take a while if there's a pullback from here. Another reason why I grabbed the December(z) contract on this one.Comment: Gold prices are now approaching the target 0.5 fib extension. I'm up about $1,400 on this position but took a big fat L on the last dips. As of now I've broken even on Gold futures YTD. This setup looks to be the beginning of a larger move so I'm just going to hold it through in case of a squeeze up to $2000 happens sooner rather than later.Comment: Momentum hasn't even kicked in yet.Comment: Gold is forming a very similar pattern as the previous top in, price and the MACD. If history does repeat, the place to cut positions is where the MACD dips below 0 and price breaks the trendline.Comment: next resistances and then longer term top.
trade-God
Bitconacci

برخی از بینش ها از بین رفته اند ، نه همه. با این وجود ، مسیر قرمز در بالا و پایین مرده بود. شیدایی بی پروا که توسط یک ویکوف صدرنشین شده است. وزن ماهانه MACD Momentum Spike اتفاق افتاد که قیمت آن را به پایان برساند ، که با توجه به قیمت زیر 12 EMA تأیید شده است. این سیگنال ها بودند. این سیگنال ها اکنون معکوس شده اند. حرکت آماده است .12 EMA Fliped. انتظار می رود قیمت های پایین تر و قیمت های بالاتر؟ چه در مورد یک لاله گسترده که به یک صعود غیر منتظره گسترده تبدیل می شود. دلایلی برای این تحلیل وجود دارد ، هنوز یک مفهوم جدید در رادار هیچ کس نیست. اول ، به نظر می رسد که MACD هفتگی به یک تنفس کوتاه نیاز دارد. با این حال ، جالب تر اینکه ، دنباله زمانی فیبوناچی است که به رنگ آبی مشخص شده است. چرخه هایی که از سال 2009 در سال 2009 قرار دارند ، btc پیدایش. بیشتر یا کمتر مسطح برای مدتی در کار با خرچنگ پیاده روی به سمت کوچک به سمت شیب دار ، نمای عقب با ویلیامز Vix در ترانسیته جمع آوری لینچپین ، 66K پایه ای برای بیش از حد به سمت 2m است. بشر حل و فصل حدود 660k.Channel مکث 90k پوند برای کمی ، احتمالاً. PERCHANCE در هفته های آینده برای خریدهای DIP آماده شوید. شیب کانال اکنون به سمت بالا تنظیم شده است. A hard تصادف و بیرون ممکن است در حال رشد باشد. در غیر این صورت روند کانال ادامه دارد.
trade-God
The House

bitcoin یک بازی نمادین در برابر خانه در یک بازی بلک جک است، از این رو محدودیت 21 میلیونی است. بازیکن به زودی متوجه می شود که با وجود اشتیاقش، احتمالات در برابر او انباشته شده است با نگاه کردن به پشته، به غیر از چرخش اندیکاتورهای حرکت، چیزهایی را می بینید آ. بازار برای ایجاد چشم های لیزری چقدر باید سرخوش باشد؟ 2. یا یک رئیس جمهور کشوری که همه جا می رود و طوری جشن می گیرد که انگار پیروز شده است 3. توجه رسانه ها با تبلیغات در هر گوشه از وب به شدت افزایش می یابد 4. احساس "من قرار است ثروتمند شوم" ک. doge حتی اگر این پایان نباشد، یک یادداشت در مورد رمزارز به طور کلی. واضح است که همه اینها تمرکززدایی است که از تمرکززدایی سود می برد. آیا اکثریت واقعاً پلتفرم هایی را می که در آن people کاملاً بدون سانسور و مسئول باشند. یا منطقی تر است که خانه چیزهای مفید را جذب کند و بقیه را برای مرده رها کند به عنوان یک فکر نهایی و شاید مهمترین. به خاطر داشته باشید که کل حماسه bitcoin که در سال 2009 آغاز شد، در میان حباب های دارایی تقریباً در هر گوشه از نظرات بازار: تا در این مورد کمی بیشتر بسط دهیم. من هنوز مقداری bitcoin دارم و فناوری آن قوی است، بنابراین بعید است bitcoin بمیرد. سوال بیشتر در مورد این است که ما در چرخه بازار کجا هستیم و دقیقاً دلیل اینکه قیمت در کجا قرار دارد چیست. پتانسیل صعودی بیشتر از ریسک است. فنی از نظر فنی در یک موج پنجم صعودی قرار دارد. در ابتدا تجزیه و تحلیل فیب من در پست های قبلی به 123 هزار دلار اشاره داشت که هنوز هم ممکن است اتفاق بیفتد زیرا هنوز روند را شکسته نکرده است. اما این پتانسیل صعودی با توجه به سود 11 هزار دلاری در زمان شروع این چرخه واقعاً چندان زیاد نیست. سطح فیب زیر برای خرید جذاب تر بود. روانشناسی در مقالات قبلی در مورد احساسات و مراحل چرخه بازار نوشتم. اگر رسانههای اجتماعی را دنبال کنید، دقیقاً میتوانید احساس کنید که people کجاست. احساس شکست ناپذیری وجود دارد که 1 btc = 1 btc بنابراین قیمت مهم نیست. کاملاً مزخرف است زیرا همه اینها به چیزی است که می توانید بخرید و 1 از هر چیزی = 1 از هر چیزی 1. مرحله پنهان کاری: انباشته شدن ناشناخته ها 2. مرحله آگاهی: سرمایه گذاران نهادی شروع به دیدن پتانسیل می کنند 3. مرحله شیدایی: تزریق رسانه برای تبلیغ آن. 4. دامپ: گرفتن سود استراتژی ها زمانی که فردی با منابع فرصت را پیدا می کند، تلاش می شود تا آن را به حداکثر برسانند. tether متولد شده است و چه کسی می داند که چه طرح های دیگری برای سرمایه گذاری بر روی این دارایی جدید در پی super نرخ های بهره پایین و در کنار عدم وجود مقررات است. جریان ورودی قیمت را افزایش می دهد. پول هیاهو را تعقیب می کند. یکی از اعضای کنگره چشم های لیزری را به آواتار خود اضافه می کند. شرکت ها و کشورها yolo in.comment: bitcoin هرگز از 12 ماهه ایما رد نشده است بدون اینکه از آن ایما در حدود 50 - 68٪ بیفتد. که هدف ریسک نزولی را حدود 21k قرار می دهد.comment:comment:
سلب مسئولیت
هر محتوا و مطالب مندرج در سایت و کانالهای رسمی ارتباطی سهمتو، جمعبندی نظرات و تحلیلهای شخصی و غیر تعهد آور بوده و هیچگونه توصیهای مبنی بر خرید، فروش، ورود و یا خروج از بازارهای مالی نمی باشد. همچنین کلیه اخبار و تحلیلهای مندرج در سایت و کانالها، صرفا بازنشر اطلاعات از منابع رسمی و غیر رسمی داخلی و خارجی است و بدیهی است استفاده کنندگان محتوای مذکور، مسئول پیگیری و حصول اطمینان از اصالت و درستی مطالب هستند. از این رو ضمن سلب مسئولیت اعلام میدارد مسئولیت هرنوع تصمیم گیری و اقدام و سود و زیان احتمالی در بازار سرمایه و ارز دیجیتال، با شخص معامله گر است.