
omvats1
@t_omvats1

تریدر چه نمادی را توصیه به خرید کرده؟
سابقه خرید
تخمین بازدهی ماه به ماه تریدر
پیام های تریدر
فیلتر
نوع پیام
my 2023 analysis and future bitcoin possibilities

سلام!، برخی از تحلیل های سال 2023 خود را برای پیش بینی 2026 دوباره ارائه می کنم bitcoin ممکن move در ابتدا من تجزیه و تحلیل ارسال شده در آوریل 2023 را نشان می دهم که سطوح bitcoin را برای سال 2026 حتی تا 2029 نشان می دهد، این اولین تحلیل من بر اساس 36 شمعM بود، بنابراین در سال 2026 نیاز به اعتبارسنجی دارد، اما با توجه به نتایج عالی تا به حال، در کمال تعجب من، قادر به ارائه سطوح پایانی 223، 52020 و poib2020 می باشد. همچنین سطح 177800 را برای سال 2026/2029 می دهد، بنابراین باید اعتبار سنجی انجام شود، علاوه بر این، من برخی از الگوهای ارسال شده توسط من در form ایده ها در همان زمان در سال 2023 و شگفت انگیز bitcoin move بین آن الگوها را به اشتراک می گذارم، که سؤالی را به خصوص در مورد اخبار، حجم ها یا الگوهای استفاده شده توسط بسیاری از نظریه های من مطرح می کند. اما قیمت آن را برای سالها دنبال می کند در اسلایدهای زیر آن تجزیه و تحلیل و تأثیر آن تجزیه و تحلیل را به همراه سطوح مهم 2026 پست کرد. قبل از این، بیت کوین مقدار داخلی ماهانه bar را شکست و این ماه به زیر محدوده BO داخلی bar باز شد، بنابراین واضح است که با مقاومت روبرو شد، اما اگر نتواند پایین ترین سطح ماه قبل را بشکند، مطمئناً form داخل bar جدید در بازه زمانی ماهانه بود، بنابراین یک محدوده ممکن برای ماه های آینده الگوهایی که پشتیبان tls را نشان میدهند، bitcoin سعی میکند hard بالاتر از آن بماند، باز شدن ماه آینده در زیر tls مطمئناً تأثیر منفی بر بیتکوین میگذارد، در غیر این صورت به آن فرصتی برای مبارزه میدهد، برای من اینها نقطه تلاقی هستند. 2023 سطوح مهم پیشرو برای سال 2026
gold and three angles

طلا از زمان آغاز این نمودار، از سه زاویه برجسته پیروی میکند. در تصاویر بعدی، برای نشان دادن تصویر واقعی، بزرگنمایی و کوچکنمایی کرد. همچنین، سطوح مهمی را برای راهنمایی، منتشر کرد. بزرگنمایی
Hopeful bears and bulls, and a two channels

bitcoin از اواسط 2022 الگوی بالایی بالاتر پیروی می کند ، و به طرفین شادی و درد هم می دهد ، اکنون پشتیبانی را در TL پایین تر انجام داده است ، و آزمایش میانی الگوی پایین پایین و دادن سطح ممکن برای سال ممکن است ، در صورتی که هرگز TL زیر را شکست ندهید ، همچنین سطح پایین نیز در حال ارسال سطوح مهم در زیر گرافیک زیر به صورت ماهانه است
gold is riding a perfect parabolic movement, but

سلام ، در انتشار ماه نوامبر ، من در مورد محدوده طلا در 12 متر TF صحبت کردم ، که منجر به سقوط طلا شد ، طلا پشتیبانی زیر را دریافت کرد ، اکنون یک TL را در بالا آزمایش می کنم ، من link انتشار زیر را به اشتراک می گذارم طلا در حال آزمایش 12 متر در داخل bar بالا ، در ابتدای سال است ، اگر با آن ادامه دهید ، ما در آینده نزدیک سطح مثبت خوبی داریم ، اما مطمئناً در اینجا شایسته احتیاط هستیم ، قاب های زمانی کوچکتر اکنون راهنمایی می کنند در 1 متر ، طلا از شکستن داخل bar اما تحت مقاومت در اواسط منطقه بو ، دوباره یک نقطه احتیاط است در 4 ساعت ، طلا به دنبال حرکت پارابولیک کتاب کپی کامل است و پس از پشتیبانی و مقاومت از TLS خمیده فوق ، حرکت شدید انجام می دهد ، اکنون با زاویه ای تندتر سطح مهم 12m ، 1m و 1W در حال حاضر داده شده است طلا در یک منطقه احتیاط با حرکت فرار ، هنوز هم زیر TL پایین در 4 ساعت است ، بنابراین با خیال راحت تجارت کنید پس از تسویه حساب می توانیم تجارت جهت خوبی کسب کنیم من به موقع برخی از الگوهای TF کوچکتر را اضافه می کنم که به ما کمک می کند تا از طریق این منطقه احتیاط حرکت کنیم امیدوارم که شما از انتشار و تجارت خوشتان بیاید safe با تشکر از ایده های 1hin 4h ، طلا در تلاش است تا form یک الگوی ادغام جدید ، در صورتی که قیمت پس از حرکت پارابولیک در HH در 15 دقیقه در HH در ادغام HH در روز HH در روز HH متوقف شود ، در روز HH PORTHREGRESSMADE NEW RESTRESSINCE TLSTOOK PARALLED PALLORDAL در برابر سطح گذشته از زمان گذشته از بیرون آمدن کنسولید
Bitcoin , continuation of the pump and dump, but

سلام ، Bitcoin کاملاً پیروی از پمپ قبلی و ایده زباله در اوایل مقاومت در برابر اما پشتیبانی در TLS زیر قرار گرفت اکنون bitcoin پس از لذت بردن از شکستن قوی ، در حالت ادغام قرار دارد ، اما به دنبال یک تلفیق خمیده اکنون در مرحله پایین پایین ، مقاومت در بالا و پشتیبانی از زیر اکنون ، در پایین یک روز در bar همچنین Doji Low در روز TF ، در یک روز دیگر IB و IB هفتگی نزدیک به HH TL پایین ، می تواند سعی در پشتیبانی از آن داشته باشد ، همچنین سطح مهم 12 متر/1 متر را برای مرجع ترسیم کرد امیدوارم که این نشر را مرتبط و جالب پیدا کنید ، و به پیشرفت پمپ قبلی و ایده زباله در زیر می پردازید Thankszoom Inprogress از پمپ و ایده زباله قبلی ارسال شده در ماه دسامبر 2024in 1hbo از الگوی مثلث زودتر ، اکنون به دنبال یک الگوی LL که از پشتیبانی در زیر در زیر پشتیبانی می کند ، همچنین در تلاش برای پشتیبانی از مناطق HH ماهانه زیر ، یک ترکیب TLS MONURING کوچک ، زیر 2 tlsprogressin 1hprogressprogresstook است.
DOGECOIN multi timeframe analysis

h! ، سعی در ارائه تجزیه و تحلیل فریم چند زمانی DOGE ، لطفاً از طریق گرافیک های زیر بروید Doge از منطقه کانال / ادغام بالاتر (HH) بالاتر در بازه زمانی روز نیز حرکت می کند و در محدوده 12 متر در داخل bar حرکت می کند ، مقاومت از یکی از نسبت های داخلی bar ، همچنین در اینجا سطح 12 متر را در اینجا ارائه می دهد ، سطح ماهانه و هفتگی را در گرافیک های جداگانه قرار می دهد. امیدوارم ایده را دوست داشته باشید Thanksweekly در داخل BarsProgressDoge در زیر پشتیبانی از زیر قرار گرفت و در حال حاضر یک مقاومت در حال حرکت در کانال است که اکنون سعی در پشتیبانی در TL زیر دارد و پس از شکستن LL TLSO کانال پایین ، اکنون در زیر Tlprogress زیر پشتیبانی می کند ، پس از حمایت از TL زیر در TestProgressProgressProgress از doge ایده می گیرد که آیا نمی توان از طریق تست استفاده کرد و از این طریق می توان از آنجا استفاده کرد و از آنجا استفاده نمی کند.
GOLD take the resistance from the monthly inside bar high

طلا مقاومت را از ماهانه در داخل bar بالا و همچنین سطح مهمی برای سال 2026 ، 15 دقیقه در سطح bar شکست ، و با پیوند دادن به پشتیبانی در TL پایین در 15 دقیقه TF ، اما MAS هنوز هم منفی است و تلاش می کند برای نزدیکی منفی در 15 دقیقه TF ، بنابراین مکانی برای احتیاط و هفتگی کانال IB'Sgold مقاومت در یک سطح مهم برای 2026PROGRASS
Apple , multi timeframe pattern analysis
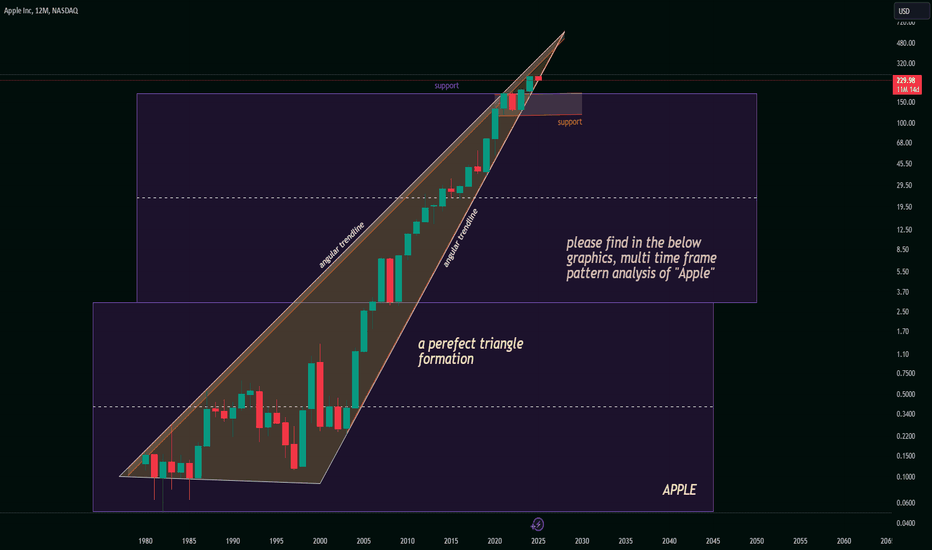
سلام ، تلاش برای ارائه با تجزیه و تحلیل بازه زمانی اپل ، الگوهای مهم برای اپل را نشان می دهد ، لطفاً تمام گرافیک ها را طی کنید ، همچنین سعی کنید سطح 12 متر مهم را برای اپل به همراه سطح ماهانه و هفتگی در زیر گرافیک پردازش پردازش پردازش ارائه دهید.
GOLD multi time frame analysis

طلا در سطح مهمی 2025 است ، سعی کرد در اینجا گرافیکی از الگوهای چند بازه زمانی طلا را ارائه دهد و همچنین سعی کرد سطح طلای مهم زیر 15 دقیقه TF را ارائه دهد همچنین به برخی از موارد مهم دیگر کانال اجازه می دهد تا CProgressGold دوباره در TL پایین پشتیبانی کند و از قسمت فوقانی در اواسط کانال بسته شده در سطح روز به دنبال HH مقاومت کند ، اما یک TL Usoeagain مقاومت در برابر سطح ، هنوز هم بالاتر از سطح LVLPRICE از سطح پایین تر از سطح ، در زیر سطح 5 دقیقه از سطح THF استفاده می کند. EarlyProgressProgressProgress2771.6 ماهانه در داخل bar progressprogresstesting tlprogress پایین اکنون در مقاومت در برابر PROGRESSA LEVLPROGRESSPROGRESCESS PROGRESSPROGRESCESS پشتیبانی می کند. هنوز تحت مقاومت TLProgressProgressGot فوق از آزمایش پیشرفته TLGOLD در حال آزمایش مقاومت Zoneanother ProdprogressBroke در سطح هفتگی و روز ، به طور کامل از الگوی HH پیروی کرده ، مقاومت را از روند ، در نزدیکی اواسط ماهانه در محدوده bar BO ، به شما امکان پذیر است. در زیر یک مقاومت LVLGOT هفتگی دیگر از اواسط ماهانه در داخل bar منطقه BO که بالاتر از روز مقاومت در برابر سطح روز از یک روز بسته شده است و پشتیبانی از سطح روز پایین تر از زاویه رشد پیروی می کند در حالی که آزمایش مقاومت فوقانی در زیر مقاومت در زیر مقاومت از سطح نشان داده شده در نمودار 15 دقیقه در بالا از TL در 4H را آزمایش می کند.
progress of my October '2023 bitcoin analysis, a chart art

سلام ، نشان دادن این امر ، پیشرفت تجزیه و تحلیل bitcoin من در اواسط اکتبر 2023 ، در اینجا ، من نشان می دهم که چگونه الگوهای بر قیمت تأثیر می گذارد ، همچنین ، چگونه می توان از نسبت کانال به طور مؤثر استفاده کرد ارسال ایده اصلی در ایده گرافیکی بعدی
سلب مسئولیت
هر محتوا و مطالب مندرج در سایت و کانالهای رسمی ارتباطی سهمتو، جمعبندی نظرات و تحلیلهای شخصی و غیر تعهد آور بوده و هیچگونه توصیهای مبنی بر خرید، فروش، ورود و یا خروج از بازارهای مالی نمی باشد. همچنین کلیه اخبار و تحلیلهای مندرج در سایت و کانالها، صرفا بازنشر اطلاعات از منابع رسمی و غیر رسمی داخلی و خارجی است و بدیهی است استفاده کنندگان محتوای مذکور، مسئول پیگیری و حصول اطمینان از اصالت و درستی مطالب هستند. از این رو ضمن سلب مسئولیت اعلام میدارد مسئولیت هرنوع تصمیم گیری و اقدام و سود و زیان احتمالی در بازار سرمایه و ارز دیجیتال، با شخص معامله گر است.