
niclaxfx
@t_niclaxfx

تریدر چه نمادی را توصیه به خرید کرده؟
سابقه خرید
تخمین بازدهی ماه به ماه تریدر
پیام های تریدر
فیلتر
نوع پیام
niclaxfx
بیت کوین به ۲۵۰ هزار دلار میرسد؟ مسیر بازیابی و پیشبینی هفتههای آینده
سلام دوستان، در این ویدئو، نظراتم را در مورد وضعیت فعلی بازار بیتکوین (BTCUSD)، اینکه چرا معتقدم بازار صعودی (گاوی) هنوز به پایان نرسیده، و همچنین چه انتظاراتی میتوانیم برای هفتههای آینده داشته باشیم، به اشتراک گذاشتم. اگر این محتوا برای شما مفید است، لطفا لایک کنید، به اشتراک بگذارید، دنبال کنید و از همه مهمتر، اگر با دیدگاه من موافق یا مخالف هستید، حتماً نظرات خود را در کامنتها بنویسید. بیایید به همدیگر کمک کنیم. موفق باشید. 💚
niclaxfx
بیت کوین در آستانه جهش بزرگ: راز الگوی "کف دوقلو" فاش شد!
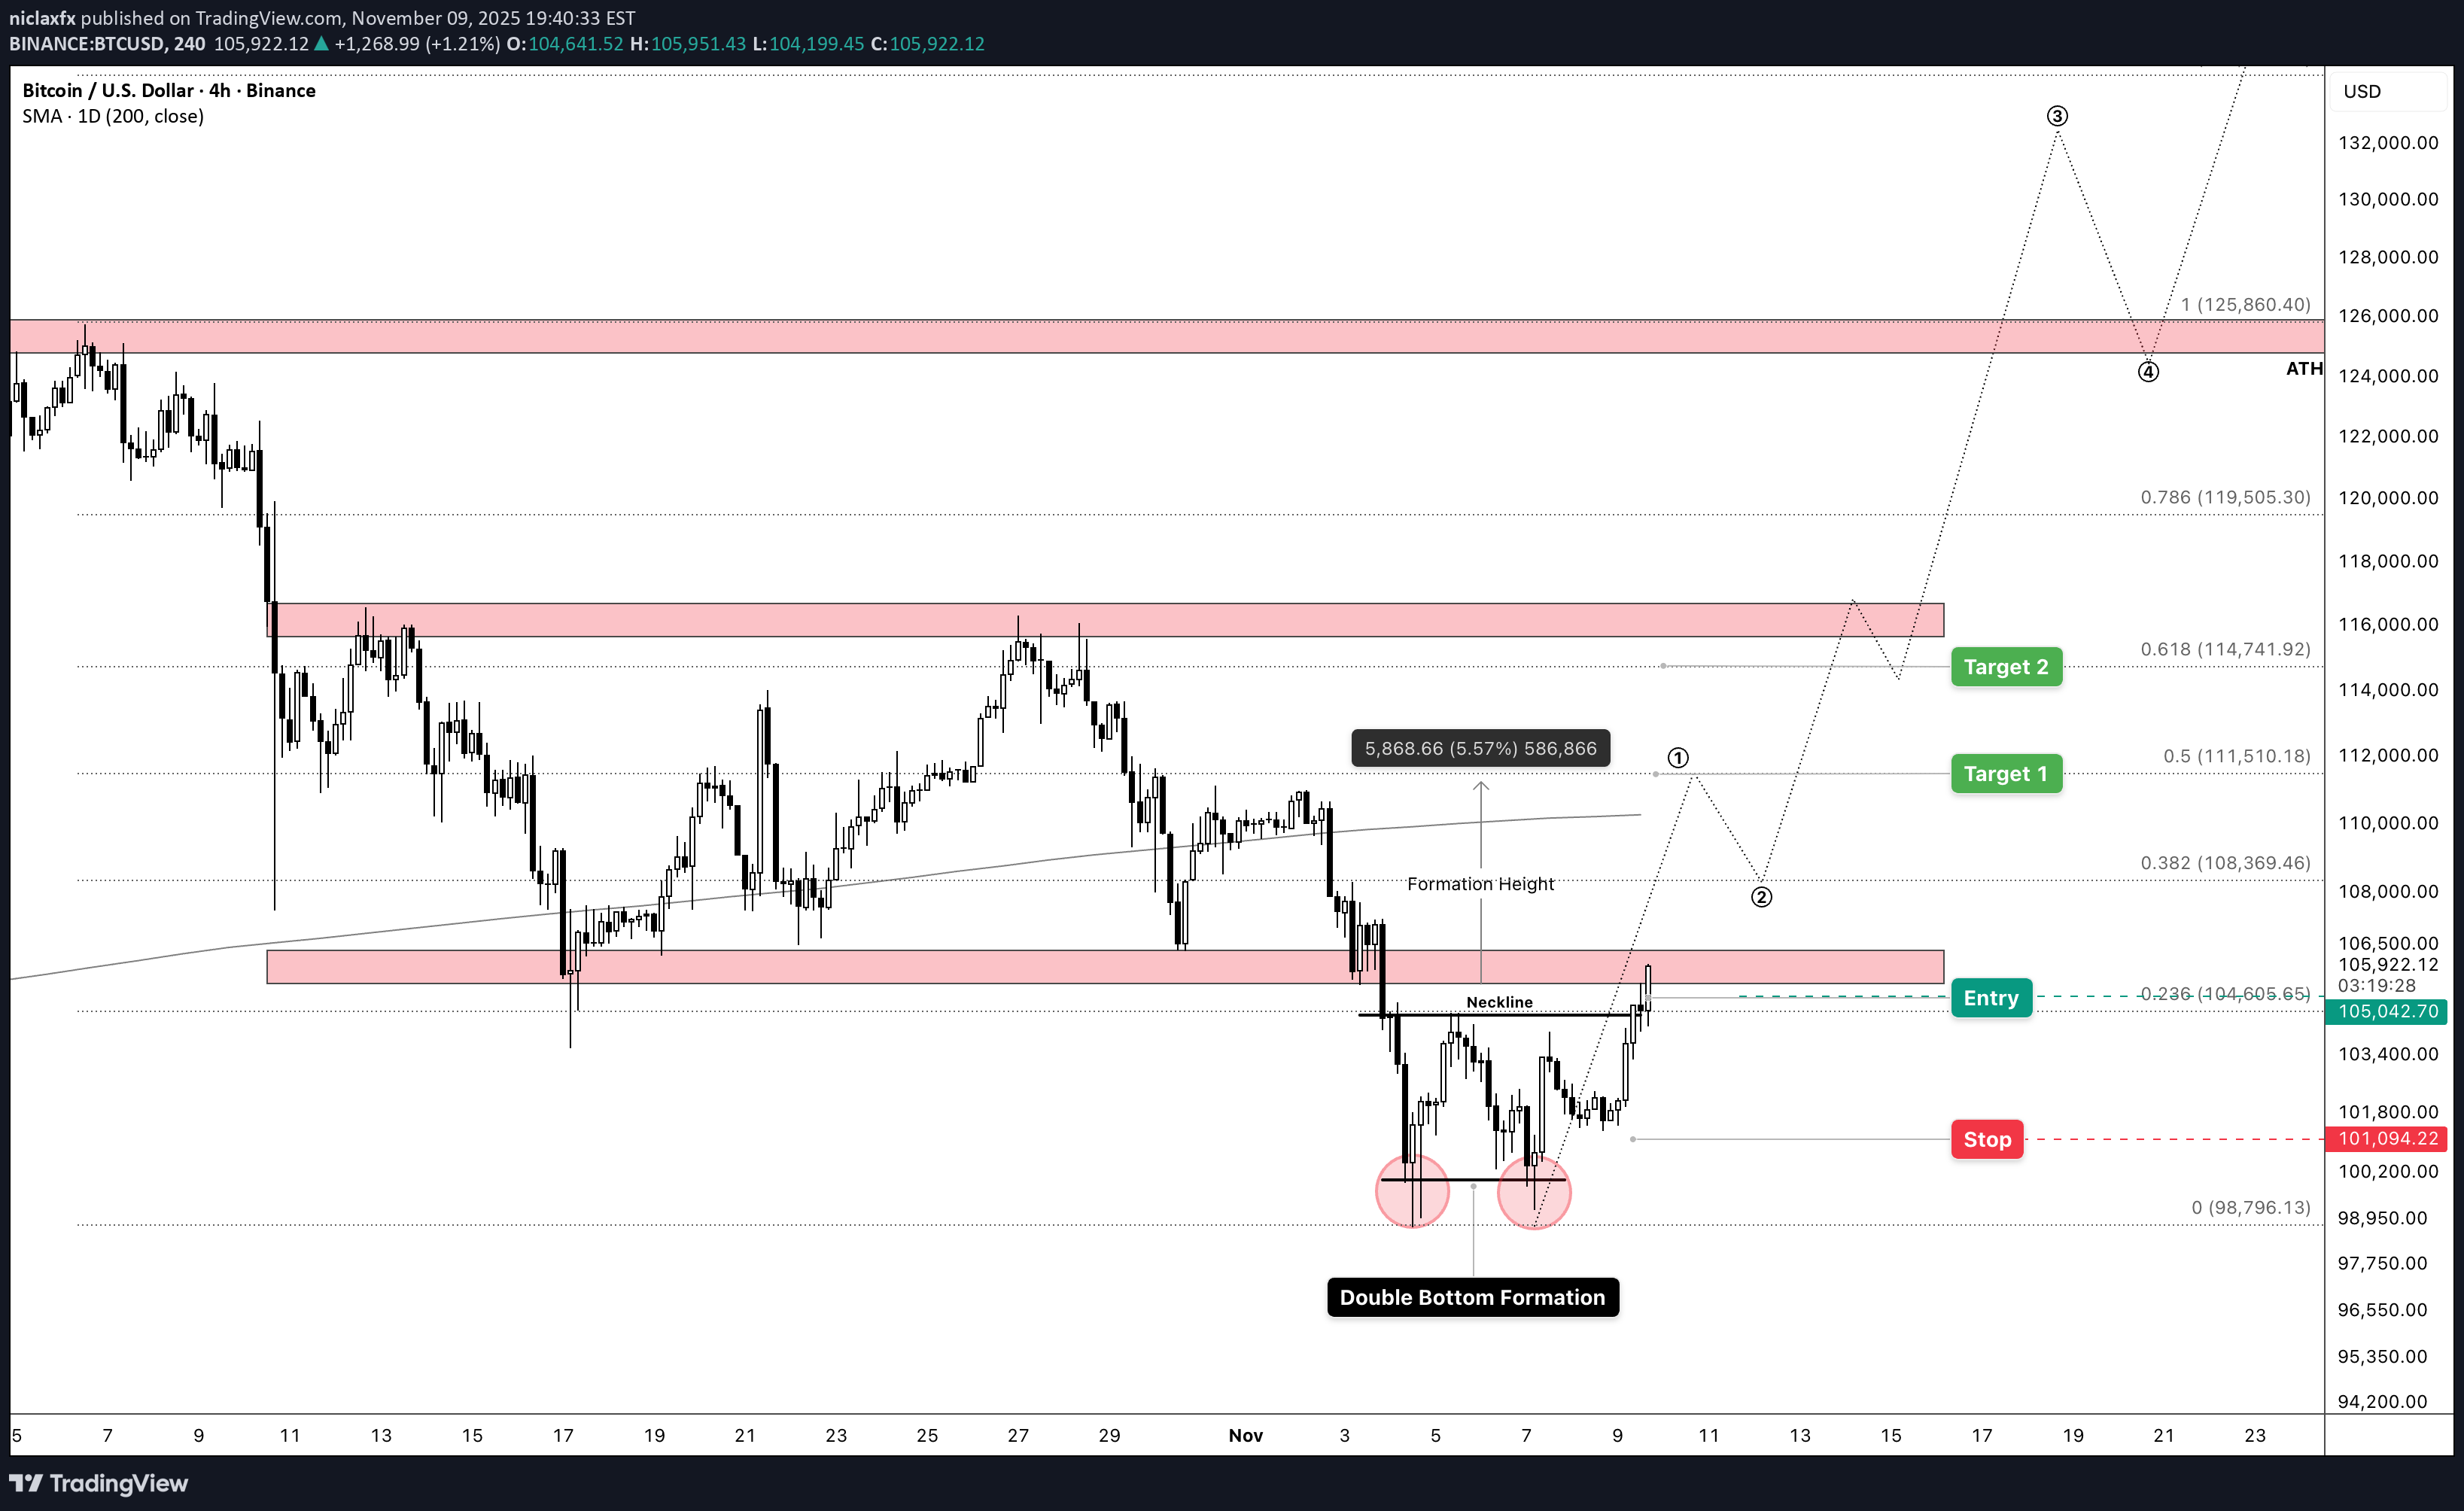
پس از هفتهها تثبیت (Consolidation) و افت شدیدی که بازیگران ضعیف را حذف کرد (shook out weak hands)، به نظر میرسد BITCOIN در حال آمادهسازی برای فاز صعودی بعدی [major] خود است. نمودار ۴ ساعته یک الگوی کف دوقلوی کلاسیک (textbook double bottom) را نشان میدهد؛ الگویی که اغلب پایان یک اصلاح و آغاز یک روند صعودی جدید را نوید میدهد. **تنظیمات تحلیل (The Setup)** پس از رد شدن بیتکوین از ناحیه ۱۲۶ هزار دلاری در اوایل نوامبر، شاهد یک اصلاح اندازهگیری شده بودیم که در نزدیکی سطح حمایتی ۹۸ هزار تا ۱۰۰ هزار دلار حمایت پیدا کرد. این ناحیه حمایتی حیاتی اکنون دو بار تست شده و دو کف متمایز را تشکیل داده که اساس الگوی کف دوقلوی ما را میسازند. خط گردن (Neckline)، که در حدود ۱۰۴.۶ هزار دلار قرار دارد، با قاطعیت شکسته شده است، که نشان میدهد خریداران کنترل بازار را دوباره به دست آوردهاند. آنچه این تنظیمات را به ویژه جذاب میکند، هدف اندازهگیری شده [move] است. با اعمال ارتفاع الگو از سطح شکست (breakout level)، به اولین هدف در حدود ۱۱۱.۵ هزار دلار میرسیم – که به طور مطلوبی با سطح اصلاحی فیبوناچی ۰.۶۱۸ همراستا است. این همگرایی (Confluence) وزن بیشتری به فرضیه صعودی میبخشد. نسبت ریسک به پاداش در اینجا جذاب است. با قرار دادن حد ضرر (Stop loss) درست زیر کف نوسانی اخیر در ۱۰۱ هزار دلار، نسبت پاداش به ریسک تقریباً ۳ به ۱ است. **مسیر پیش رو (The Path Forward)** اگر [BITCOIN] بتواند حمایت بالای خط گردن و روند قیمتی کنونی را حفظ کند، به نظر میرسد مسیر کمترین مقاومت رو به بالا باشد. برآورد اندازهگیری شده [move] نشان میدهد که میتوانیم در جلسات آتی، شاهد پیشروی ساختاریافته از طریق ناحیه ۱۰۸ هزار تا ۱۱۱ هزار دلار باشیم. فراتر از هدف فوری، نمودار به سطوح بلندپروازانهتری اشاره دارد، به طوری که در صورت ادامه شتاب (Momentum)، ناحیه سقف تاریخی (ATH) در ۱۲۶ هزار دلار مجدداً مورد توجه قرار میگیرد. البته، [BITCOIN] در خطوط مستقیم [move] حرکت نمیکند. انتظار فازهای تثبیت و تستهای مجدد احتمالی خط گردن به عنوان حمایت را داشته باشید. نکته کلیدی این است که آیا خریداران در هر عقبنشینی (Pullback) به دفاع از ناحیه ۱۰۴ هزار تا ۱۰۵ هزار دلار ادامه داد یا خیر. **📝 خلاصه (TL;DR)** [Bitcoin] پس از دو بار تست حمایت ۹۸ هزار تا ۱۰۰ هزار دلاری، یک الگوی کف دوقلو تشکیل داده است. شکست خط گردن در ۱۰۴.۶ هزار دلار، هدف ۱۱۱.۵ هزار دلار را نشانه گرفته و یک تنظیم ریسک به پاداش جذاب را ارائه میدهد. ابطال ساختار زیر ۱۰۱ هزار دلار رخ میدهد. **--- ابطال (Invalidation): ---** شکست پایدار و بسته شدن ۴ ساعته زیر ۱۰۱ هزار دلار ساختار صعودی را باطل میکند و نشان میدهد که اصلاح ممکن است به سمت پایینتر و تا ناحیه حمایتی ۹۸ هزار دلار گسترش یابد. *توجه: این تحلیل صرفاً جنبه آموزشی دارد. همیشه تحقیقات خود را انجام دهید و ریسک را به درستی مدیریت کنید.*
niclaxfx
نبرد روانی طلا و بیت کوین: کدام دارایی واقعاً به اوج رسید؟
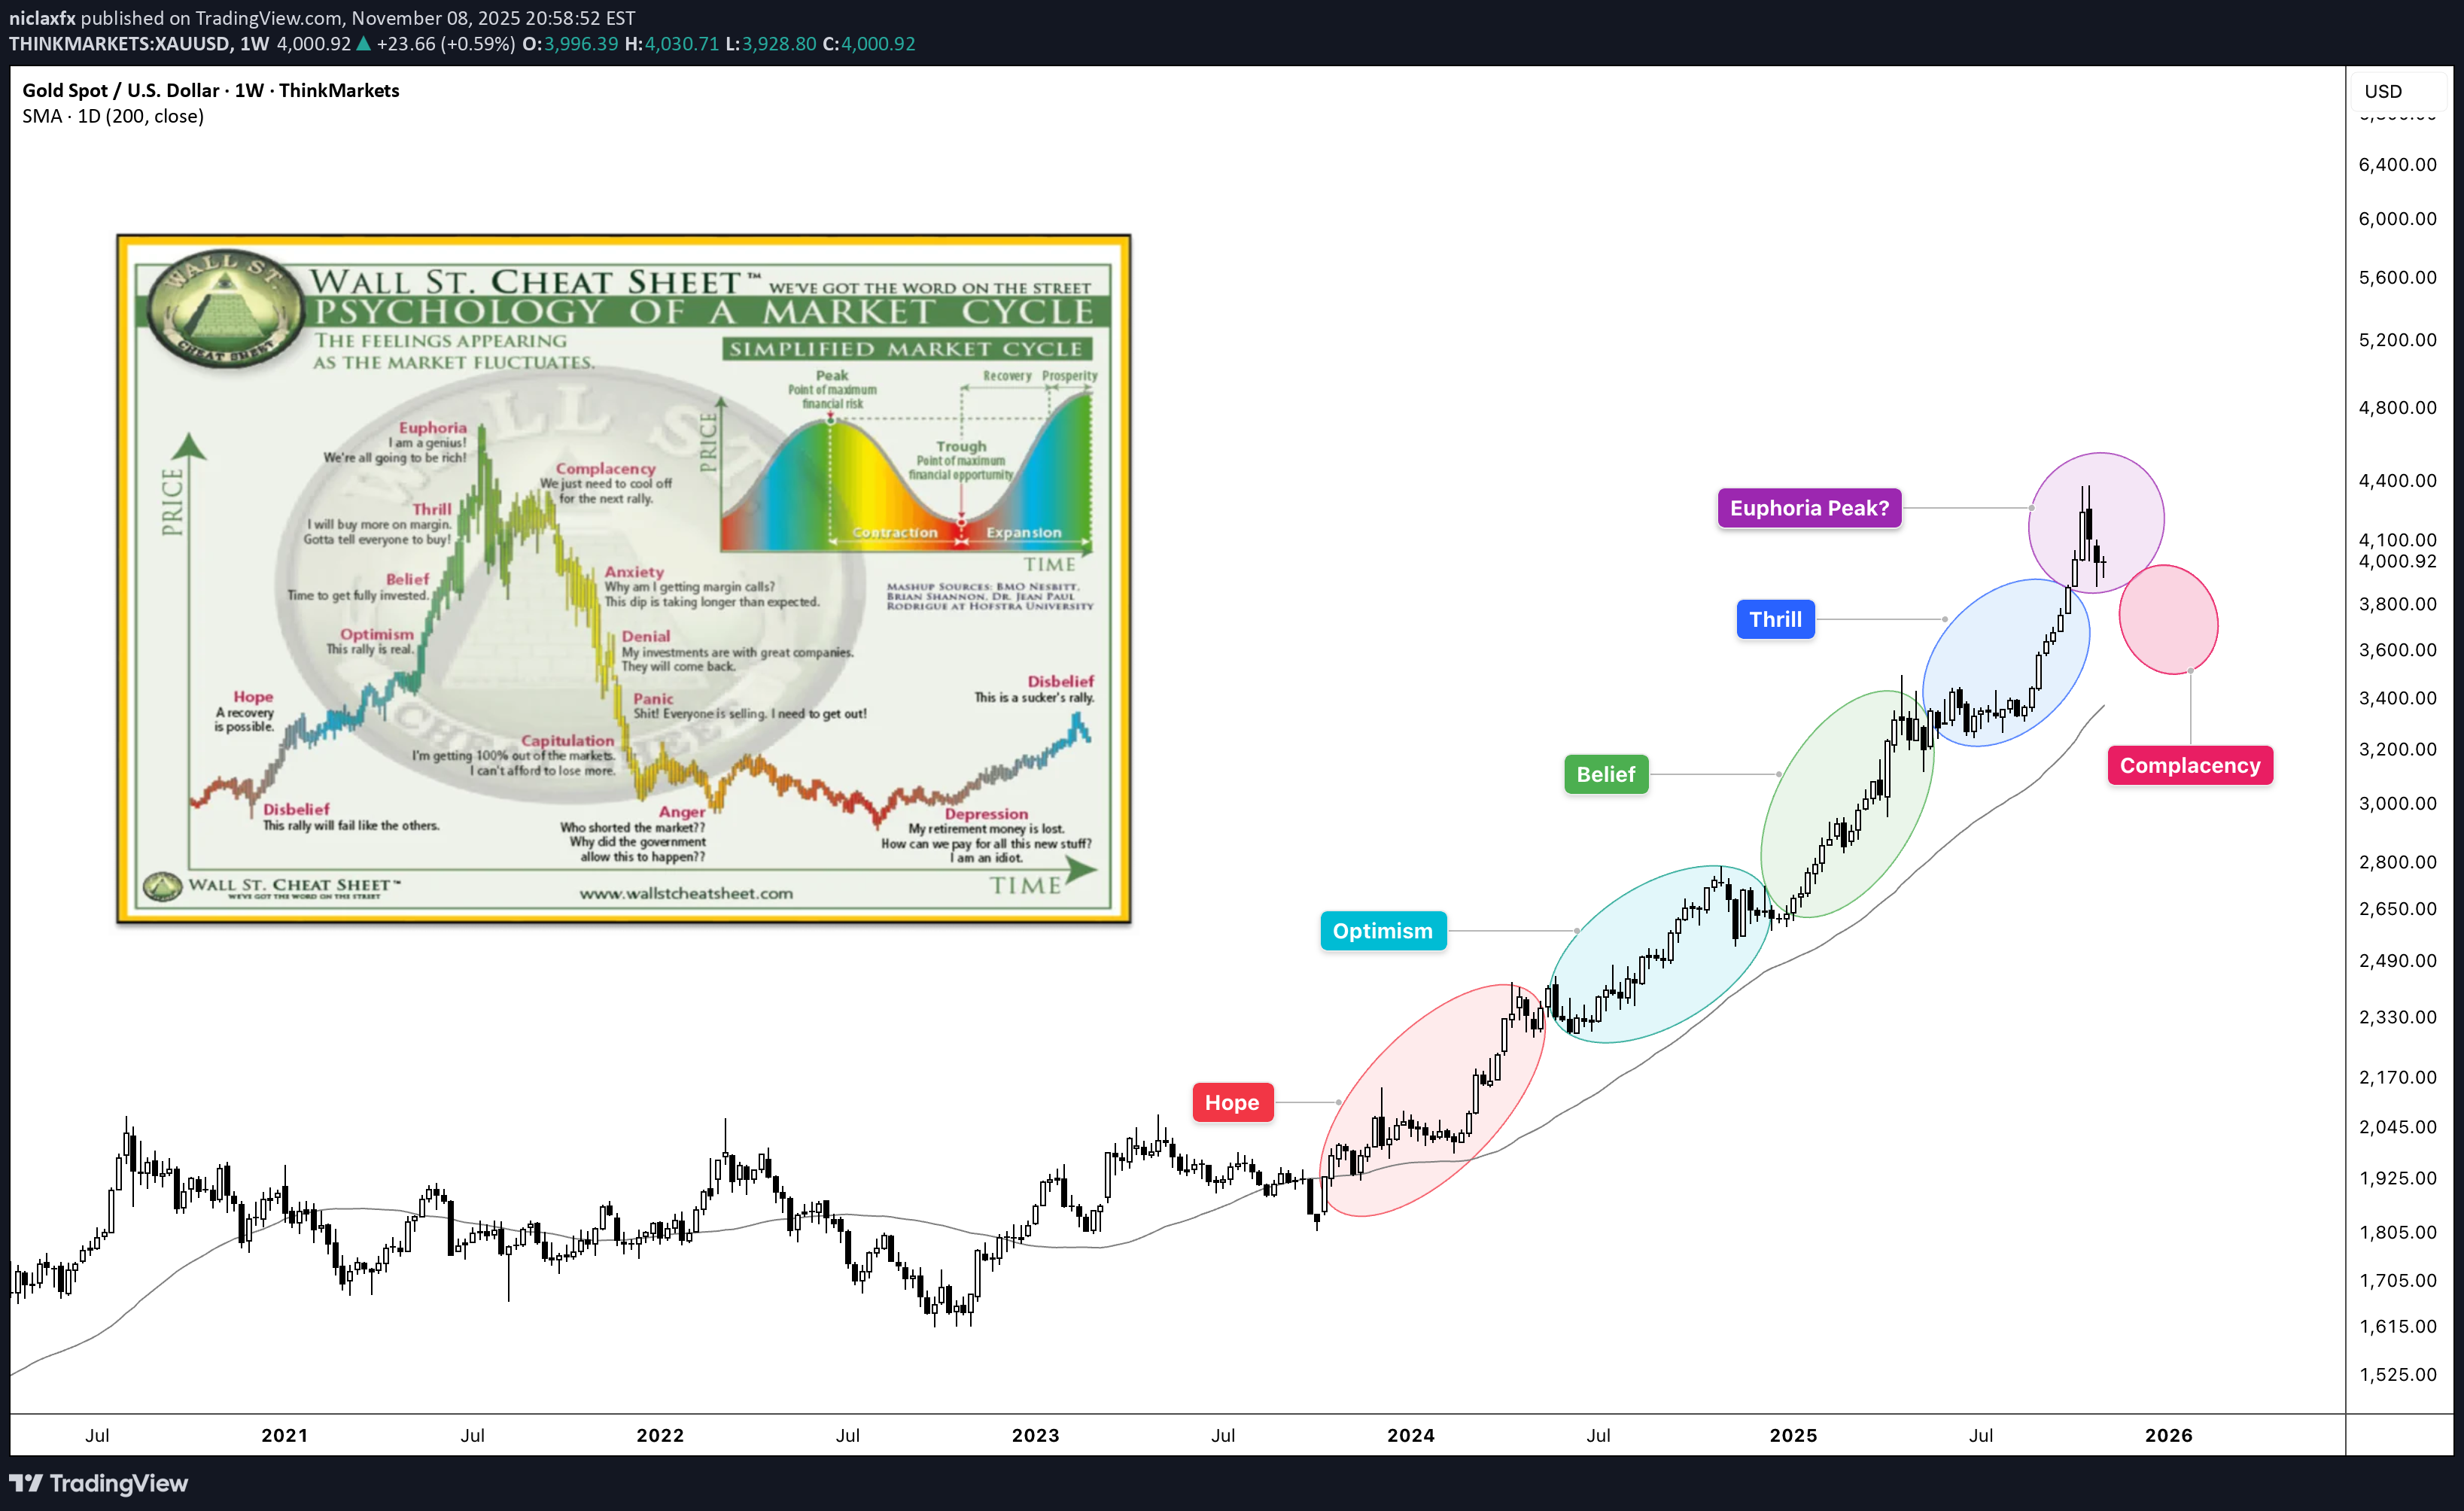
🧠 The Psychology Test That Changes Everything Here's a simple test that will tell you everything about where GOLD and BITCOIN is in its cycle: Look at these two charts. Which one screams "bull market euphoria"? ──────────────────────────────────── Chart One 🥇 GOLD : A Textbook Bull Market Current Price: $4,000.92 Peak Price: $4,390 (Recently hit) RSI: 69.15 Phase: EUPHORIA → COMPLACENCY (Post-peak pullback) What the Psychology Chart Shows: Looking at XAUUSD price action overlaid with the Wall Street Cheat Sheet: ✅ Clean parabolic structure - No ambiguity ✅ Multiple phases completed - Hope → Optimism → Belief → Thrill → Euphoria ✅ Peak already hit at $4,390 - The pink Euphoria circle was touched ✅ Now pulling back from peak - Classic post-euphoria behavior ✅ RSI cooling from overbought - Down from 85+ to 69.15 ✅ Volume still elevated as reality sets in This is what a COMPLETED bull market looks like. When you see this chart, you don't second-guess. You don't wonder "is this a bull market?" You KNOW it is. ──────────────────────────────────── Chart Two ₿ BITCOIN : Still in Early Stages Current Price: $101,802.2 RSI: 44.61 Phase: OPTIMISM (not even Belief yet) What the Psychology Chart Shows: Looking at BTCUSD price action overlaid with the Wall Street Cheat Sheet: ⚠️ "We are here" marker - Sitting in the OPTIMISM phase ⚠️ Haven't reached Belief yet - The green zone is still ahead ⚠️ Thrill phase - Blue circle far above current price ⚠️ Euphoria phase - Pink circle even further away ⚠️ RSI at 44.61 - Not even close to overbought ⚠️ Fourth Halving marker - April 22, 2024 clearly noted This is what mid-cycle consolidation looks like. ──────────────────────────────────── 🔍 The Critical Difference Let me use an analogy: Think of market cycles like a marathon. GOLD (Chart 1): Mile 26 - Just crossed finish line - Race is over, starting to cool down Runners are slowing down after sprint (Post-euphoria) Crowd peaked, now dispersing (Volume still high but declining) Everyone saw the finish (Peak at $4,390) Now wondering if they should have sprinted harder BTC (Chart 2): Mile 8 of 26 - Still early in the race Runners are fresh and steady (Optimism) Crowd is watching but not cheering wildly yet Most people aren't even at the venue yet Many spectators think the race might be cancelled ──────────────────────────────────── 📊 Side-by-Side Psychology Comparison ──────────────────────────────────── 🎯 What This Tells Us About BITCOIN If BTCUSD were truly at a cycle top, it would look like GOLD : ❌ Parabolic vertical moves ❌ RSI pinned above 75 for weeks ❌ Volume exploding ❌ Everyone saying "Bitcoin to $500K" ❌ Taxi drivers asking about crypto ❌ Magazine covers everywhere ❌ No doubt whatsoever about the trend But BTCUSD looks nothing like that: ✅ Choppy consolidation ✅ RSI in neutral zone (44.61) ✅ Volume moderate ✅ Everyone asking "Is the bull market over?" ✅ Retail despair and fear ✅ Zero mainstream coverage ✅ Maximum doubt about the trend ──────────────────────────────────── 💡 The Psychology Principle Here's the key insight from behavioral finance: **"If you have to ask whether you're in a bubble, you're not in a bubble."** GOLD : No one is asking if GOLD is in a bull market. It's obvious. BITCOIN : Everyone is asking if BITCOIN is in a bull market. That's your answer. ──────────────────────────────────── 🧩 Where Each Asset Really Is GOLD - Post-Peak Bear Market Transition: Completed Phases: ✅ Hope (Oct '23 - May '24) ✅ Optimism (May '24 - Dec '24) ✅ Belief (Dec '24 - May '25) ✅ Thrill (May '25 - Sep '25) ✅ EUPHORIA - PEAKED at $4,390 (Oct '2025) Current Phase: 🔶 COMPLACENCY - "It'll come back to $4,390" Price: $4,000.92 (down ~9% from peak) Classic post-euphoria denial behavior What's Next: Anxiety → Denial → Panic → Capitulation (2026+) Time Remaining: Bull market is OVER - bear phase beginning ──────────────────────────────────── BTCUSD - Early-Mid Bull Market: Completed Phases: ✅ Hope (2023 - Post-FTX recovery) 🟡 OPTIMISM (Current - 2024-2025) Phases Still Ahead: ⬜ Belief ⬜ Thrill ⬜ Euphoria What's Next: Break into Belief phase → Thrill → Euphoria Time Remaining: Given BTC high volatile nature - 2-6 months of upside potential ──────────────────────────────────── 🎨 The Visual Test (Do This Right Now) Step 1: Look at the GOLD chart Does it look like a bull market? YES Could you be wrong? NO Is there any doubt? ZERO Step 2: Look at the BITCOIN chart Does it look like a bull market? MAYBE? Could you be wrong? POSSIBLY Is there any doubt? TONS Step 3: Ask yourself **"Would a cycle TOP have this much doubt and fear?"** The answer is NO. ──────────────────────────────────── 📈 What the RSI Divergence Tells Us GOLD RSI Pattern: Peaked above 85 during euphoria Currently cooling at 69.15 Rolling over from overbought Classic post-peak behavior This is bear market transition BITCOIN RSI Pattern: Sitting at 44.61 Plenty of room to run Not even approaching overbought Recent "Bear" signals flushing out This is early-cycle behavior Think of it like a gas tank: GOLD : Hit redline at $4,390, now coasting down on fumes BITCOIN : 45% full, tons of room to run ──────────────────────────────────── 🔥 The Contrarian Insight What the majority thinks: " GOLD is in a bubble, BITCOIN topped" What the charts actually show: GOLD is in a mature bull market (near end) BITCOIN is in early-mid bull market (tons of runway) The irony: Everyone trusts GOLD rally (late stage) Everyone doubts BITCOIN rally (early stage) This is exactly backwards. ──────────────────────────────────── 🎭 The Emotional State Comparison GOLD Holders Right Now: 😰 Starting to feel anxious (down from $4,390) 🤔 "It'll bounce back, right?" 📉 Checking price hoping for recovery 🙃 "I should have sold at $4,390" 😬 "This is just a healthy correction" This is COMPLACENCY - the denial phase after euphoria. BITCOIN Holders Right Now: 😰 Anxious and doubtful 🤐 Not talking about their positions 😔 Wondering if they should sell 📉 Feeling defeated 💀 "Maybe the cycle is over" Which emotional state typically marks: Post-cycle tops? → GOLD current state (Complacency/Denial after Euphoria peak) Cycle middles? → BITCOIN current state (Doubt during Optimism) ──────────────────────────────────── 💎 The Bottom Line Using the Wall Street Cheat Sheet as our guide: GOLD : Phase: Thrill → Euphoria Completion: ~95% through cycle Risk/Reward: High risk, limited reward Action: Take profits soon BITCOIN : Phase: Optimism (just finished Hope) Completion: ~30% through cycle Risk/Reward: Moderate risk, massive reward Action: Accumulate aggressively ──────────────────────────────────── 🧠 The Psychology Lesson The market is designed to make you feel wrong at exactly the wrong time: When GOLD peaked at $4,390 (Euphoria) → You felt confident, " GOLD to $5K!" Now GOLD is pulling back (Complacency) → You feel like "it's just a correction" When BITCOIN is cheap and poised (Optimism) → You feel scared to buy This is why most people: Miss selling tops (felt too good at $4,390) Hold through corrections (denial and complacency) Sell bottoms during fear (Optimism feels scary) To win, you must: Trust the structure over the sentiment Buy when it feels uncomfortable (Optimism/Belief) Sell when it feels amazing (Euphoria/Peak) ──────────────────────────────────── 📍 Where We Actually Are HOPE → OPTIMISM( BITCOIN ) → BELIEF → THRILL → EUPHORIA ( GOLD $4390 Peak) → COMPLACENCY → ( GOLD Current) BITCOIN is 3-4 phases behind GOLD . GOLD already peaked. BITCOIN hasn't even started its parabolic phase yet. ──────────────────────────────────── 🎯 What This Means for Your Portfolio If you're holding GOLD at $4,000: You missed the peak at $4,390 You're in post-euphoria complacency "It'll bounce back" is denial Risk/reward is terrible now Exit strategy needed YESTERDAY If you're doubting BITCOIN at $102K: You're sitting in Optimism You're early to the party Peak is 3-4 phases away Risk/reward is excellent Accumulation strategy needed NOW ──────────────────────────────────── 🔚 Final Thought The next time someone tells you " BITCOIN topped," show them these two charts side by side. Ask them: "Which one actually topped?" The answer is clear: GOLD peaked at $4,390 and is now in complacency denial. BITCOIN is still in optimism. GOLD finished its race. BITCOIN is just finishing Act 1. The Golden Bull Run isn't over—it's barely begun. ──────────────────────────────────── This is educational content comparing market psychology across asset classes. Not financial advice. Always do your own research and manage risk appropriately. ────────────────────────────────────
niclaxfx
سقوط بیت کوین توهم بود؟ چرا رالی طلایی واقعی تازه شروع نشده است!
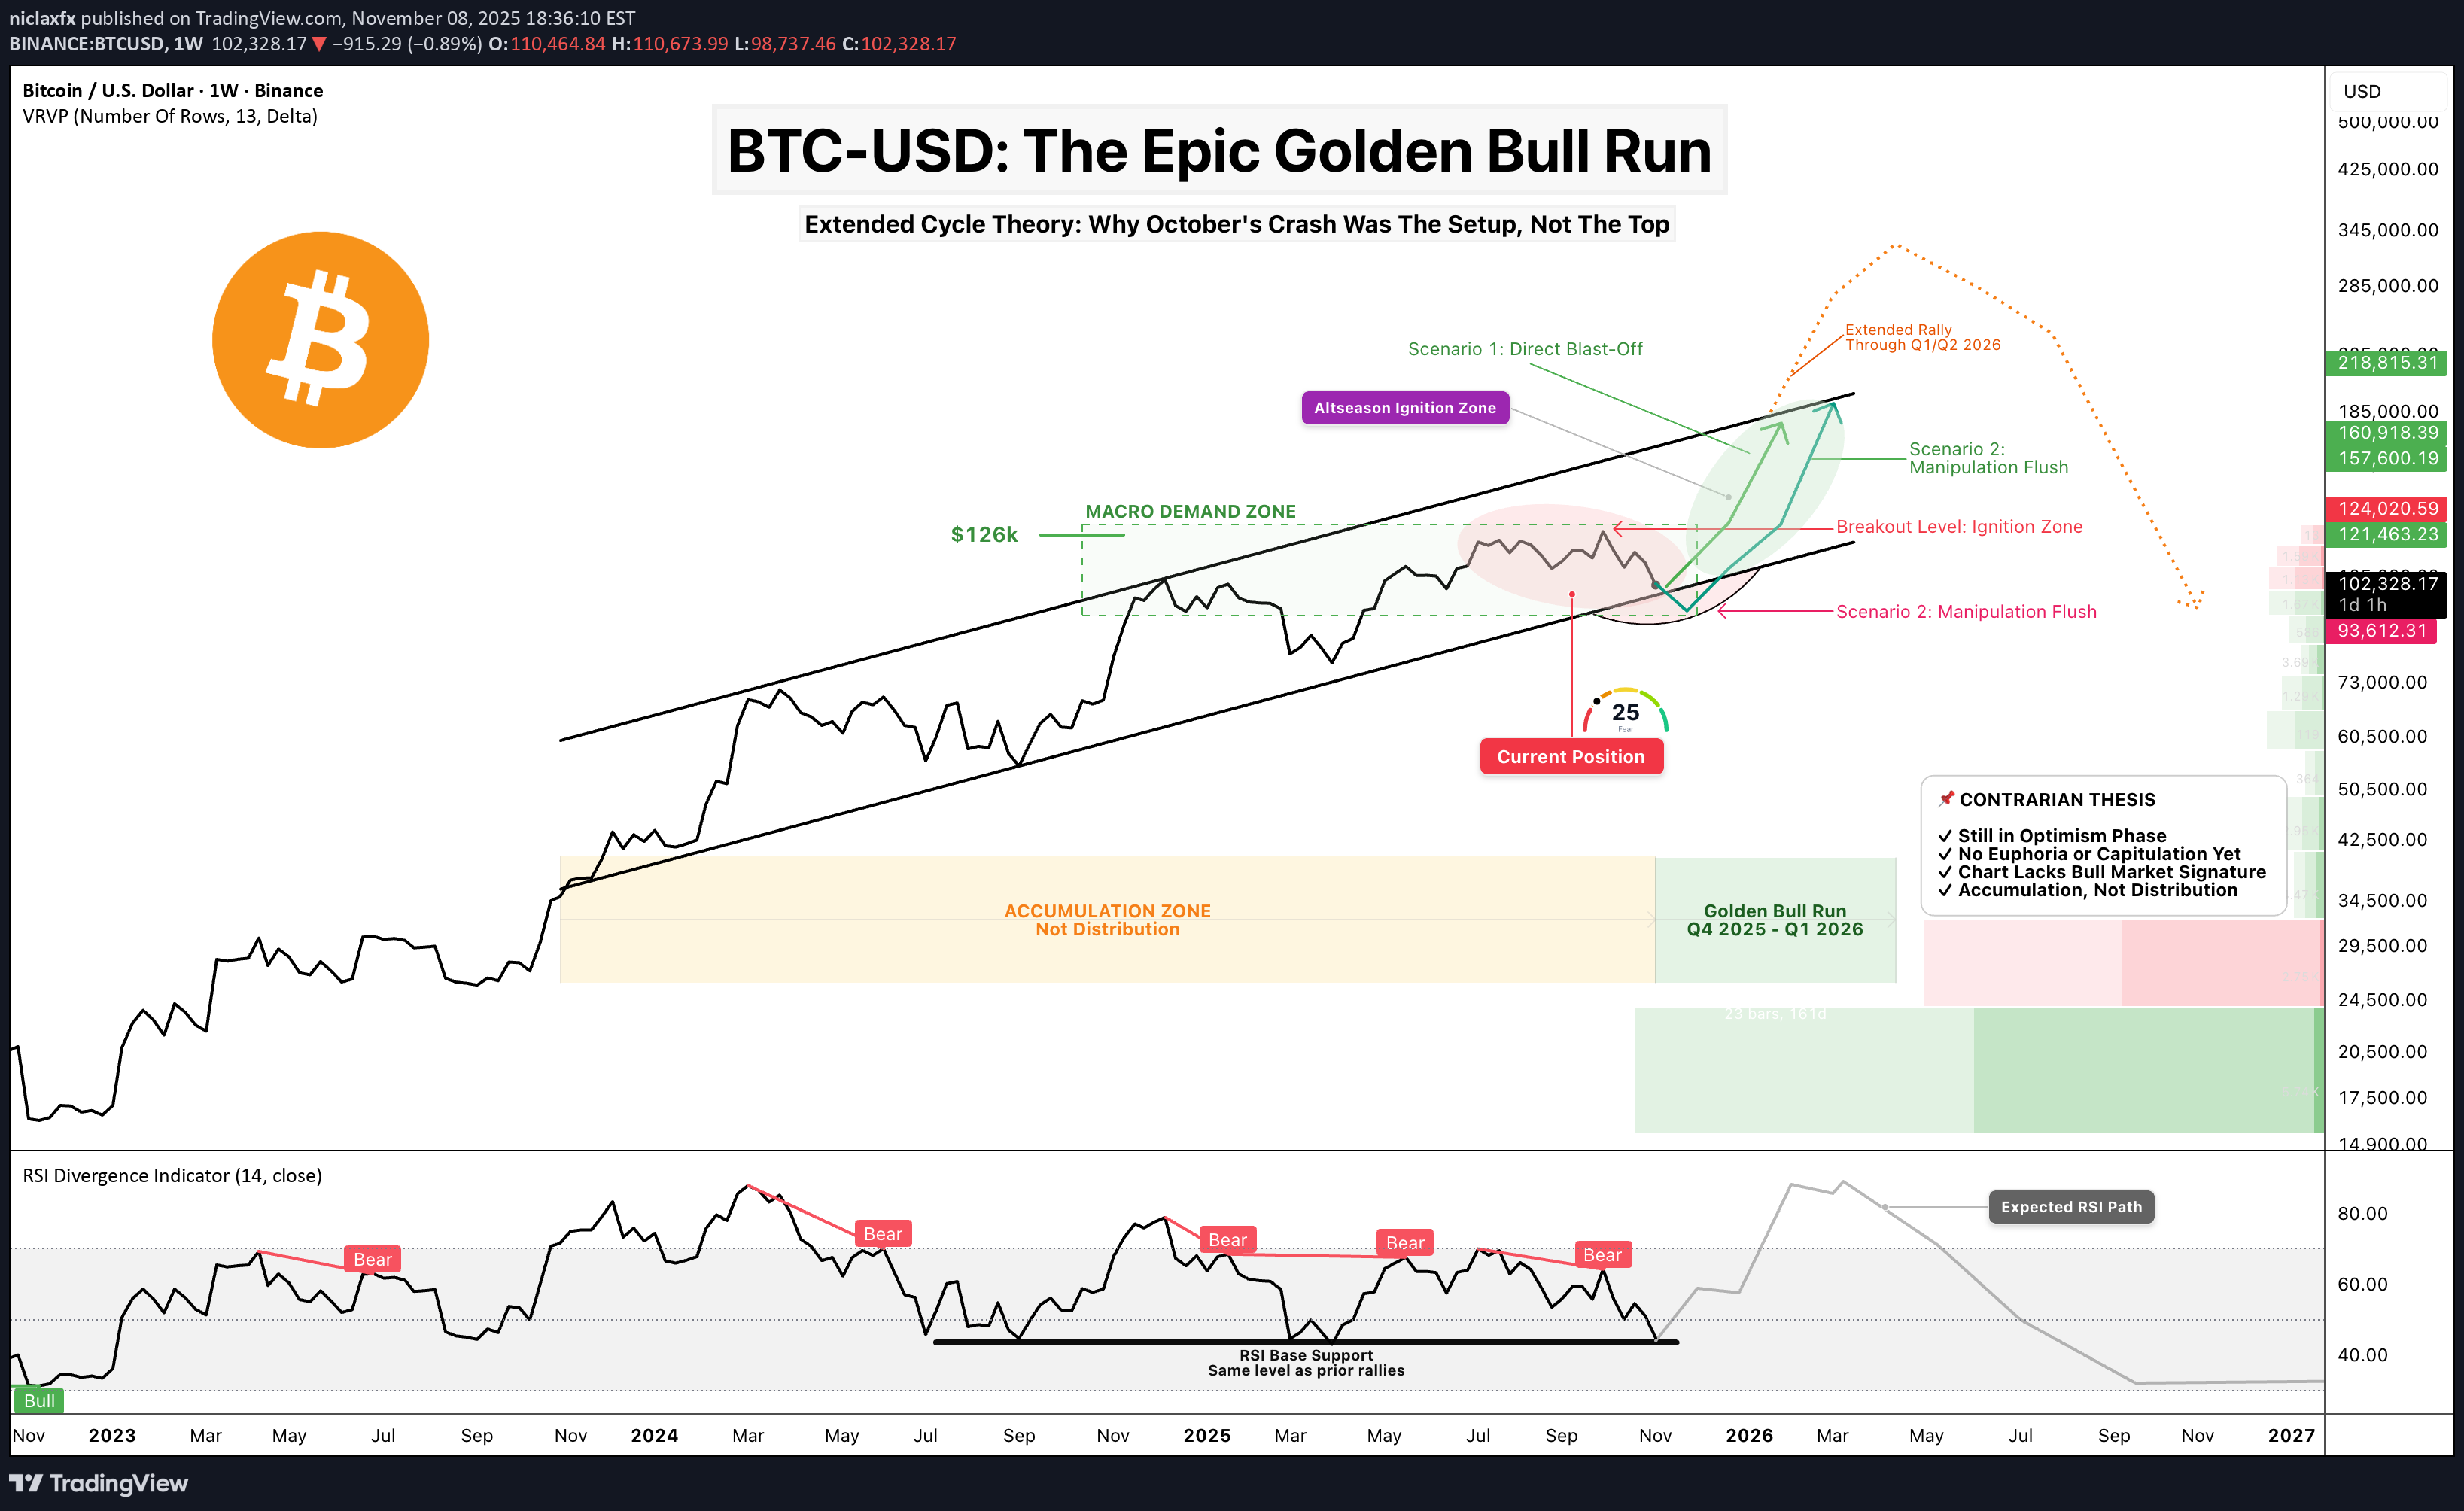
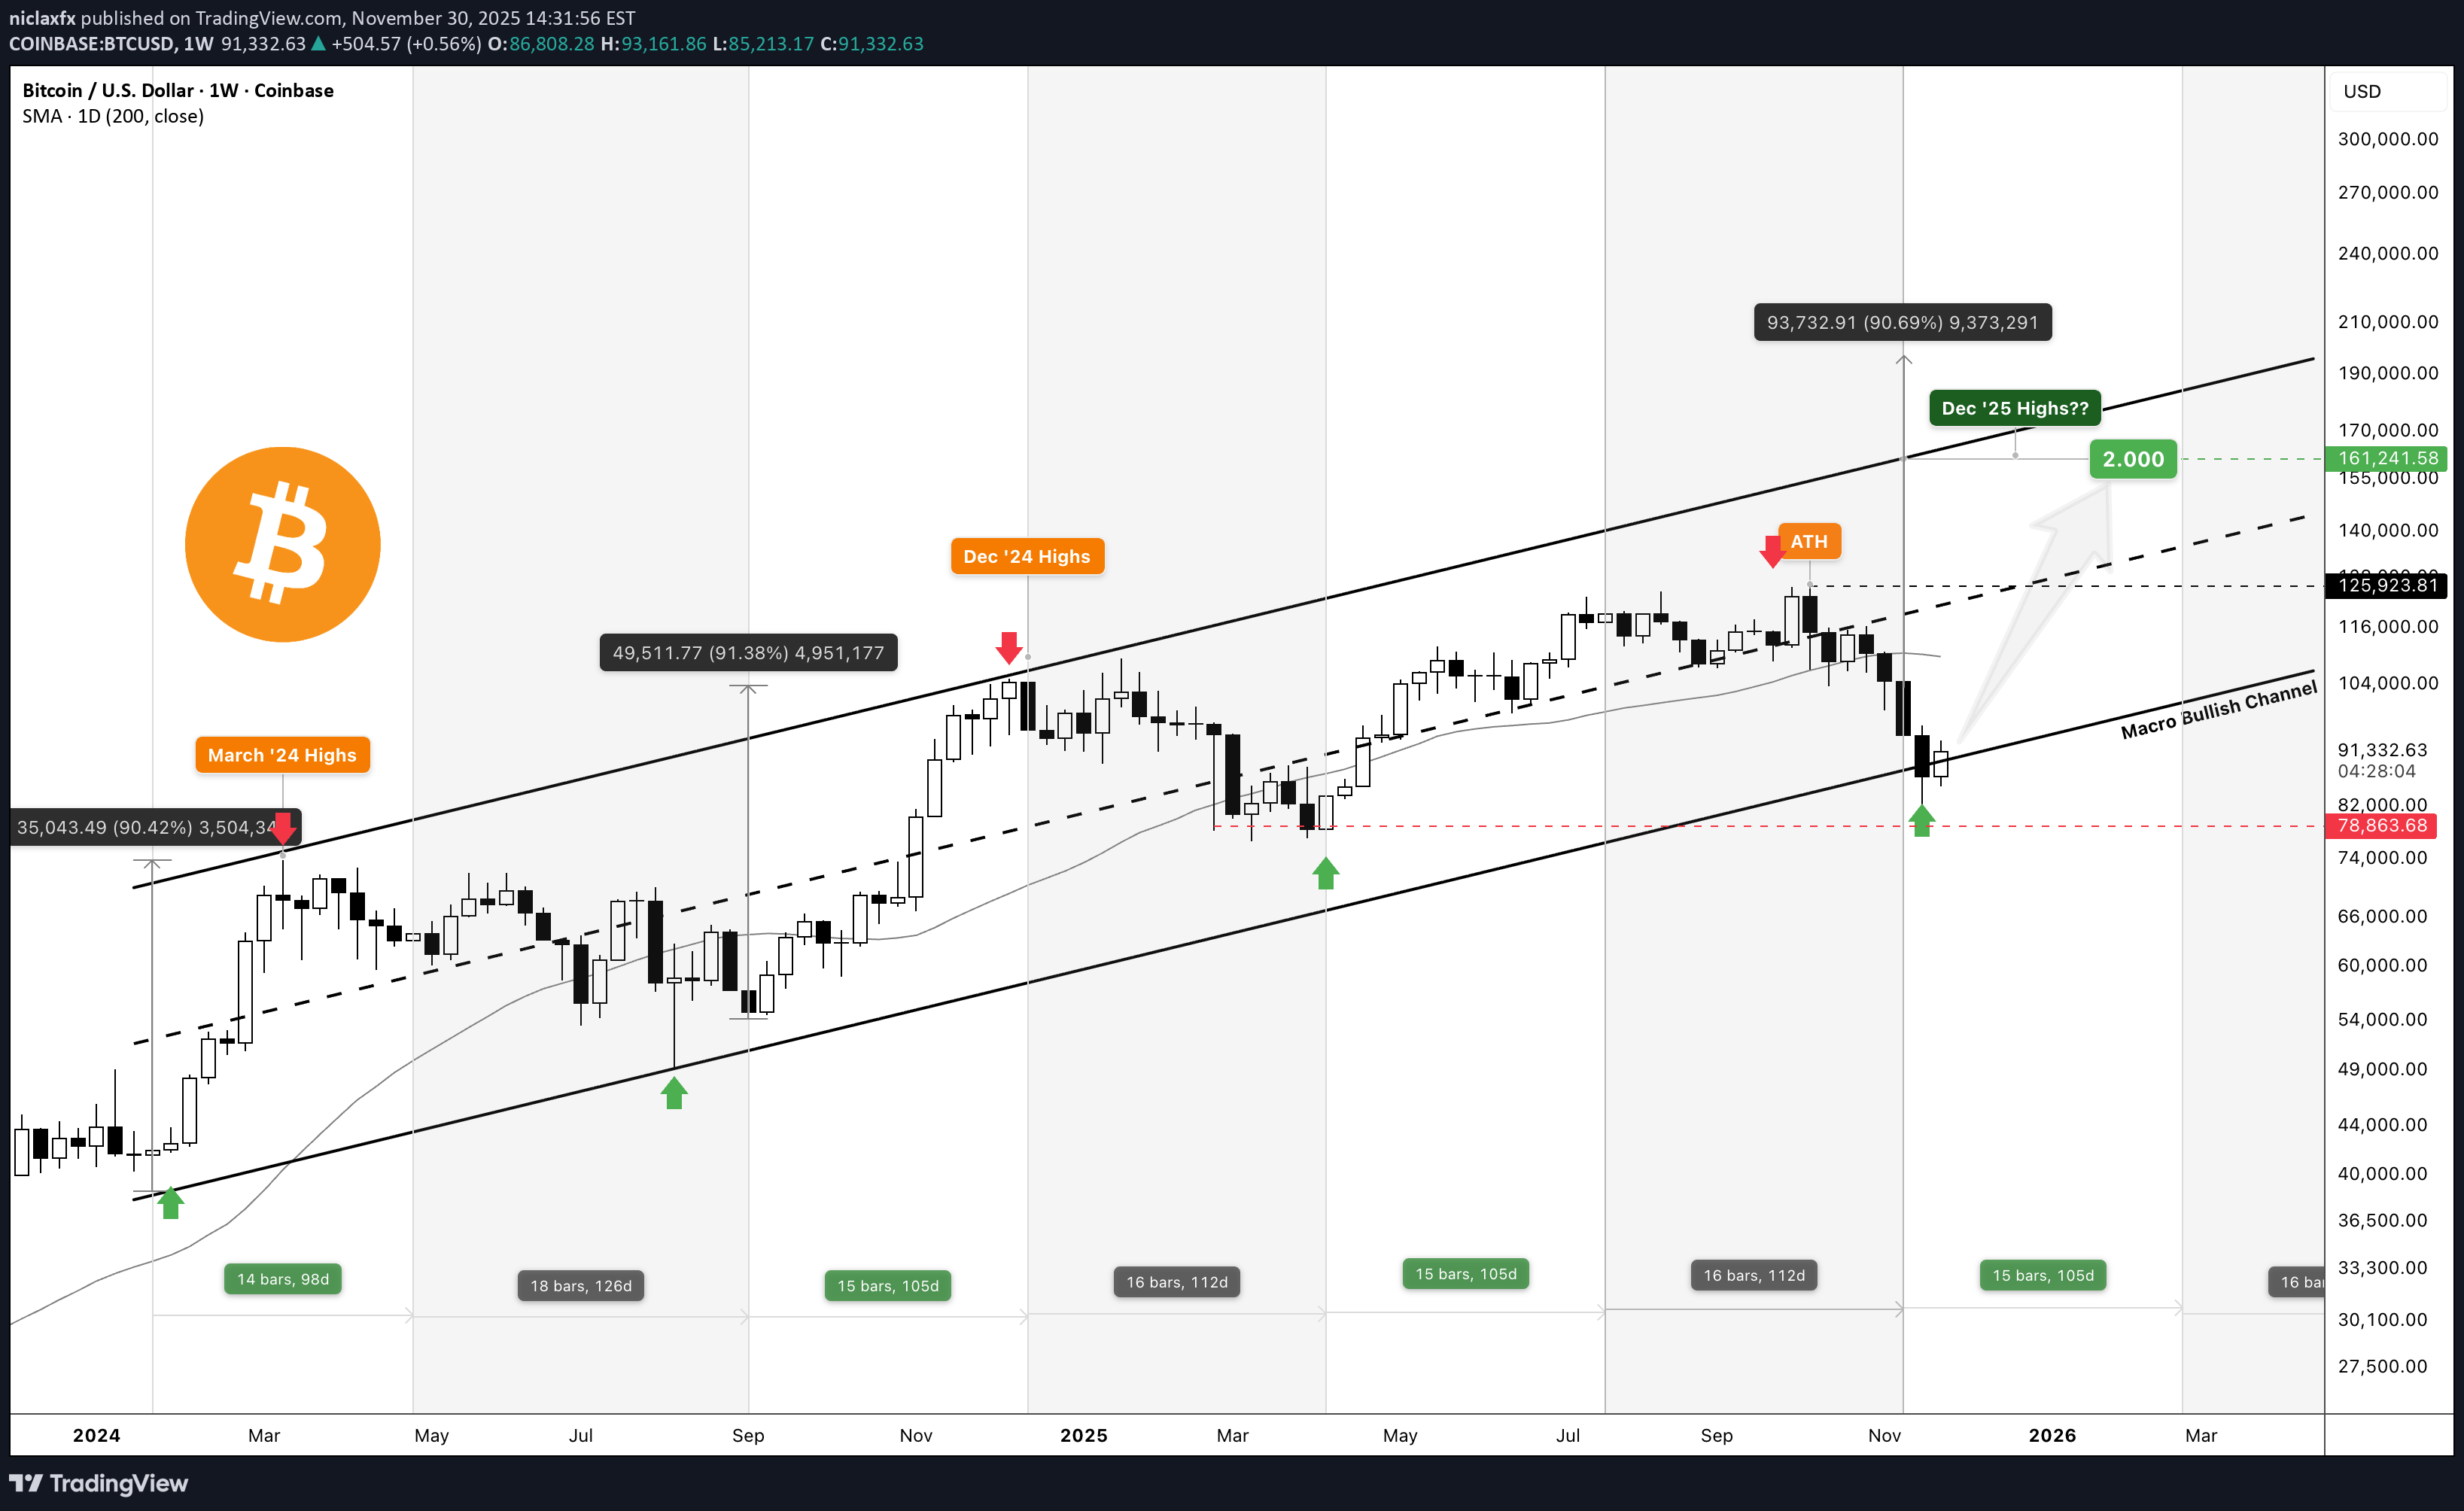
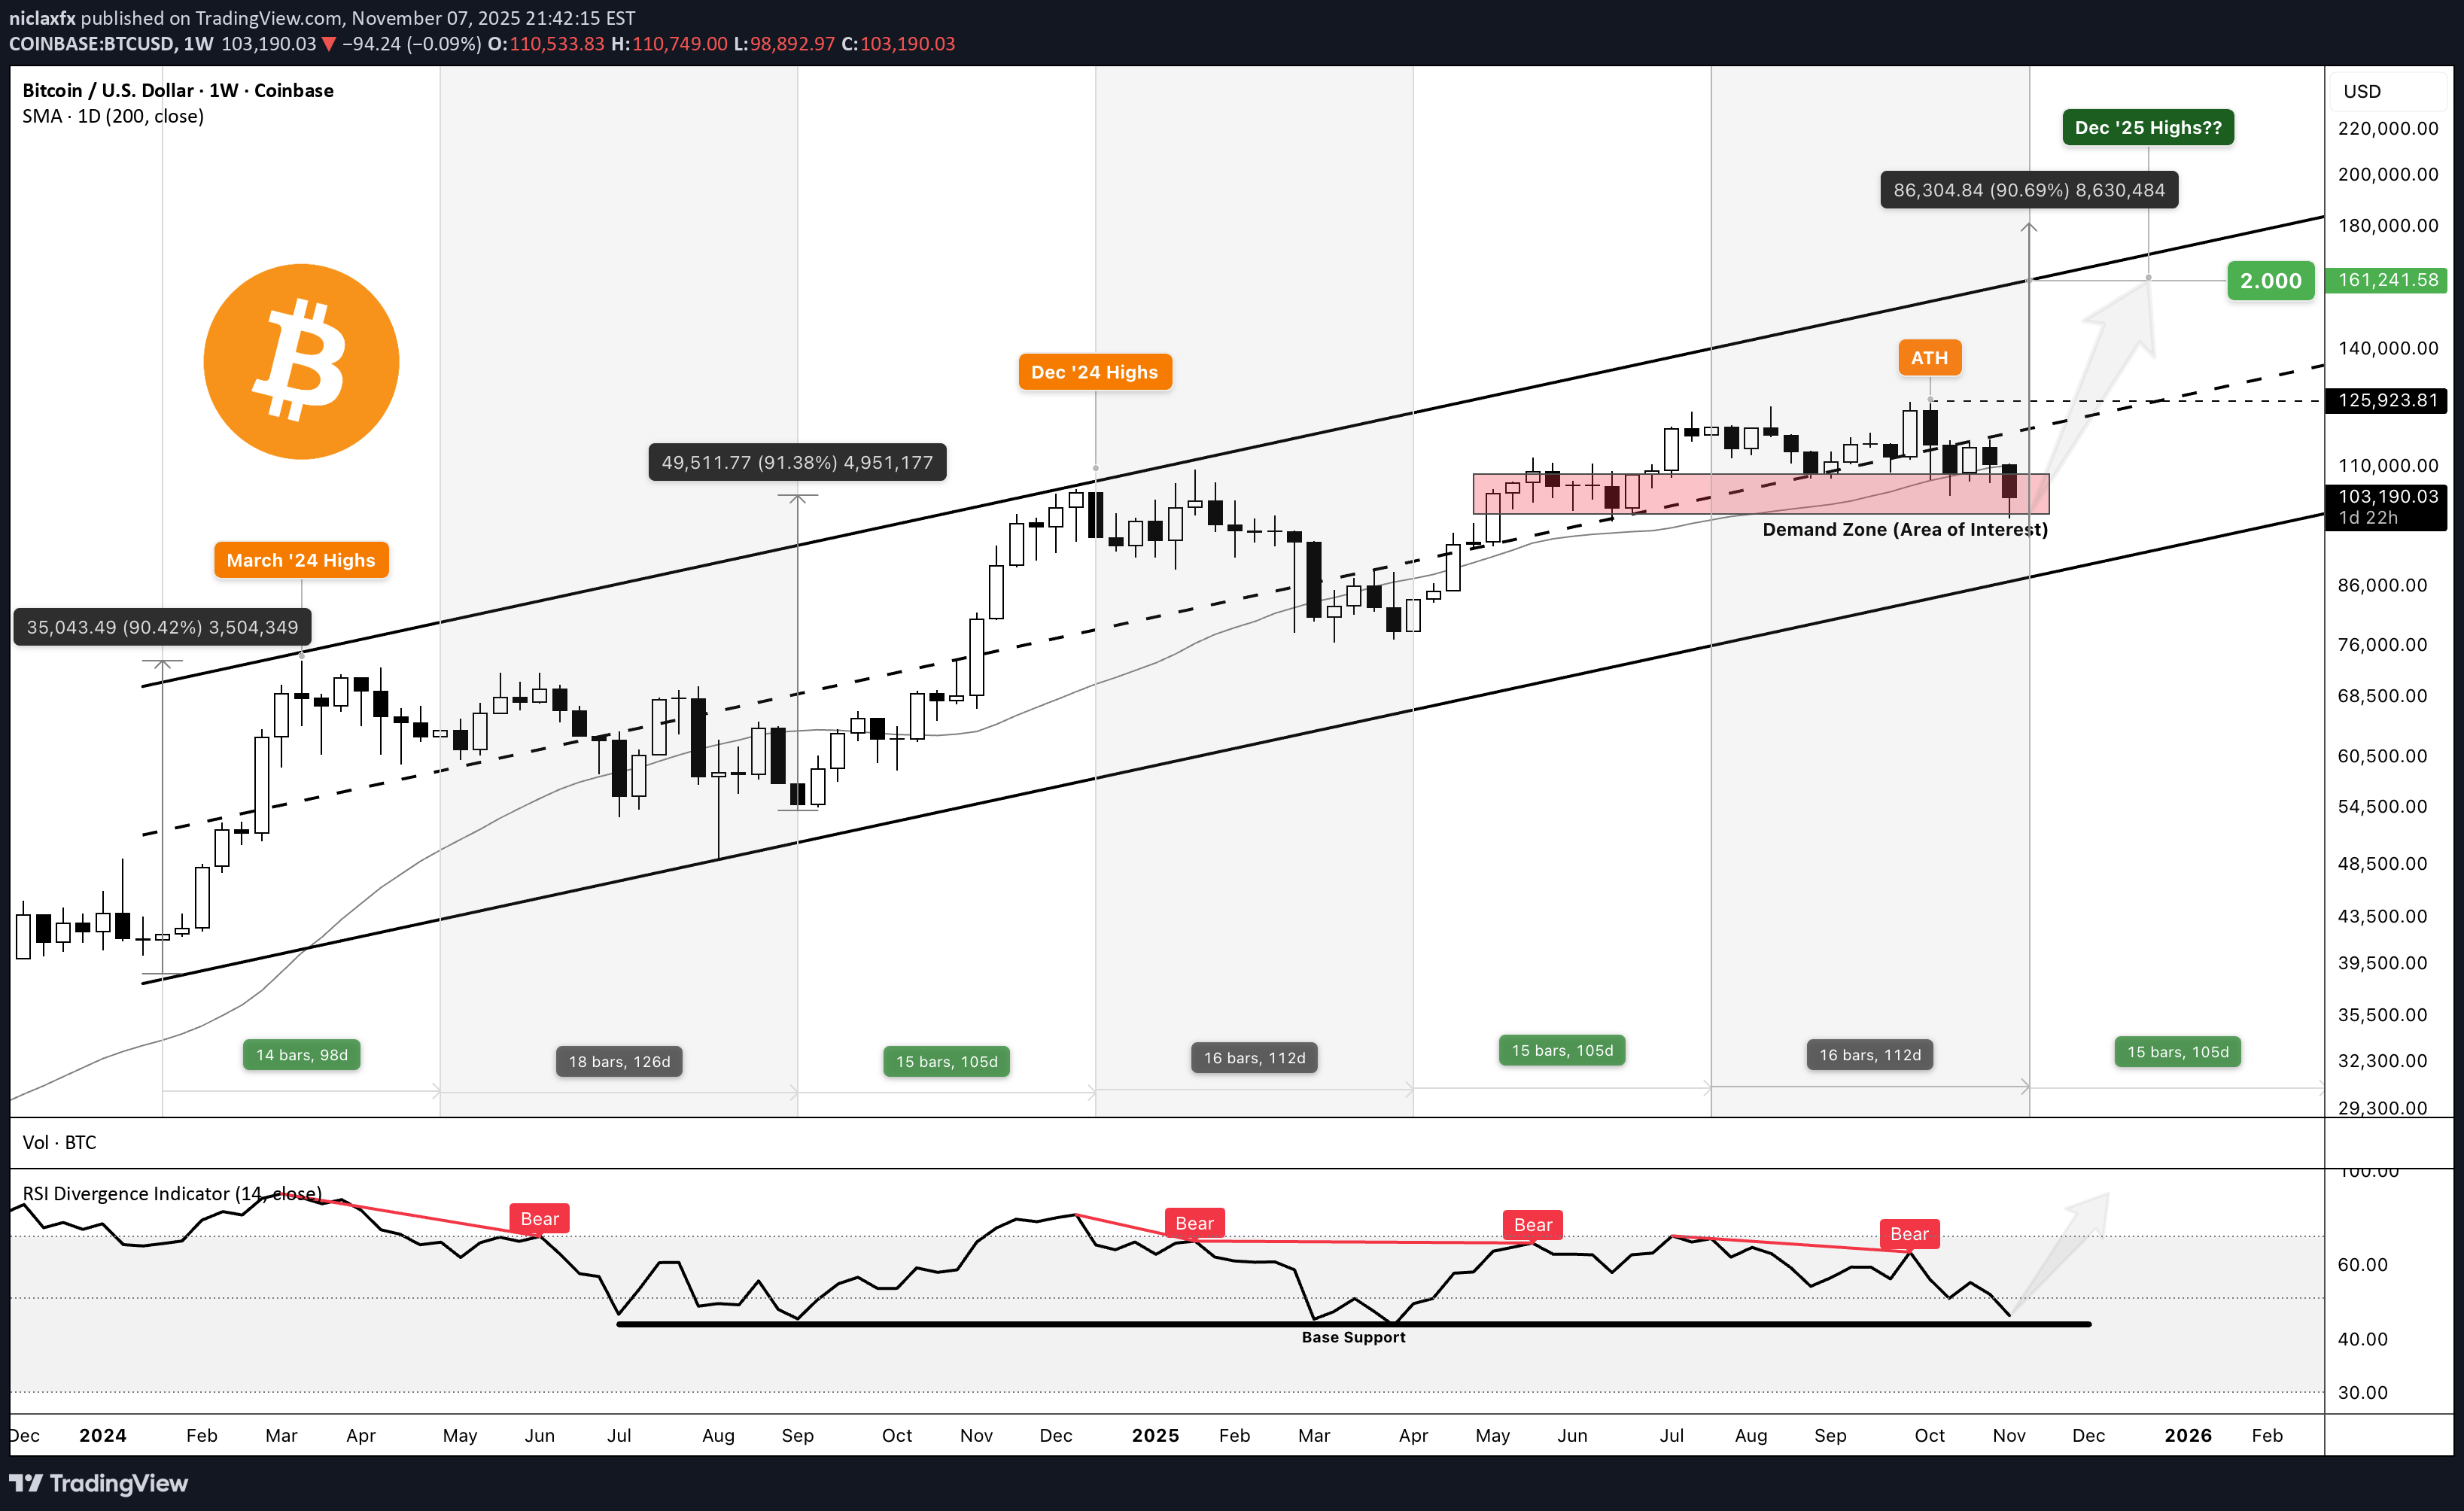
Yes, I get it. Everyone thinks we're already in a bear market. Hope is lost. Life-changing money evaporated. The October crash saw $19 billion in forced liquidations —the largest in crypto history. Some tragically took their own lives. No one wants false hope right now. But I don't think the bull market is over. And here's why—backed by data, not hopium. ──────────────────────────────────── ⚠️ DISCLAIMER This post is strictly my personal beliefs and thoughts, and should NOT be construed as financial advice, nor does it mean the market must go this way. This will be a long read but would be worth the time. Sit tight and grab a beer 🍻 ──────────────────────────────────── Context: Where I Stood in September First, I want to share that as of the last week of September, I gave a detailed breakdown of the market and shared why I thought the bull market was over, which I tagged "The Great Convergence." Read below if you missed that:👉 In that post, I worked with the BITCOIN halving cycle theory (along with SPX and GOLD ), which for over a decade has been the most efficient, accurate, and proven method for timing BITCOIN rallies, tops, and bottoms. By halving theory, the bull market should have ended by August/September 2025. What Actually Happened: Early October : BITCOIN briefly touched a new ATH near $126,296 October 1st : US government shutdown begins, draining $700B+ from markets via TGA October 10th : Trump's 100% China tariff threat triggers $19.13B liquidation cascade in 24 hours BITCOIN crashed from $126K to below $104K—an 18% drop in days October became the first "red October" since 2018 1.6 million traders liquidated—20x larger than COVID crash, 12x larger than FTX November 8th (Today) : Market hovering around $100-102K in extreme fear (Fear & Greed Index: 21) ──────────────────────────────────── 🔍 What's Different About This Current Cycle Here's what stands out as fundamentally different: 1️⃣ The Recent TOTAL Crypto Liquidation Wasn't Capitulation—It Was Infrastructure Cleansing This wasn't profit-taking or true capitulation. The numbers tell the story: $19.13 billion in forced liquidations in 24 hours 1.6 million traders wiped out 20x bigger than the March 2020 COVID crash ($1.2B) 12x bigger than the FTX collapse ($1.6B) This was leverage-driven, not sentiment-driven. The weak hands and overleveraged positions got flushed out. Meanwhile, strong hands (institutions, whales) continued accumulating through the chaos. Key Difference : In true bear market capitulations, holders capitulate. In October, leveraged speculators capitulated while spot holders held firm . ──────────────────────────────────── 2️⃣ The Liquidity Vacuum Is Temporary (This Is Critical) Here's what most people are missing about October: The crash wasn't just about tariffs—it was about a government-induced liquidity crisis . What Happened: US government shutdown began October 1st Treasury General Account (TGA) balance swelled from $800B to over $1 trillion in just 20 days That's $200+ billion drained from the financial system Standing Repo Facility (SRF) usage hit $50.35 billion on October 31—highest since the pandemic crisis in March 2020 This indicated severe dollar shortage in the system Why This Matters: BTCUSD correlation with dollar liquidity remains near 0.85 When the government shutdown ends and resumes spending, that liquidity floods back BitMEX analysts project a strong relief rally when hundreds of billions are injected back This isn't a structural bear market—it's a temporary liquidity vacuum. ──────────────────────────────────── 3️⃣ Institutional Holders Aren't Selling Like Retail Did in Past Cycles Whale Accumulation Data: 1,455 wallets now hold over 1,000 BTC UTXO Age Distribution shows a 5% spike in "Over 8 Years" buckets Long-term holders are doubling down , not distributing Whale Originating Transaction Count: Miner Behavior: Post-halving, miners anticipated higher prices and chose to hold rather than sell immediately While smaller miners face profitability pressure, institutional holders are not showing distribution patterns ETF Context: U.S. spot Bitcoin ETFs saw $1.2B+ in outflows during the crash week October 16 alone: $536 million in panic redemptions BlackRock's IBIT : $268.6M out | ARK's ARKB: $275.2M out BUT HERE'S THE KEY : These were temporary panic outflows, not structural distribution. Year-to-date, institutional accumulation has been relentless . The October outflows represent weak hands being shaken out—exactly what you'd expect in a mid-cycle correction, not a cycle top. ──────────────────────────────────── 4️⃣ No FOMO. No FUD. No Euphoria. (Strongest Psychological Indicators) Let's compare sentiment metrics: Current Sentiment: Crypto Fear & Greed Index: 21-25 (Extreme Fear) as of November 7-8 BTCUSD RSI as at Oct ATH: ~60 (far below euphoric 75+ levels) Market Mood: Despair, capitulation narrative, "bear market confirmed" True Bull Market Top Sentiment (for comparison): Fear & Greed Index: 80-95 (Extreme Greed) RSI: 75-85 (overbought for weeks) Market Mood: "Bitcoin to $500K," taxi drivers asking about crypto, covers of mainstream magazines We haven't even come close to euphoria. The 2024 meme coin craze was a micro-cycle within the broader structure—too early and too isolated to be considered true market-wide euphoria. ──────────────────────────────────── 5️⃣ The CHART Does Not Reflect a Bull Market Yet This is where I'll let the charts speak. First, Look at Gold's Bull Market: 👉 Clean. Parabolic. Obvious. No second-guessing needed. Now Look at Bitcoin: 👉 Ask Yourself Honestly: Does this chart scream "parabolic bull market"? Does the recent ATH look like a blow-off top? Does the volume profile suggest distribution? If you can't answer YES with conviction, then the answer is NO. A Simple Psychology Principle I Use: If I can't say YES without doubting my decision, then the answer is NO. ──────────────────────────────────── 6️⃣ Cycle Coincided with AI Tech Mania and GOLD Super Rally This cycle is unique because capital had competing destinations: AI Tech Mania : Nvidia, AI stocks absorbed massive capital flows GOLD Super Rally : GOLD broke out to all-time highs, attracting safe-haven capital Risk-On Delay : BTCUSD became less attractive as capital rotated elsewhere This delayed the typical BITCOIN Bitcoin cycle dynamics—it didn't end them. ──────────────────────────────────── 🧠 My Contrarian Thesis While this might sound crazy, I believe we are still in the OPTIMISM phase of this rally. Unlike previous cycles, I believe we will experience an extended rally lasting through Q1/Q2 2026. My Thesis is NOT Based On: ❌ Traditional Halving Cycle Theory — I believe that timeline will be extended and recalibrated this time ❌ Stock-to-Flow (S2F) Alone — Though I lean toward its supply dynamics My Thesis IS Based On: ✅ Pure naked price action and structure ✅ Volume profile analysis showing accumulation ✅ Market structure and RSI positioning ✅ Government liquidity mechanics and TGA dynamics ✅ Institutional vs retail behavior divergence ✅ Psychological playbook of market cycles ──────────────────────────────────── 🔄 Why the Halving Cycle Is Extended, Not Broken Many are saying "the 4-year cycle is dead." I disagree. It's not broken—it's being distorted and extended by new factors: The ETF Factor Changed Everything: Traditional Halving Cycle: Post-halving scarcity → slow accumulation → parabolic phase ~500-550 days later 2024-2025 Cycle: January 2024: Spot BTCUSD ETFs approved ETFs brought forward typical post-halving demand 12 months early This created an early rally into March 2024, then consolidation October 2025: Temporary ETF panic outflows (weak hands exit) Framework : The cycle hasn't ended—it's been stretched across a longer timeframe Historical Context: Historically, most significant price appreciation occurred between days ~500-550 post-halving For the April 2024 halving, that window ends Q3 2025 ... but if we factor in the time lag and the now running ~2-Months Govt shutdown delay then that window could be adjusted to Q3 2025 - Q1 2026 See it like a football match, time delay during match is added as extra time, it doesn't mean the 90min rule is broken simply means wasted time must be accounted for. We're literally in the window right now Expert Analysis: Leading analysts suggest the era of the strict 4-year cycle is evolving Market maturity, institutional concentration, and dampened volatility mean the traditional rhythm is being replaced by liquidity-sensitive, macro-correlated behavior The cycle isn't gone—it's adapting to a new market structure ──────────────────────────────────── 📈 The Current Chart Breakdown Look at the Chart Again: 👉 Four Critical Questions: 1. Does this move look like a completed rally? → No. It looks like mid-cycle consolidation with a violent shakeout. 2. Does the recent ATH reflect a distribution top? → No. Volume and RSI don't support distribution behavior. The ATH was a brief spike , not a prolonged distribution phase. 3. What does the volume profile show? → Accumulation zone. Heavy volume during the $95K-$110K range indicates re-accumulation, not distribution. 4. What is the RSI telling us? → Sitting on base support —the same level that triggered every prior bull market explosion in this cycle. Conclusion: If both price action and volume show accumulation rather than distribution, we're in a re-accumulation phase, not a post-rally distribution phase. ──────────────────────────────────── 🎯 The Macro Setup BTC is Positioned Perfectly: ✅ Inside the macro demand zone that has held since late 2023 ✅ On the ascending channel that guided every major leg of this cycle ✅ Channel from 2023 is intact and pointing into six-figure territory ✅ Weekly demand zone holding with precision — re-accumulation, not distribution ✅ Weekly RSI on base support — same level that triggered every bull explosion ✅ Nothing is broken. Nothing is topping. This is positioning, not exhaustion. ──────────────────────────────────── I shared this analysis yesterday, you can read the full or the summarized version below: 📅 Cycle Structure: The 14-15 Week Expansion Pattern Every expansion leg in this cycle has followed a pattern: 14-15 weeks of expansion Followed by 16-18 weeks of correction Where Are We Now? End of the correction window Beginning of the next expansion phase Historical Precedent: If we follow 2017's pattern (euphoric Nov-Dec Rally) where BTC gained +200% in price between Nov 17 -Dec 17 from 5.6k+ to 19.6k+, we could see an explosive acceleration starting from Next week Mid-November - December 2025 With institutional adoption and extended liquidity cycles, this could push into Q1 2026 This would make the current cycle the longest on record , not the end of one ──────────────────────────────────── 🔥 What the Chart Is Screaming Key Technical Signals: Ascending Channel Intact — Channel from late 2023 still pointing to six figures Demand Zone Holding — Weekly demand zone defended with precision Breakout Level Clear — $126K break = ignition point for macro acceleration RSI Base Support — Weekly RSI at the exact level that preceded every rally Projection Untouched — Path to $150K–$170K remains structurally intact ──────────────────────────────────── 🚀 Two Scenarios Moving Forward Scenario 1: Direct Blast-Off ⚡ Demand zone holds firm here Government shutdown ends → liquidity snap-back $126K breaks decisively within weeks New ATH confirmed Vertical acceleration into $150K–$170K by December 2025 Extended rally continues through Q1 2026 Scenario 2: One Final Manipulation Flush 🌊 Wick below demand zone (liquidity grab to $95K-$98K) Mid-channel tap for final shakeout Violent V-shaped recovery and reclaim Same ultimate target: $160K–$170K Timeline delayed by 4-8 weeks but destination unchanged Both scenarios end at the same place. The path differs, but the structure remains intact. ──────────────────────────────────── ❌ The Only Invalidation I will abandon this thesis if: Primary Invalidation: Weekly close below the ascending channel (currently ~$80K) Secondary Warning Signals: TGA doesn't release liquidity when government reopens Institutional ETF outflows continue for 2+ consecutive months Fear & Greed Index stays below 30 through EOY 2025 BITCOIN fails to reclaim $110K by end of November 2025 Weekly RSI breaks below 40 and stays there Until these conditions are met, the bull thesis remains structurally intact. ──────────────────────────────────── 💡 The Liquidity Snap-Back Thesis Here's the mechanism most traders are missing: How Government Shutdowns Affect Crypto: Phase 1: Shutdown (October 1 - Present) Government stops spending TGA balance grows ($800B → $1T+) Liquidity drained from system Dollar shortage (SRF at $50B+) Risk assets crash Phase 2: Reopening (Coming Soon) Government resumes spending TGA balance depletes back down $200B+ floods back into system Dollar shortage resolved Risk assets rally violently BTCUSD 0.85 correlation with dollar liquidity means: When liquidity drains → Bitcoin falls When liquidity returns → Bitcoin rips This isn't speculation—it's mechanical. The October crash was a liquidity event, not a sentiment event. When that liquidity returns, BTC will respond proportionally. ──────────────────────────────────── 📊 Why October's Liquidation Was Different From Bear Markets Let's compare major crypto crashes: The Critical Difference: Previous crashes: Spot holders capitulated October 2025: Spot holders accumulated while leveraged traders got wiped out This is cleansing, not capitulation. ──────────────────────────────────── 🎨 Compare: What a Real Bull Market Top Looks Like Signs of a Cycle Top We DON'T Have: ❌ Fear & Greed Index at 90+ for weeks ❌ RSI pinned above 75 ❌ Parabolic vertical price action ❌ "Bitcoin is going to $1 million" headlines everywhere ❌ Taxi drivers and hairdressers asking about crypto ❌ Massive miner selling at highs ❌ Whales distributing to retail ❌ Everyone you know is suddenly a crypto expert ❌ Cover stories on TIME, Forbes, Bloomberg ❌ New ATHs multiple weeks in a row Signs of Mid-Cycle Correction We DO Have: ✅ Fear & Greed at 21 (Extreme Fear) ✅ RSI at 46 (neutral to oversold) ✅ Choppy consolidation in range ✅ "Bull market is over" narratives everywhere ✅ Retail giving up and selling ✅ Whales accumulating quietly ✅ Liquidation event clearing out leverage ✅ Volume profile showing accumulation ✅ Market despair and hopelessness We're not at a top. We're in the middle of the game. ──────────────────────────────────── 💰 Why I'm All In In my last post I said I went ALL IN on BITCOIN and my selected alts. (after earlier shorting around 120k and sitting on cash) Not because I'm reckless. Not because I'm ignoring risk. But because: The macro structure is intact The demand zone is holding RSI is at historical launch support Volume shows accumulation, not distribution No euphoria has occurred yet The chart does not reflect a completed bull market Government liquidity will return mechanically Largest liquidation in history = weak hands removed Institutional holders aren't selling We're in the historical extended post-halving window This is structure. This is patience. This is conviction based on data. ──────────────────────────────────── 🙏 Final Thoughts I know many of you are hurting right now. I know hope feels dangerous. But look at the data objectively: October was the largest forced liquidation in history—not organic selling The government shutdown created a temporary liquidity vacuum Zero signs of euphoria anywhere in the market Institutional holders and whales are accumulating The chart structure shows mid-cycle correction , not cycle top Sometimes, the best opportunities come when: Everyone is bearish The crowd has capitulated Fear is at its peak And the chart is quietly building the foundation for the next explosive leg This is not hopium. This is structure. This is the setup. The Golden Bull Run hasn't even started breathing yet. We're not at the end— we're at the reset point before the real parabolic phase. ──────────────────────────────────── 📌 Key Levels to Watch Support Levels: Primary Demand Zone: $98K - $104K (current position) Mid-Channel Support: $90K - $95K Critical Invalidation: $85k-$90K (weekly close) Breakout Levels: Ignition Point: $126K (previous ATH) Confirmation: $130K (weekly close above) Targets: Conservative: $150K - $160K (Q2 2025) Base Case: $170K - $180K (Q3 2025) Extended Cycle: $200K+ (Q4 2025 - Q2 2026) Timeline Checkpoints: End of November 2025: Reclaim $110K December 2025: Break $126K and establish new ATH Q1 2026: Parabolic acceleration phase and potential cycle peak(extended thesis) ──────────────────────────────────── 🎯 What Would Make Me Change My Mind? I will publicly update and reassess if: Weekly close below $85k-$90K (channel break) TGA remains elevated 4+ weeks after shutdown ends Institutional ETF outflows persist through December RSI breaks and holds below 40 Fear & Greed stays below 30 through Q1 2026 Failure to reclaim $110K by November 31, 2025 I'm bullish, but not blind. The market will tell us if the thesis breaks. ──────────────────────────────────── 🔚 Bottom Line This bull market isn't slowing down—it's resetting for the real parabolic phase. BTC is gearing up for expansion, and alts will follow with the delayed but inevitable altseason wave. This next 12-18 months is where: Generational wealth is made or missed The real euphoria begins The masses FOMO in—not out The chart finally looks like a bull market Don't let October's liquidation event fool you into thinking this is over. The chart says accumulation. The structure says intact. The liquidity says temporary. The sentiment says despair. That's not a bear market— that's the setup for the next leg. 🐂🔥 ──────────────────────────────────── Not financial advice. This is my personal analysis based on current data. Markets are unpredictable. Trade responsibly. Manage your risk. Do your own research. If you found this analysis valuable, feel free to boost/share. Let's see who's still standing when BITCOIN crosses $150K. ────────────────────────────────────
niclaxfx
بیت کوین مرده نیست! راز انفجار بزرگ بعدی و شروع سیزن آلتکوینها
همه چیز قبل از انفجار: پای بعدی بیت کوین و موج آلتسسون ورودی یک بار دیگر من هستم همه در در BITCOIN و چند ALTS انتخاب شده. بازار گاو نر نه تمام 🔥Altseason حتی شروع به گرم کردن نکرده است و اینطور نیست هوپیوم ... اینجاست حقیقت کلان خام نمودار فریاد می زند: BTCUSD داخل اتاق تمیز نشسته است منطقه تقاضای کلان هنوز در کانال صعودی که هر major پا از این چرخه را حمل کرده است، سوار می شوید بدون بالا. بدون خرابی بدون ضعف این است موقعیت یابی ، نه خستگی ⏱ ساختار چرخه: • هر پایه گسترش: 14-15 هفته 📈 • هر اصلاح: 16-18 هفته 📉 ما در حال خروج از پنجره تصحیح (پایان در 10 نوامبر🗓️) → وارد فاز توسعه بعدی هستیم. 📊 آنچه نمودار تایید می کند: • کانال بلندمدت از ژانویه 2024 هنوز دست نخورده → روند به شش رقم اشاره دارد. • منطقه تقاضای هفتگی به صورت کنترل شده عمل می کند انباشت مجدد ، نه توزیع • ماشه پاک: شکستن بالا 126 هزار دلار → احتراق ماکرو. • نشست هفتگی RSI پشتیبانی پایه ⚫ → همان سطحی که قبل از هر major پا به بالا بود. • هدف بازه زمانی بالا برای این چرخه همچنان 150 تا 170 هزار دلار → سهموی تا 220k+ 🎯 • نمایه حجم را نشان می دهد انباشت توزیع نیست 🎯 📝 سناریوها: 1️⃣ بلاست آف مستقیم 🚀 منطقه تقاضا باقی می ماند → شکست 126 هزار دلاری → ATH جدید → روند شتاب می گیرد 160 تا 170 هزار دلار 2️⃣ فلاش دستکاری 🩸 فتیله زیر تقاضا (خراش فلاش تا 90 هزار دلار) → ضربه زدن به کانال میانی → بازپس گیری خشونت آمیز → همان هدف نهایی. ❌ باطل شدن: فقط یک بسته هفتگی زیر کانال ساختار را می کشد. هیچ چیز دیگری مهم نیست. ✅ خط آخر: این بازار گاوی سرد نیست، در حال بارگیری مجدد است . Bitcoin برای موج گسترش بعدی خود آماده می شود، و alts با تاخیر، خشونت، اجتناب ناپذیر دنبال می شود فصل دوم این مرحله بعدی جایی است که ورودی های نسلی پرداخت یا پشیمان شوید سهام من در جریان است BITCOIN مال شما کجاست؟ سلب مسئولیت: این تحلیل فقط برای اهداف آموزشی است و نباید به عنوان توصیه مالی در نظر گرفته شود. عملکرد گذشته نتایج آینده را تضمین نمی کند. همیشه قبل از تصمیمگیری برای سرمایهگذاری، تحقیقات خود را انجام دهید و با متخصصان مالی مشورت کنید. بازههای زمانی پایینتر (H8/H4) یک دوتایی تمیز را نشان میدهد که کاملاً با پایان اصلاحات 16 هفتهای در کلان مطابقت دارد. اگر این ساختار تا آخر هفته (10 نوامبر) شکسته شود، احتمالاً شروع یک ضربه 5 موجی الیوت را به سمت بالا آغاز می کند. اینجا را از نزدیک تماشا میکنید — هفته جالبی در پیش است✌🏾.
niclaxfx
سقوط آزاد طلا (XAU/USD): آیا حمایت حیاتی 3986 دلار شکسته میشود؟
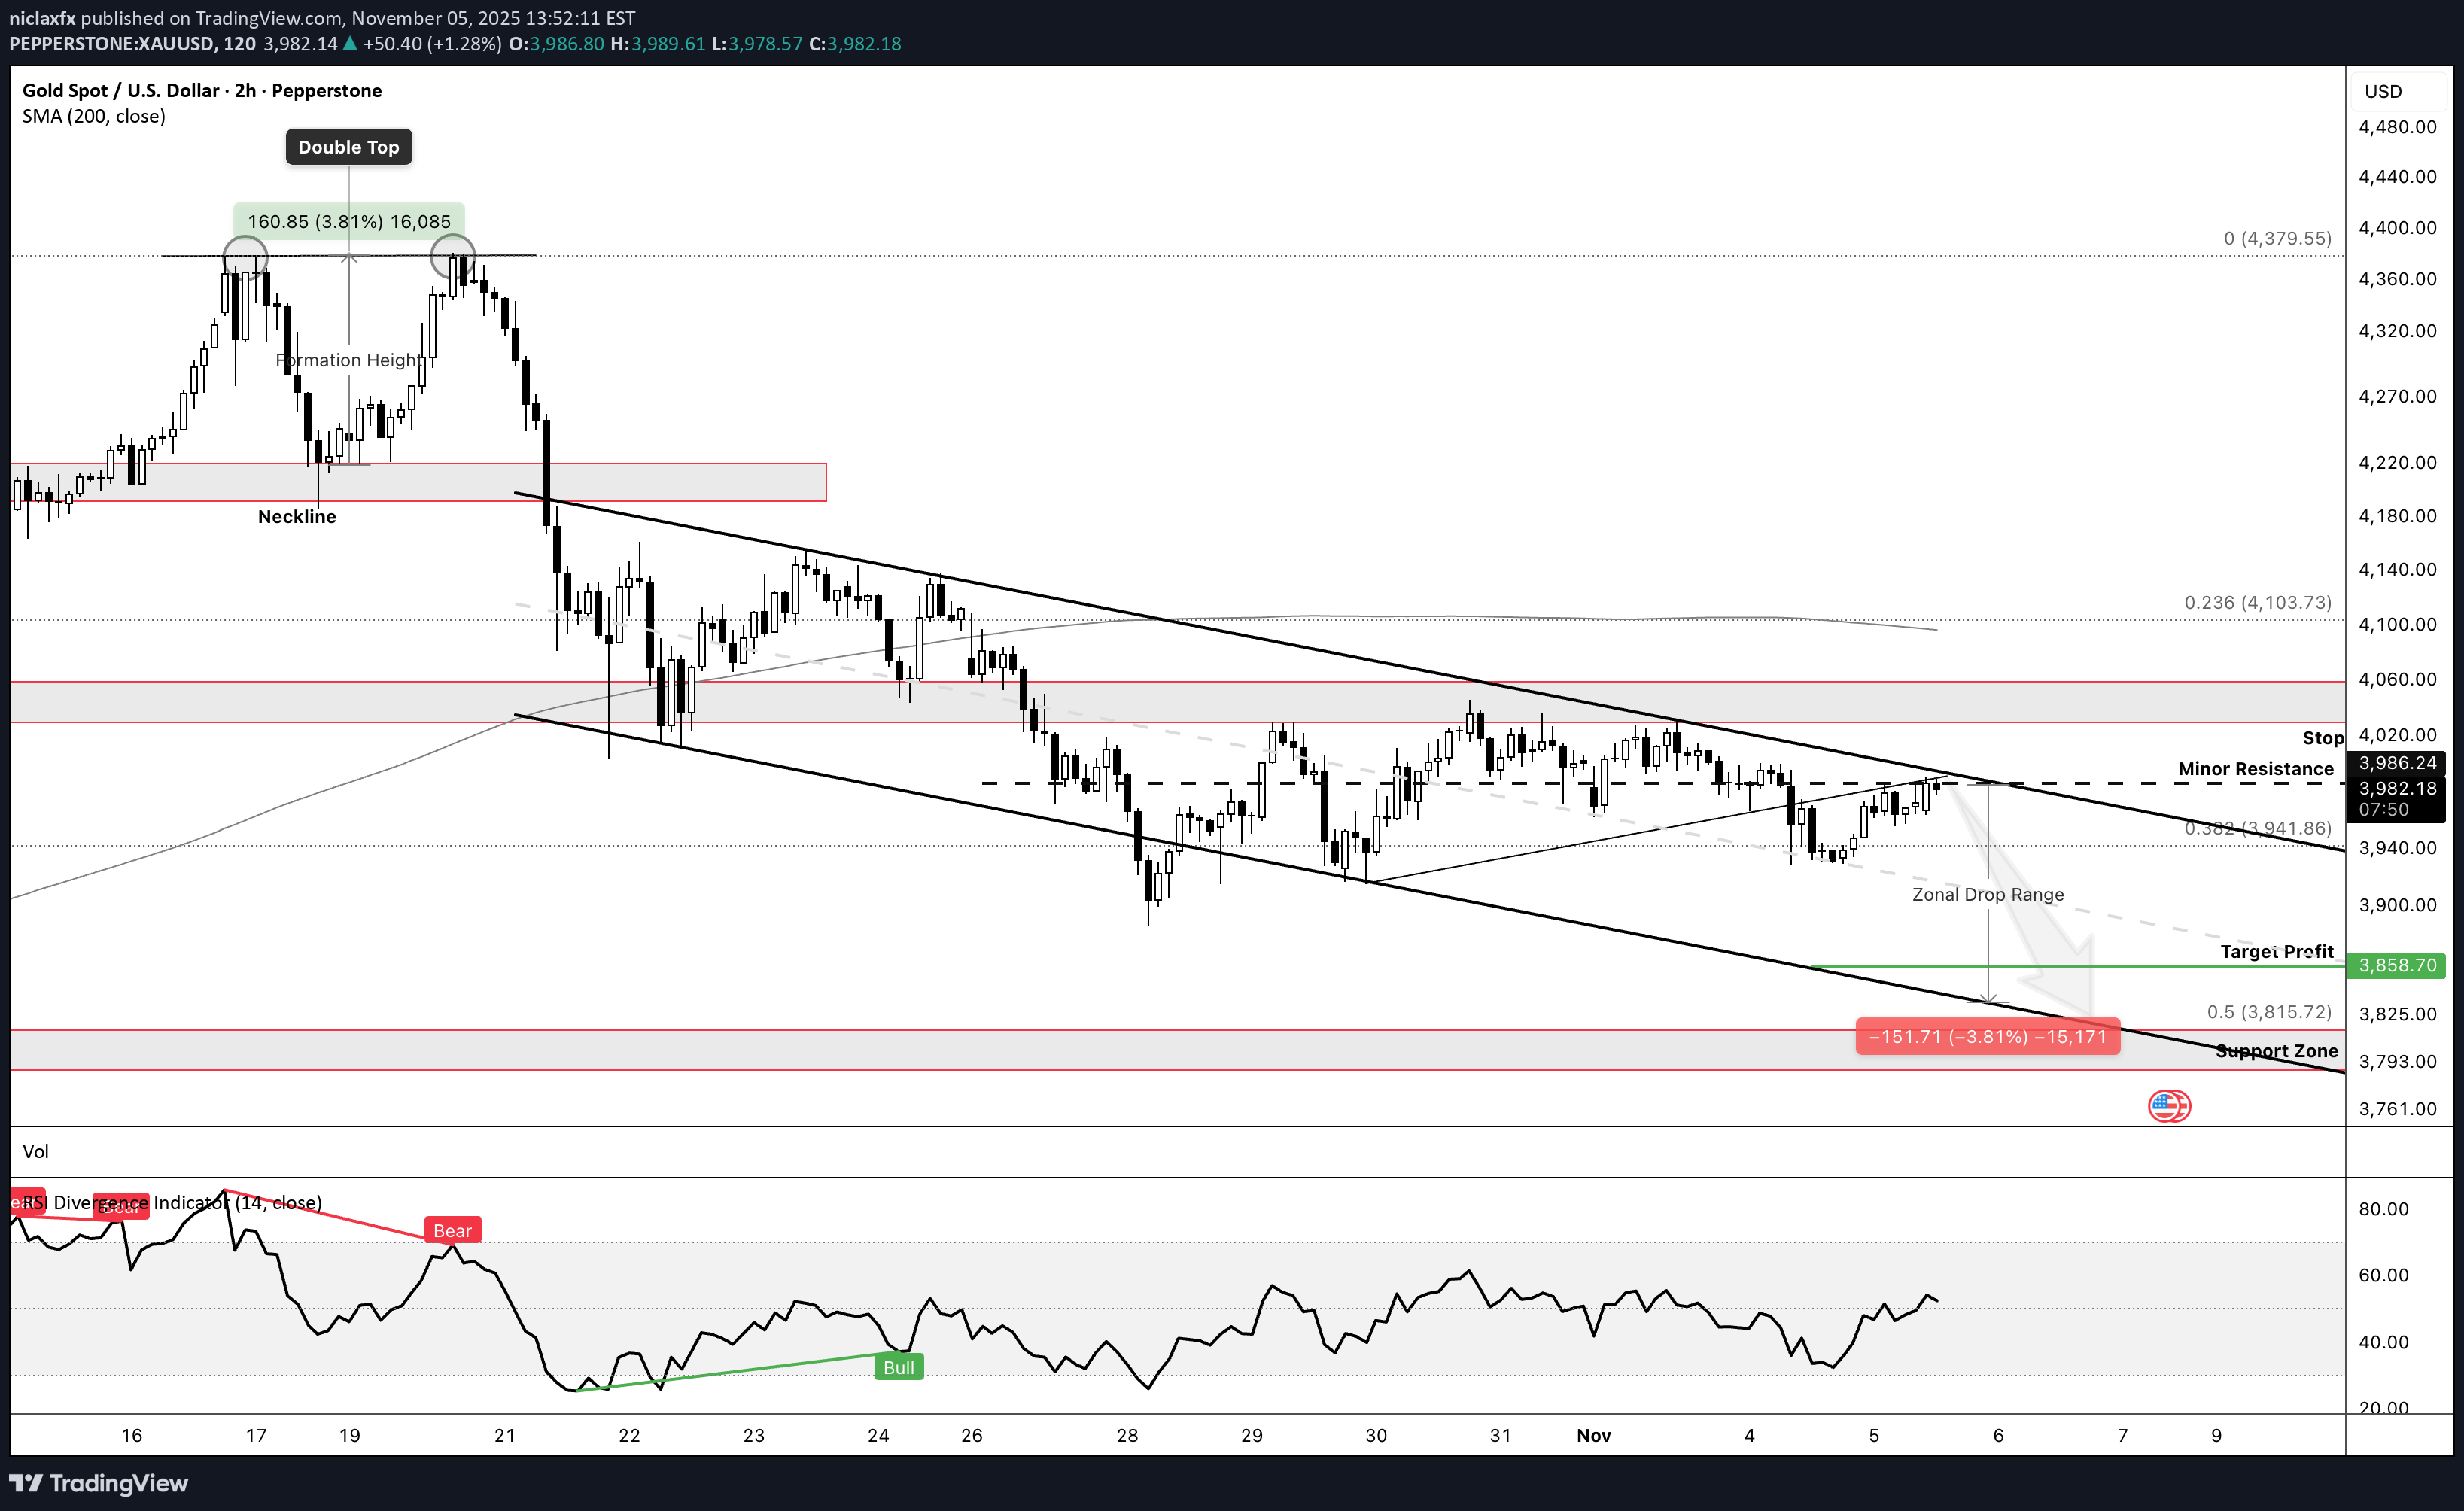
طلا در ۴,۳۸۰ دلار یک سقف سنگین زد و خط گردن (Neckline) در حوالی ۴,۲۰۰ تا ۴,۱۹۰ دلار شکسته شد — یک الگوی کلاسیک سقف دوقلو (Double Top). از آن زمان، قیمت درون یک کانال نزولی به شدت در حال ریزش بوده و هر حرکت صعودی (پولبک) زیر فشار از بین رفته است. ۳,۹۸۶ دلار خط نبرد است ⚔️ — تا زمانی که قیمت زیر این سطح باقی بماند، خرسها (فروشندگان) کنترل کامل بازار را در دست دارند. ما همچنان در محدوده ریزش منطقهای (Zonal Drop Range) بین ۳,۹۸۶ تا ۳,۸۲۵ دلار در حال معامله هستیم — جایی که فروشندگان هر حرکت صعودی را سرکوب میکنند. 🎯 اهداف: TP1 ← ۲,۹۲۰ دلار (فیبوی ۳۸.۲٪) TP2 ← ۳,۸۵۸ دلار TP2 ← ۳,۷۹۰–۳,۷۶۰ دلار (منطقه حمایتی) 🧠 سناریوی معاملاتی: ورود به پوزیشن فروش در رد شدنها (ریجکشنها) بین ۳,۹۸۰ تا ۳,۹۹۰ دلار. حد ضرر (Stop) بالای ۴,۰۴۰ دلار — هر بسته شدن بالای این سطح، سناریوی فروش را باطل کرده و فضا را برای صعود مجدد به سمت ۴,۱۰۳ تا ۴,۱۶۰ دلار باز میکند. 📉 شاخص RSI: خنثی تا نزولی در حدود ۵۱. 📊 حجم معاملات: در حال کاهش است = شرایط فشار بالا (دیگ زودپز) قبل از ریزش بعدی. تا زمانی که خریداران (گاوها) ۴,۰۴۰ دلار را پس نگیرند، من فقط به دنبال پوزیشنهای فروش (شورت) هستم. زیر ۳,۹۸۶ دلار، انتظار شتابگیری داشته باشید — خلأ نقدینگی (Liquidity Vacuum) به سمت ۳,۸۵۸ دلار، و شاید یک سقوط کامل تا ۳,۷۹۰ دلار. هوشیار و صبور بمانید 💚.
niclaxfx
ریتم مخفی بیت کوین: پیشبینی مسیر صعودی تا ۱۶۰ هزار دلار (۱۲۰ هزار کلید است!)

Bitcoin در ریتم حرکت می کند - نه تصادفی ، نه بی پروا ، بلکه هارمونیک. هر Rise and Retrace مانند یک ملودی از تاریخ خود بازی می کند ، و یک بار دیگر ، نمودار آن لحن آشنا است. بعد از ضربه زدن 126k ، قیمت پس گرفته شده ، آزمایش شده پشتیبانی 120k با و تمیز و تمیز - علامت ریتم هنوز دست نخورده است. در منطقه Ath -SR (120k -124k) اکنون به عنوان محوری عمل می کند ، جایی که حرکت برای آنچه می تواند یک محفظه دیگر نوامبر باشد ایجاد می کند. بالاتر از این محدوده ، یادداشت های بعدی در 138K ، 147K ، و احتمالاً 160k+ اگر سرعت مانند نوامبر '24 -DEC '24 ، اکنون اکتبر '25 - Nov '25 جریان دارد. اما اگر این ضرب و شتم شکسته شود ، 108K پایه ریتم است. BTCUSD فقط move قیمت نیست - در الگوهای حرکت می کند. به ریتم گوش دهید ، نه سر و صدا. - کلاوس | NFX HUB ----------------------------- حتی در زمان های بحرانی - خوب است که کمی بازی کنید ... tl ؛ dr: 🟠 120k -124k منطقه محوری است. 📈 بالاتر از اهداف را در 138K ، 147K ، 160K+نگه دارید. 📉 شکستن زیر = 108k دوباره آزمایش. 📆 الگوی قافیه با نوامبر '24 ، اما انعطاف پذیر باقی بمانید. Trade Target بسته به 108 می رسد که ما منتظر وارونگی هستیم.
niclaxfx
بیت کوین در 123 هزار دلار: آیا گاوها یا خرسها پیروز میشوند؟ راز مقاومت سهگانه فاش شد!

قیمت اکنون ناحیه مقاومت ۱۲۳ هزار را سه بار آزمایش کرده است. در سومین تلاش، شاهد یک شکست سطحی (Shallow Breakout) بودیم که به جای رد شدن (Rejection)، نشانهای از جذب (Absorption) است؛ این امر حاکی از آن است که قدرت فروشندگان در حال تحلیل رفتن است (قبلاً خودم هم جزو فروشندگان بودم، خندهدار است). اکنون، تمام توجهات معطوف به آزمایش مجدد (Retest) سطح ۱۲۳ هزار است – نقطه محوری تعیینکنندهای که همهچیز به آن بستگی دارد. اگر این سطح به حمایت تبدیل شود، گاوها (خریداران) میتوانند قیمت را به سمت اکستنشن فیبوناچی بعدی در ۱۲۹,۷۰۰ برانند. اما اگر این سطح از دست برود، به احتمال زیاد به ناحیه پایه ۱۱۷ هزار تا ۱۱۸,۵۰۰ باز گشت. سطوح کلیدی 🔴 ناحیه مقاومت: ۱۲۲,۵۰۰ – ۱۲۴,۵۰۰ 🟢 هدف: ۱۲۹,۷۰۰ (اکستنشن فیب ۱.۲۷۲) ⛔️ ابطال تحلیل: زیر ۱۲۲,۰۰۰ 🔵 حمایت پایه: ۱۱۷,۰۰۰ – ۱۱۸,۵۰۰ 📝 تز تحلیل: آزمایشهای سه گانه معمولاً نواحی عرضه را تضعیف میکنند. شکست سطحی نشاندهنده انباشت (Accumulation) است نه فرسودگی. تأییدیه زمانی به دست میآید که خریداران از سطح ۱۲۳ هزار دفاع کنند؛ عدم توانایی در حفظ این سطح، شتاب (مومنتوم) را مجدداً به سمت نزول بازمیگرداند. خلاصه کلام: آزمایش سهگانه مقاومت ← شکست سطحی ← ریتست در جریان است. ۱۲۳ هزار نقطه محوری است. حفظ شدن = ۱۲۹,۷۰۰. شکست = بازگشت به پایه. ⚠️ نکته ریسک: مراقب فیک اوتها (شکستهای کاذب) در حوالی رویدادهای کلان اقتصادی باشید. حجم معاملات و ساختار بسته شدن کندلها واقعیت ماجرا را نشان داد.
niclaxfx
طلا در منطقه حساس: تصمیم سرنوشتساز هفته آینده برای قیمت چیست؟

طلا ساختار صعودی چشمگیر خود را ادامه می دهد ، و به طور تمیز در تمام مناطق مقاومت قبلی صعود می کند. هر مرحله انبساط اندازه گیری شده و سازگار است - متناوب بین پاهای تکانشی 1.7 ~ و انبارهای اصلاحی 4.4 ~ ، یک رفتار قیمت ریتمیک تشکیل می دهد که منعکس کننده نهادی کنترل شده flow به جای نوسانات خرده فروشی است. قیمت اکنون در منطقه 4 کار می کند و به هدف مقاومت 3،987 دلار 3،990 دلار نزدیک می شود. این سطح با مرز بالایی دامنه انبساط فعلی هماهنگ است و آن را به یک نقطه تصمیم گیری مهم تبدیل می کند. اگر قیمت از همان ریتم تاریخی مشاهده شده در ماه سپتامبر پیروی کند ، احتمال بالایی وجود دارد ، ما شاهد شیر 3،987 دلار بود و پس از هرگونه تلاش ادامه ، به دنبال 3،914 دلار (پشتیبانی منطقه). با این حال ، توجه به این نکته حائز اهمیت است که ما در حال حاضر در مرحله خاموشی هستیم ، بدون ملموس U. S. اقتصادی data به محکومیت جهت گیری سوخت می شود. این بدان معنی است که در اینجا حرکت تا حد زیادی از نظر فنی محور است و می تواند مرحله نهایی طلا را قبل از تغییر روند وسیع تر نشان دهد. نکته اصلی: تعصب اولیه: ادامه صعودی معتبر است در حالی که بالاتر از 3،900 دلار پشتیبانی است. من انتظار دارم که قیمت به 3987 برسد و سپس در صورت تکرار مجدد انباشت مجدد به 3914 بازگردد. حجم همچنان به جای FOMO دیررس ، تجمع انضباطی سیگنالینگ باقی مانده است - سیگنالینگ. نتیجه گیری: طلا ساختار دست نخورده باقی مانده است ، اما بازار در حال ورود به منطقه تصمیم گیری است. move بعدی از اینجا در پنجره 24-48 ساعت ، به احتمال زیاد تعیین می کند که آیا ما شاهد یک پسوند نهایی هستیم یا شروع یک اصلاح عمیق تر. در صورت پیروی از این تجارت ، نظرات خود را در زیر به اشتراک بگذارید.
niclaxfx
ریزش بیت کوین در راه است؟ تحلیل فنی و ماکرو که نباید نادیده گرفت!

thiss: فقط یک کوتاه وارد شد BTCUSD بر اساس تلاقی سیگنال های فنی و کلان. این فقط مربوط به RSI Overbought نیست - این مربوط به خطر نامتقارن ، ساختار صعودی فریبنده است و یک شرکت نزولی وسیع تر که اکثر معامله گران از آن چشم پوشی می کنند. 📉 خرابی تنظیم RSI (H4): 85.12 - بسیار بیش از حد. از نظر تاریخی ، این منطقه باعث عقب نشینی های شدید شده است. قله های قبلی RSI "خرس" را در نمودار نشان می دهد که الگوی را تأیید می کند (ژوئیه ، اوت 2025). ساختار نمودار: افزایش گوه به منطقه مقاومت به Stroge + 78.6 سطح فیبر. عمل قیمت خسته به نظر می رسد ، و حجم در حال محو شدن است. تعصب کلان: با وجود حرکت صعودی محلی ، روند وسیع تر همچنان نزولی است. گسترش اعتبار در حال گسترش است و نقدینگی کلان در حال سفت شدن است. لحن خطر در حال خزیدن است. profile مشخصات RR: ATH فقط 4K $ بالاتر است. اهداف نزولی مناطق پاداش تمیزتر را با بی اعتبار تر بودن ارائه می دهد. توقف درست در بالای منطقه Str. 🎯 پارامترهای تجارت ✅ ورود: نزدیک منطقه مقاومت در برابر خیابان ⛔ توقف: بالاتر از خط روند فوقانی / منطقه STR 🟠 هدف 1: پشتیبانی از کانال میانی 🟢 هدف 2: منطقه تلاقی فیبر پایین 🧠 روکش کلان U. S. گسترش اعتبار در حال گسترش است (شاخص HY در 2.75 ٪ ، CDS در حال افزایش است). خطر خاموش شدن دولت در حال افزایش است. FED در حالت مدیریت ریسک قرار دارد - هنوز وحشت نیست ، اما لحن در حال تغییر است. اکتبر از نظر تاریخی بی ثبات است (به آنالوگ های 2008 مراجعه کنید) - برای استرس نقدینگی تماشا کنید. ⚠ tl ؛ dr کوتاه سازی BTCUSD در اینجا فقط فنی نیست - استراتژیک است. Overbought RSI + WEARISH WEDGE + استرس کلان = تنظیم نامتقارن. ریسک محصور شده است ، پاداش تمیز است. بیایید ببینیم که چگونه آن را بازی می کند. منطقه مقاومت به شدت رد شد - تماشای دیدن اینکه در کجا شمع بسته می شود ، تأیید بسیار مهمی از روایت بازار خرس یا بی اعتبار بودن آن بود. به تأخیر افتاد ، رد نشد. عملکرد قیمت پنجره زمان بندی را دراز کرده است ، اما ساختار کلان مایع دست نخورده باقی مانده است. برای حل این پایان نامه ، ما به یک نزدیک روزانه زیر 119K دلار نیاز داریم - این خط در sand است. 🟠 بالاتر از 119K $: قدرت بازتابنده ، صبر تاکتیکی و مجدداً نوسانات 🟢 زیر 119K $: پایان نامه تجدید نظر ، تعصب توزیع تأیید شده ، اهداف نزولی بازگشایی شد تا آن زمان ، ما تنش روایی داریم. تنظیم هنوز زنده است-فقط در انتظار قیمت برای همکاری رد نشد - قیمت از طریق منطقه مقاومت شکسته شد و پایان نامه کوتاه را باطل کرد. از همه نظرات و بازخورد ها قدردانی کنید - همیشه در پالایش لنزها ارزشمند است. در حال حاضر ، من انتظار دارم که movement و حرکت بازتابی را مشاهده کنم. هنگامی که ساختار خود را دوباره یا نشانه های خستگی دوباره ظاهر می شود ، دوباره ارزیابی می شود. در غیر این صورت ، تجمع صعودی ادامه دارد. Momentum از ادامه تا زمانی که در غیر این صورت اثبات شود ، طرفداری می کند. تماشای علائم بیش از حد یا واگرایی ، اما احترام به استحکام تا زمانی که نوار در غیر این صورت می گوید.
سلب مسئولیت
هر محتوا و مطالب مندرج در سایت و کانالهای رسمی ارتباطی سهمتو، جمعبندی نظرات و تحلیلهای شخصی و غیر تعهد آور بوده و هیچگونه توصیهای مبنی بر خرید، فروش، ورود و یا خروج از بازارهای مالی نمی باشد. همچنین کلیه اخبار و تحلیلهای مندرج در سایت و کانالها، صرفا بازنشر اطلاعات از منابع رسمی و غیر رسمی داخلی و خارجی است و بدیهی است استفاده کنندگان محتوای مذکور، مسئول پیگیری و حصول اطمینان از اصالت و درستی مطالب هستند. از این رو ضمن سلب مسئولیت اعلام میدارد مسئولیت هرنوع تصمیم گیری و اقدام و سود و زیان احتمالی در بازار سرمایه و ارز دیجیتال، با شخص معامله گر است.