
mycotoxin
@t_mycotoxin

تریدر چه نمادی را توصیه به خرید کرده؟
سابقه خرید
تخمین بازدهی ماه به ماه تریدر
پیام های تریدر
فیلتر
نوع پیام
mycotoxin
سیگنال خرید بیت کوین: هدفهای شوکهکننده ۱۰۷k و ۱۱۵k پس از الگوی خاص!
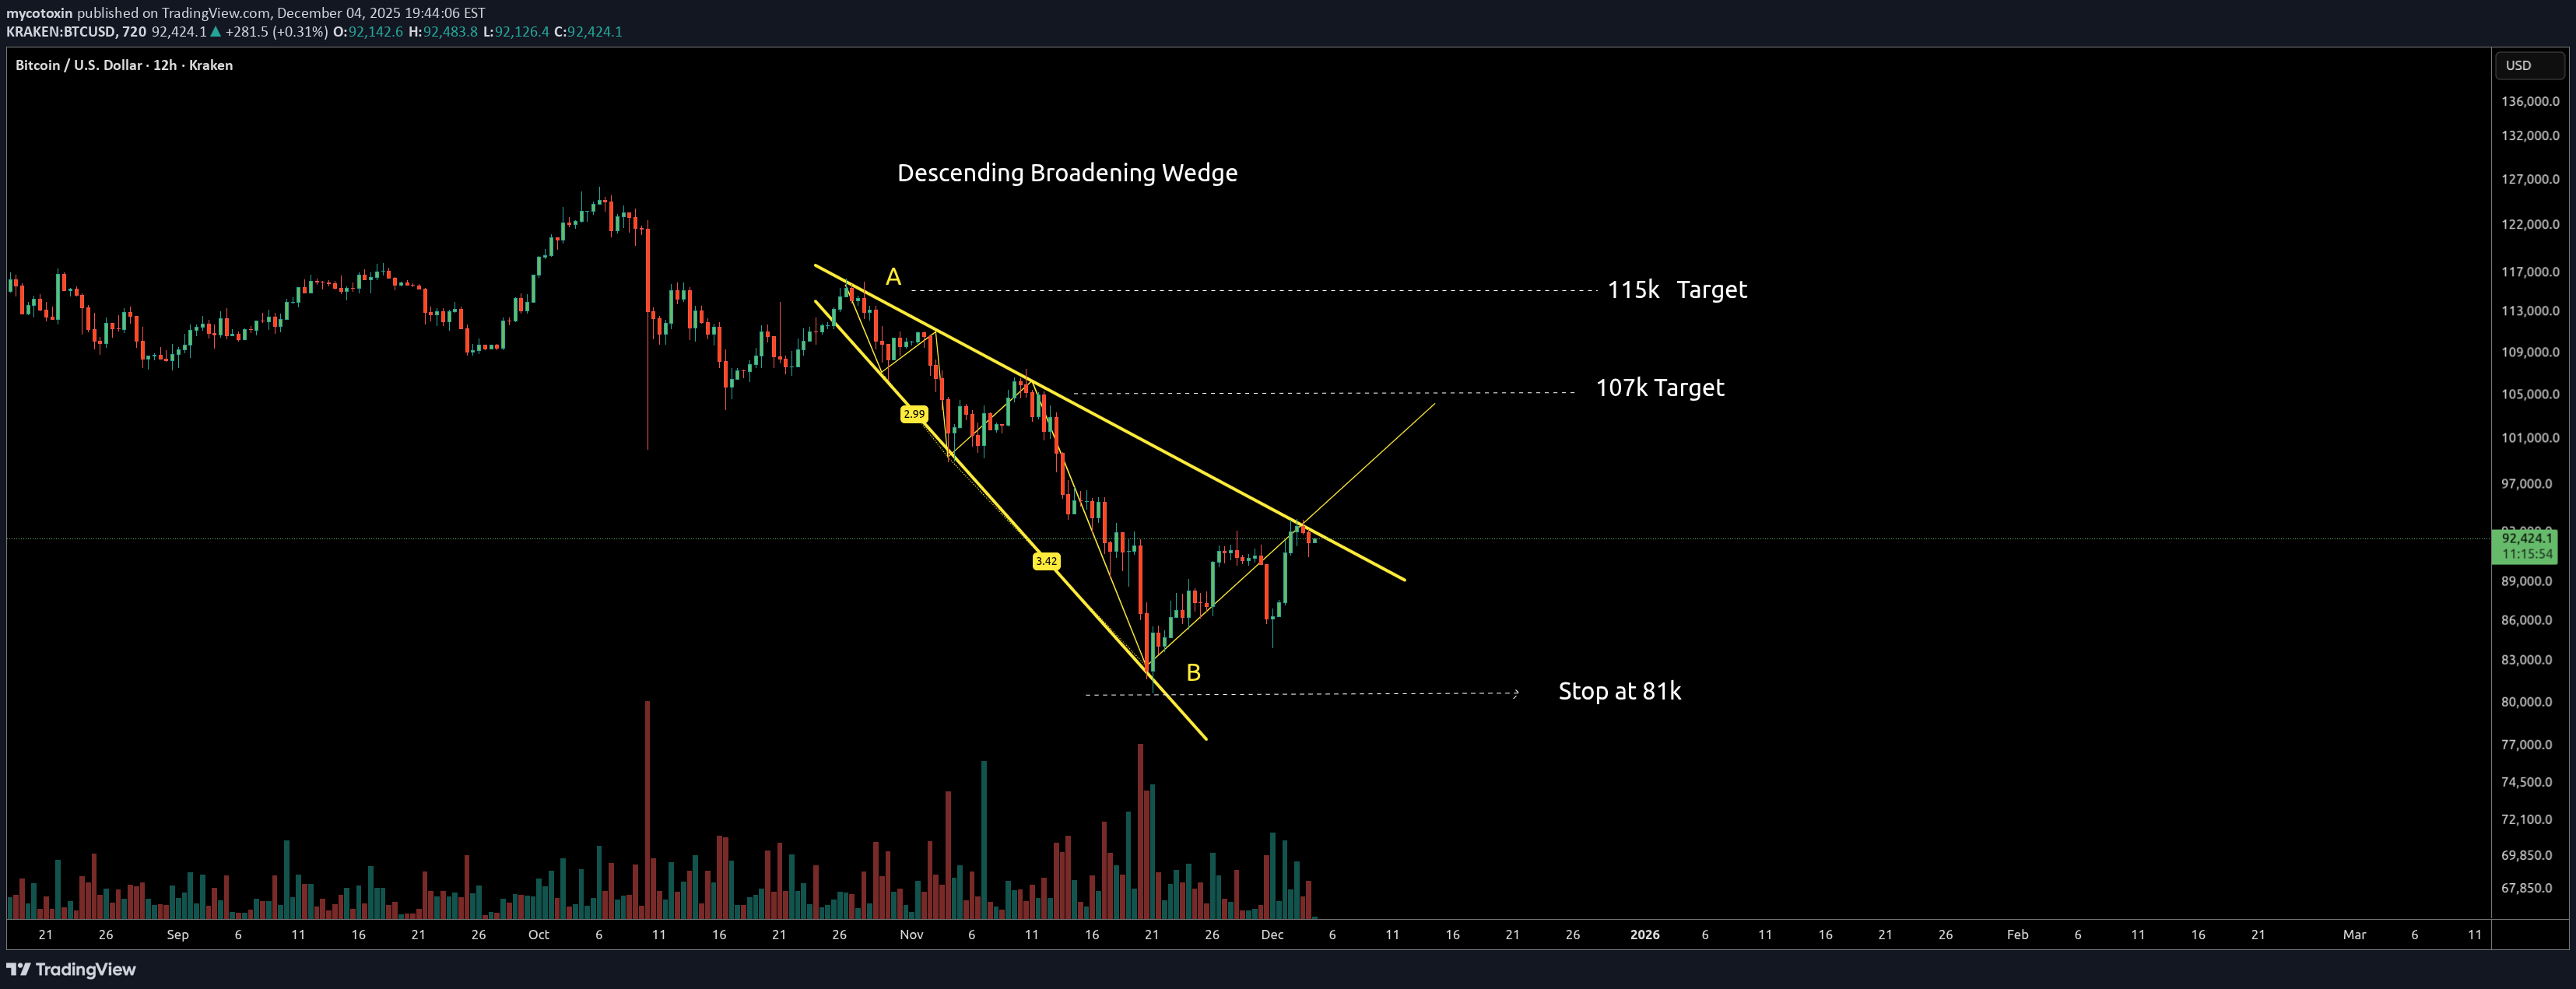
یک الگوی کنج انبساطی نزولی (Descending Broadening Wedge) در نمودار ۱۲ ساعته BTC قابل مشاهده است. این میتواند فرصت معاملاتی سریعی فراهم کند، زیرا این الگوها غالباً تمایل به شکست از سمت بالا دارند. این کنج نشاندهنده نوسانات قیمتیِ در حال گسترش با سقفهای پایینتر و کفهای پایینتر است. نقاط A و B محلی را نشان میدهند که قیمت مرزهای کنج را لمس کرده است. در حال حاضر، قیمت در حال آزمایش (تست) حمایت خط روند پایینی است. برنامه معاملاتی: حد ضرر: باید روی ۸۱ هزار (کف کنج) تنظیم شود. اگر قیمت به زیر این سطح شکسته شود، الگو باطل میشود. هدف اول: ۱۰۷ هزار هدف دوم: ۱۱۵ هزار (بالای کنج / هدف اندازهگیری شده move) نکاتی برای توجه: برای تأیید، منتظر شکست بالای خط روند بالایی باشید. در صورت شکست واقعی، حجم معاملات باید افزایش یابد. ۸۱ هزار یک حمایت حیاتی است – شکست قطعی زیر آن، این معامله را لغو میکند.
mycotoxin
سقف دوقلو در ZEC: هدف قیمتی ۲۷۳ کجاست؟
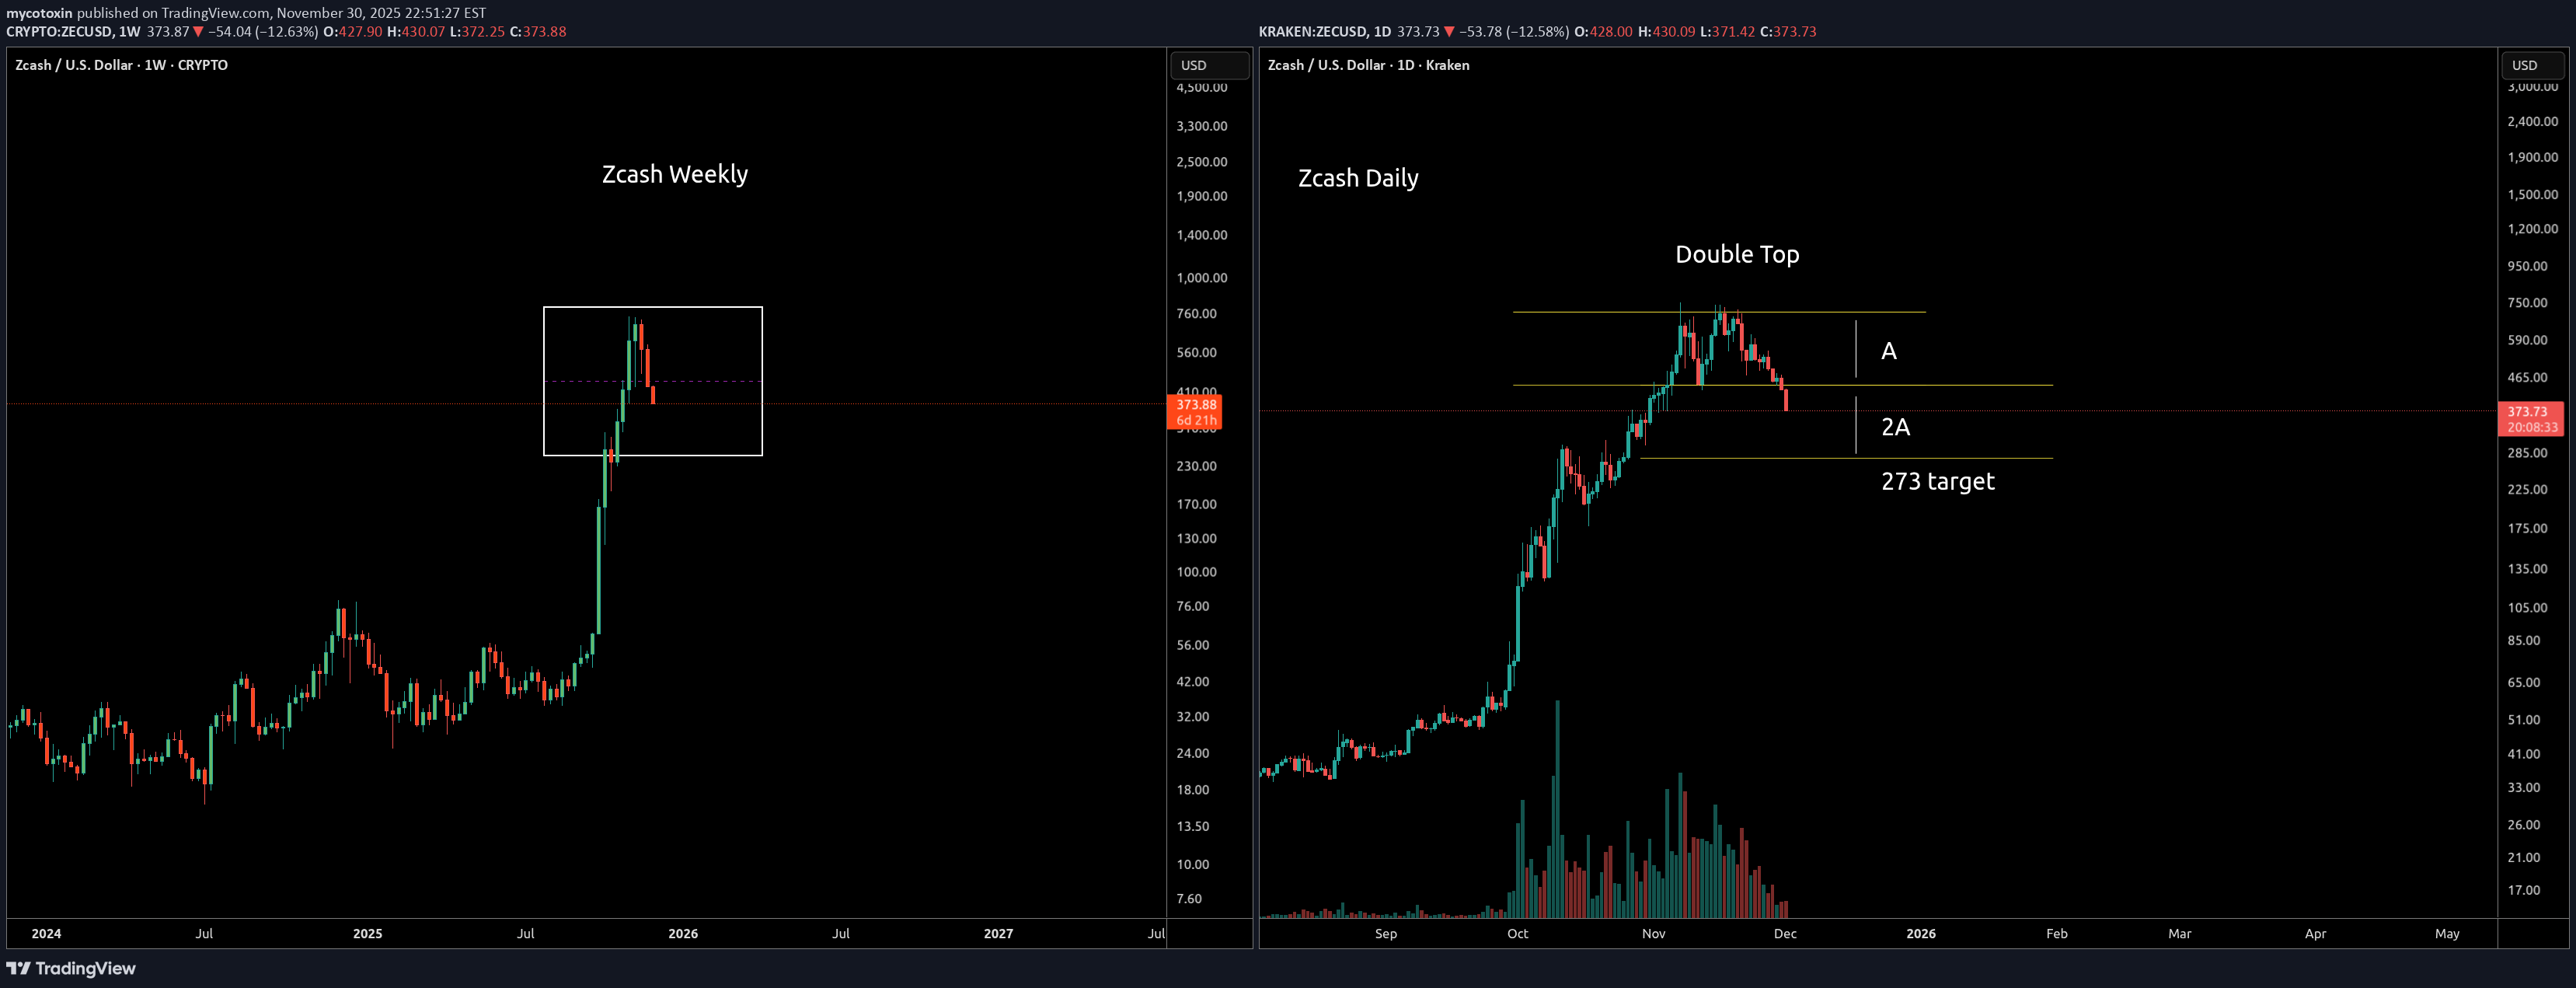
زوم کردن روی الگوی هفتگی یک تاپ دوتایی را در روز نشان می دهد. هدف برای سقف دوبل 2 برابر ارتفاع دوبل است. از این رو اگر فاصله نشان داده شده A باشد، هدف از بالا دو برابر A (2A) بود که تقریبا 273 است. فکر من این است که این بخشی از یک الگوی بزرگتر با هدف 10K است که پس از تکمیل ادغام چرا 10K؟ ============= زیرا نگاهی به سمت چپ بالای خط مقاومت نشان میدهد هیچ مقاومتی بعد از آن ناحیه وجود ندارد - مستقیم move بالا است. از این رو، همانطور که قیمت به سرعت از آن منطقه عبور کرد، من انتظار دارم زمانی که به بالای این منطقه برسد، به طور مشابه move سریع افزایش یابد.
mycotoxin
آیا زِدکش (ZEC) آماده جهش به ۱۲۰۰ دلار است؟ راز شکست مقاومت ۷۶۰ دلاری!
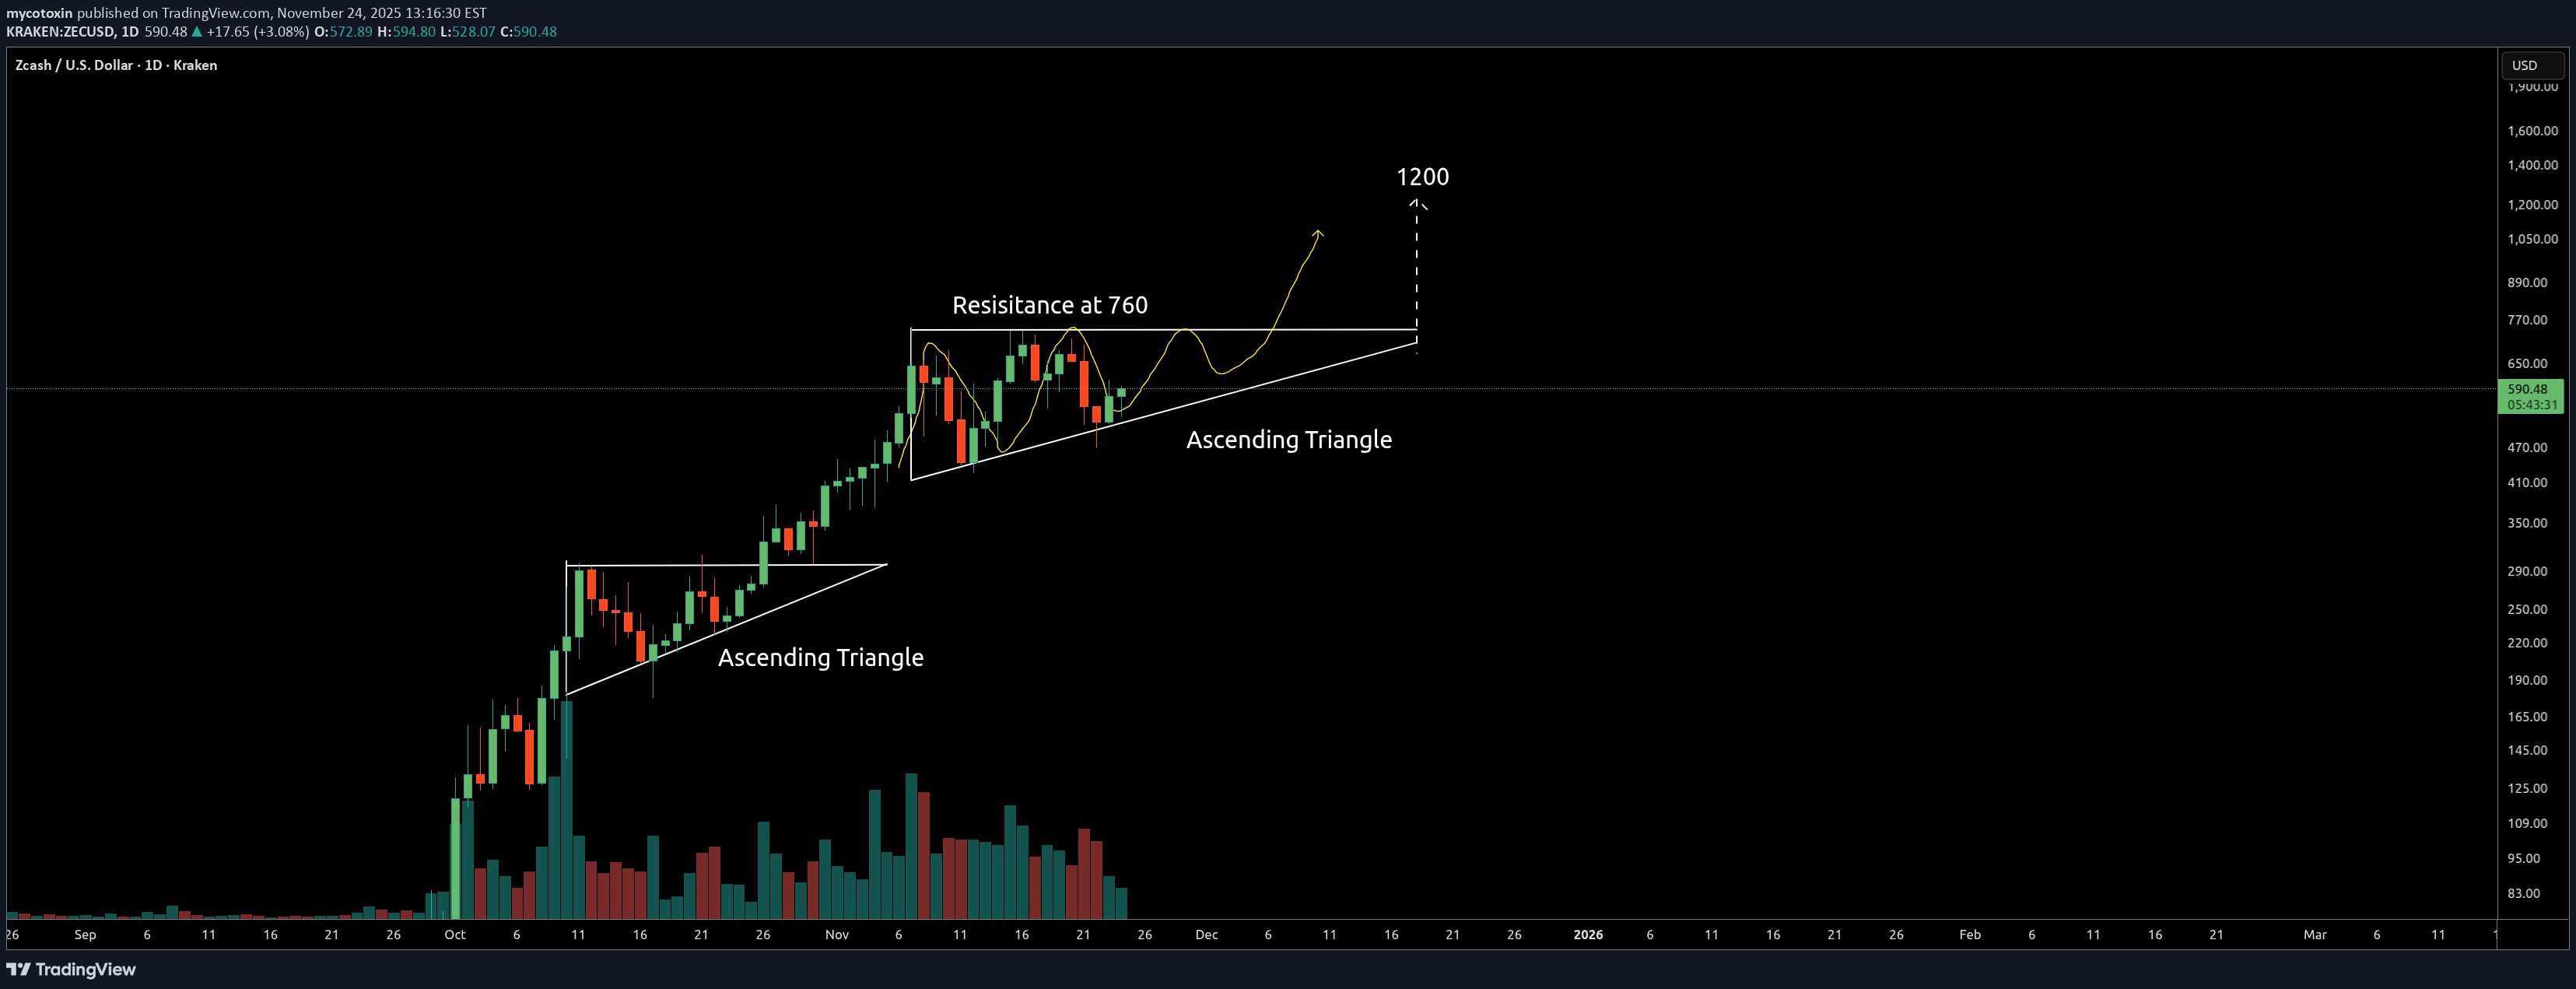
از روی نمودار، به نظر میرسد <۰> در حال تشکیل یک مثلث صعودی افزایشی (Bullish Ascending Triangle) در چارچوب زمانی روزانه است. یک مثلث صعودی افزایشی معمولاً پس از یک روند صعودی شکل میگیرد و ویژگی آن یک خط روند شیبدار در قسمت پایین است که توسط دو یا چند کف بالاتر (Higher Lows) متوالی تشکیل میشود. قسمت بالای این الگو با رسم یک خط افقی که دو یا چند سقف را به هم متصل میکند و یک سطح مقاومت ایجاد میکند، شکل میگیرد. در این مورد، مقاومت در محدوده ۷۶۰ دلار قرار دارد. برای اینکه مثلث صعودی با موفقیت تأیید شود، <۱> باید در داخل الگو باقی بماند و در تایم فریم روزانه بالاتر از مقاومت ۷۶۰ دلار بسته شود. یک شکست قاطع (Clean Break) بالاتر از ۷۶۰ دلار و به دنبال آن یک بازآزمایی (رتست) موفق، میتواند مسیر را برای حرکت <۲> به سمت محدوده ۱۲۰۰ دلار هموار کند. اگر این شکست تکمیل شود، انتظار دارم حدود هفته اول دسامبر اتفاق بیفتد. با این حال، اگر <۳> نتواند مقاومت ۷۶۰ دلار را بشکند، انتظار دارم شاهد حرکت <۴> به سمت حمایت در حدود ۴۰۰ دلار باشیم. حجم معاملات در اینجا حیاتی است؛ شکست بالای ۷۶۰ دلار باید با افزایش شدید حجم (Volume Spike) همراه باشد تا قاطعیت خریداران تأیید شود. بدون تأیید حجم، هر گونه حرکت <۵> در بالای مقاومت میتواند یک شکست کاذب (False Breakout) باشد. مثل همیشه موفق باشید. این صرفاً مشاهدات تحلیلی/فنی من است و توصیه مالی نیست؛ بنابراین، همیشه تحقیقات خود را خودتان انجام دهید (DYOR).
mycotoxin
کشف بزرگ بیت کوین کش (BCH): راز انباشت 8 ساله که همه نادیده گرفتهاند!
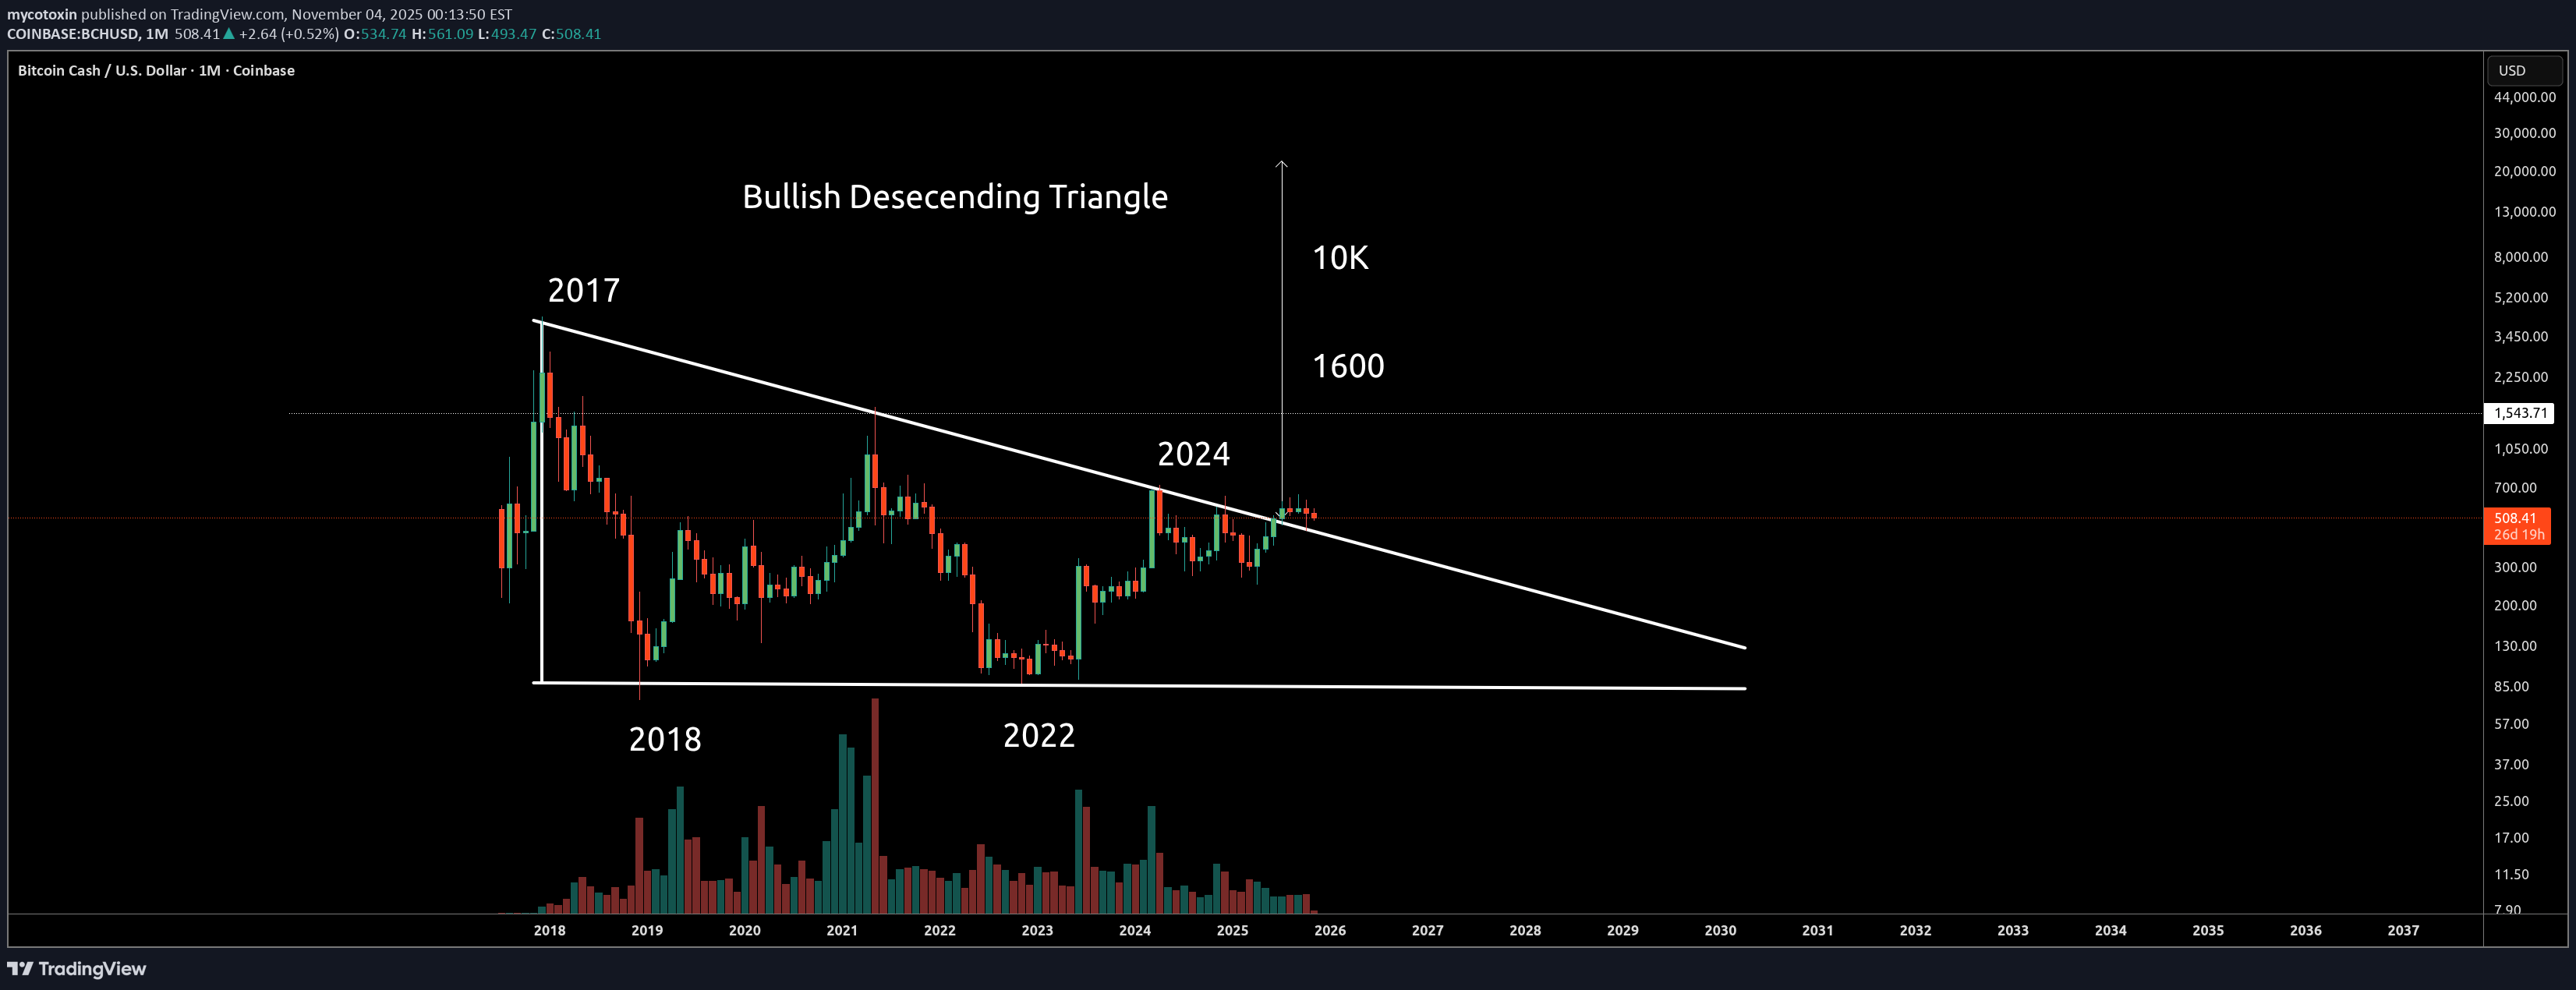
BCH نشانه بسیار محکمی است که اکثر مردم روی آن می خوابند. سریع است، عرضه کم دارد و کارمزد تراکنش بسیار ارزان است. BCH همچنین در مرحله انباشت 8 ساله است که به نظر می رسد در حال اتمام است. الگوی مثلث نزولی صعودی یک کتاب درسی است و به نظر می رسد اهداف بلند مدت در محدوده 1600 و 10k باشد. Id حتی تا آنجا پیش بروید که بگوییم BCH شگفتی move سال 2025/2026 بود. استراتژی ساده است: الف) خرید کنید ب) نگه دارید ج) آن را فراموش کنید د) بعد از چند ماه تا یک سال دوباره بررسی کنید و دوباره ارزیابی کنید من قطعا روی این یکی نمی خوابم الگوی انباشت 8 ساله دروغ نمی گوید - و هنگامی که این الگوها در نهایت ظاهر می شوند، با قدرت و سرعت قابل توجهی به move تمایل دارند.
mycotoxin
پامپ انفجاری XRP: خروج از مثلث و هدف ۶.۸ دلار! (فقط برای صبورها)
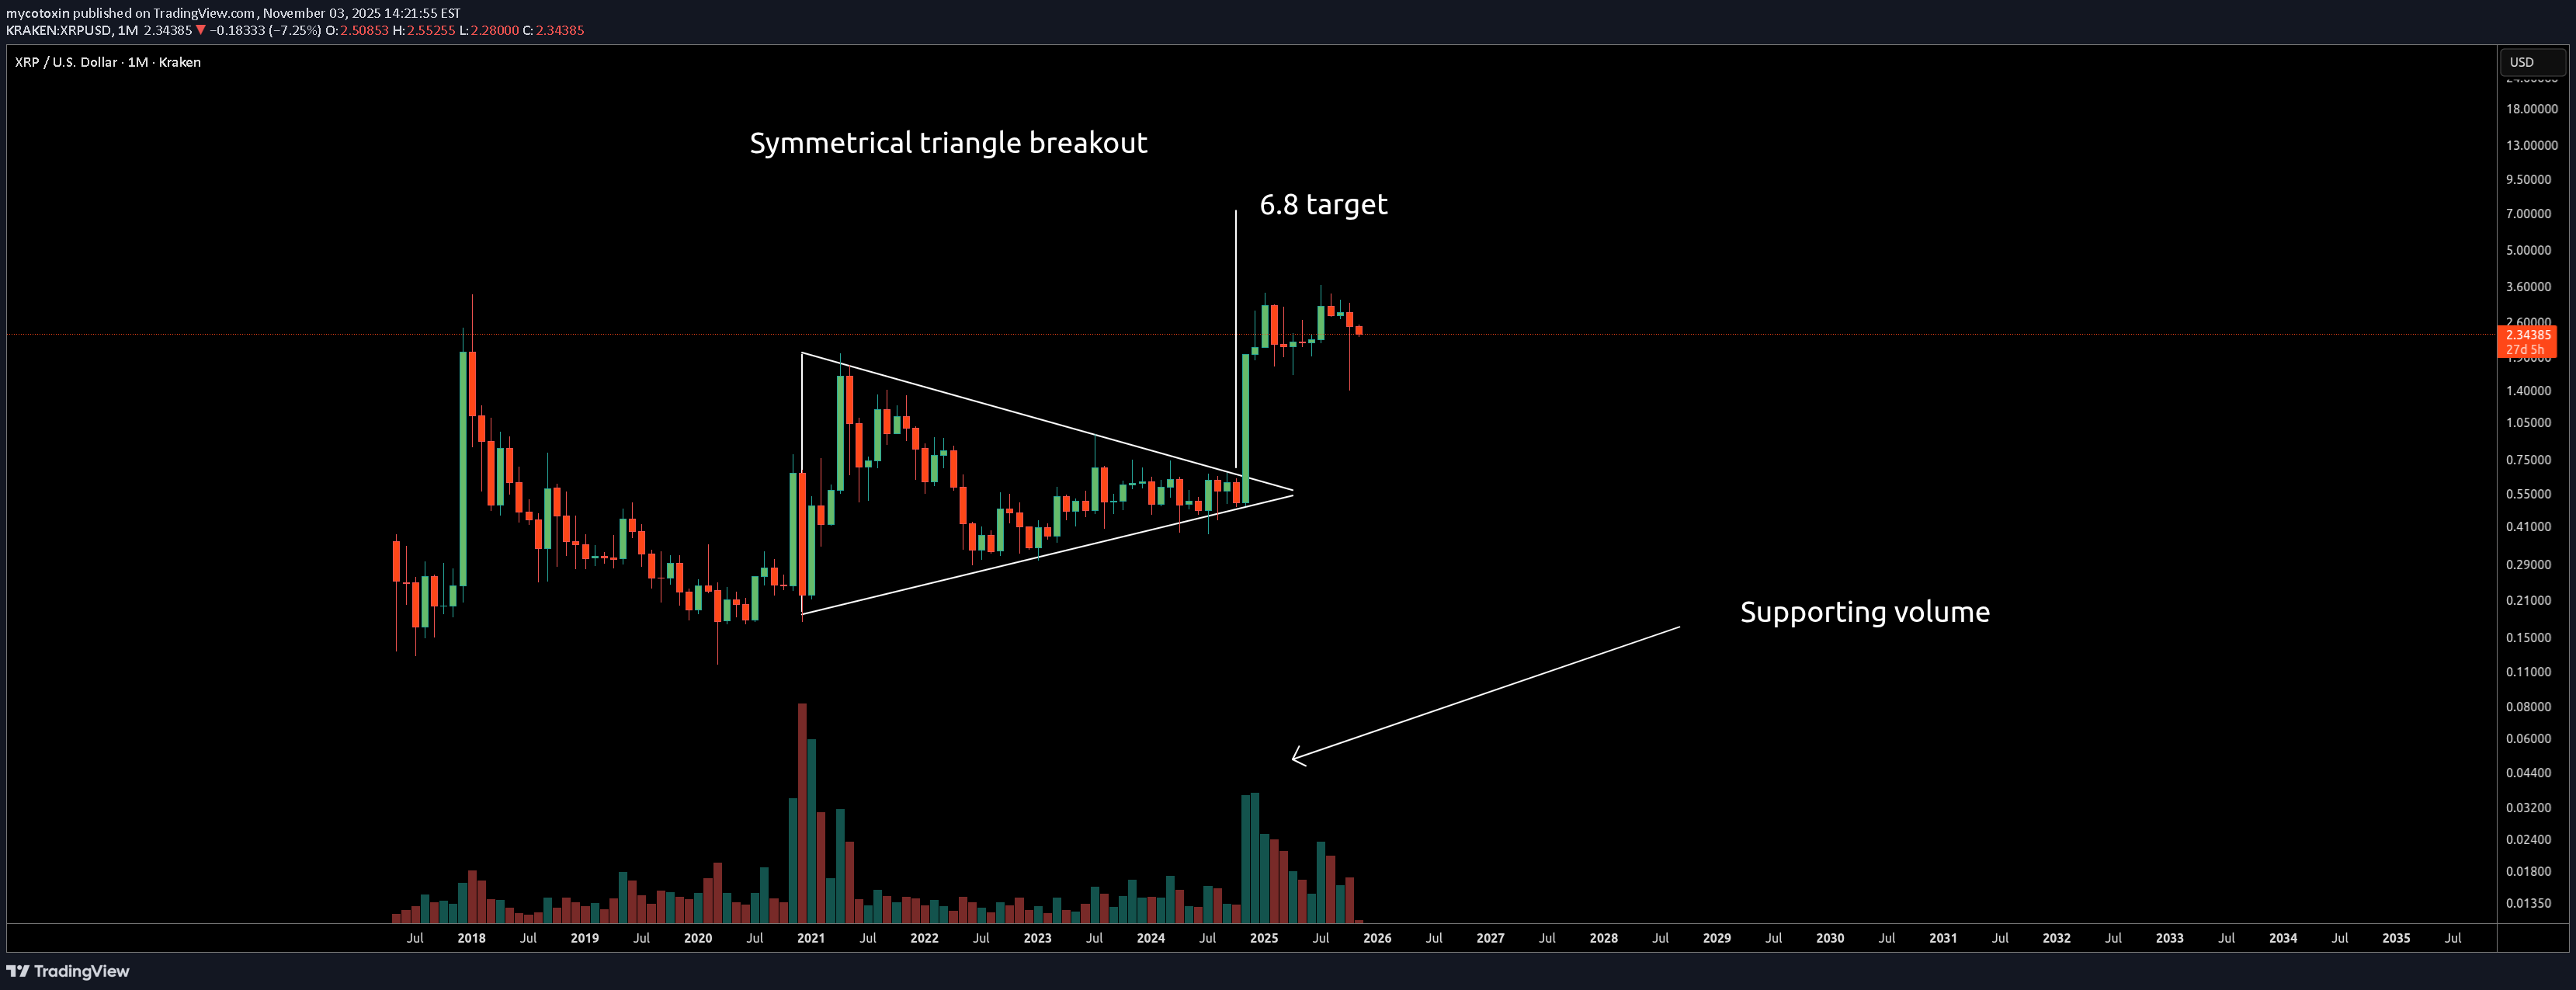
XRP به نظر می رسد که به تازگی از یک مثلث متقارن با حجم پشتیبان خارج شده است و به منطقه 6.8 دلاری نگاه می کند move. XRP منحصر به فرد است. این یکی از آن سکه هایی است که فقط کار خودش را می کند. XRP در آنجا می نشیند و مطلقاً هیچ کاری انجام نمی دهد، در حالی که بقیه بازار پمپ می کنند، سپس به طور تصادفی تصمیم می گیرید move را زمانی که کاملاً آن را فراموش کرده اید، انتخاب کنید. قطعا برای دست های ضعیف نیست زیرا XRP شما را ناامید می کند. با این حال، اگر بتوانید منتظر بمانید، XRP پاداش های خوبی را ارائه می دهد. برنامه بازی بلند مدت باید به صورت زیر باشد: الف) خرید کنید ب) نگه دارید ج) آن را فراموش کنید د) بعد از 6 ماه دوباره چک کنید فقط برای دست های بیمار تنظیمش کنید و فراموشش کنید و خود آینده شما از شما تشکر کرد.
mycotoxin
بیت کوین در مسیر هدف 150 هزار دلاری: تحلیل جدید با روش وایکوف
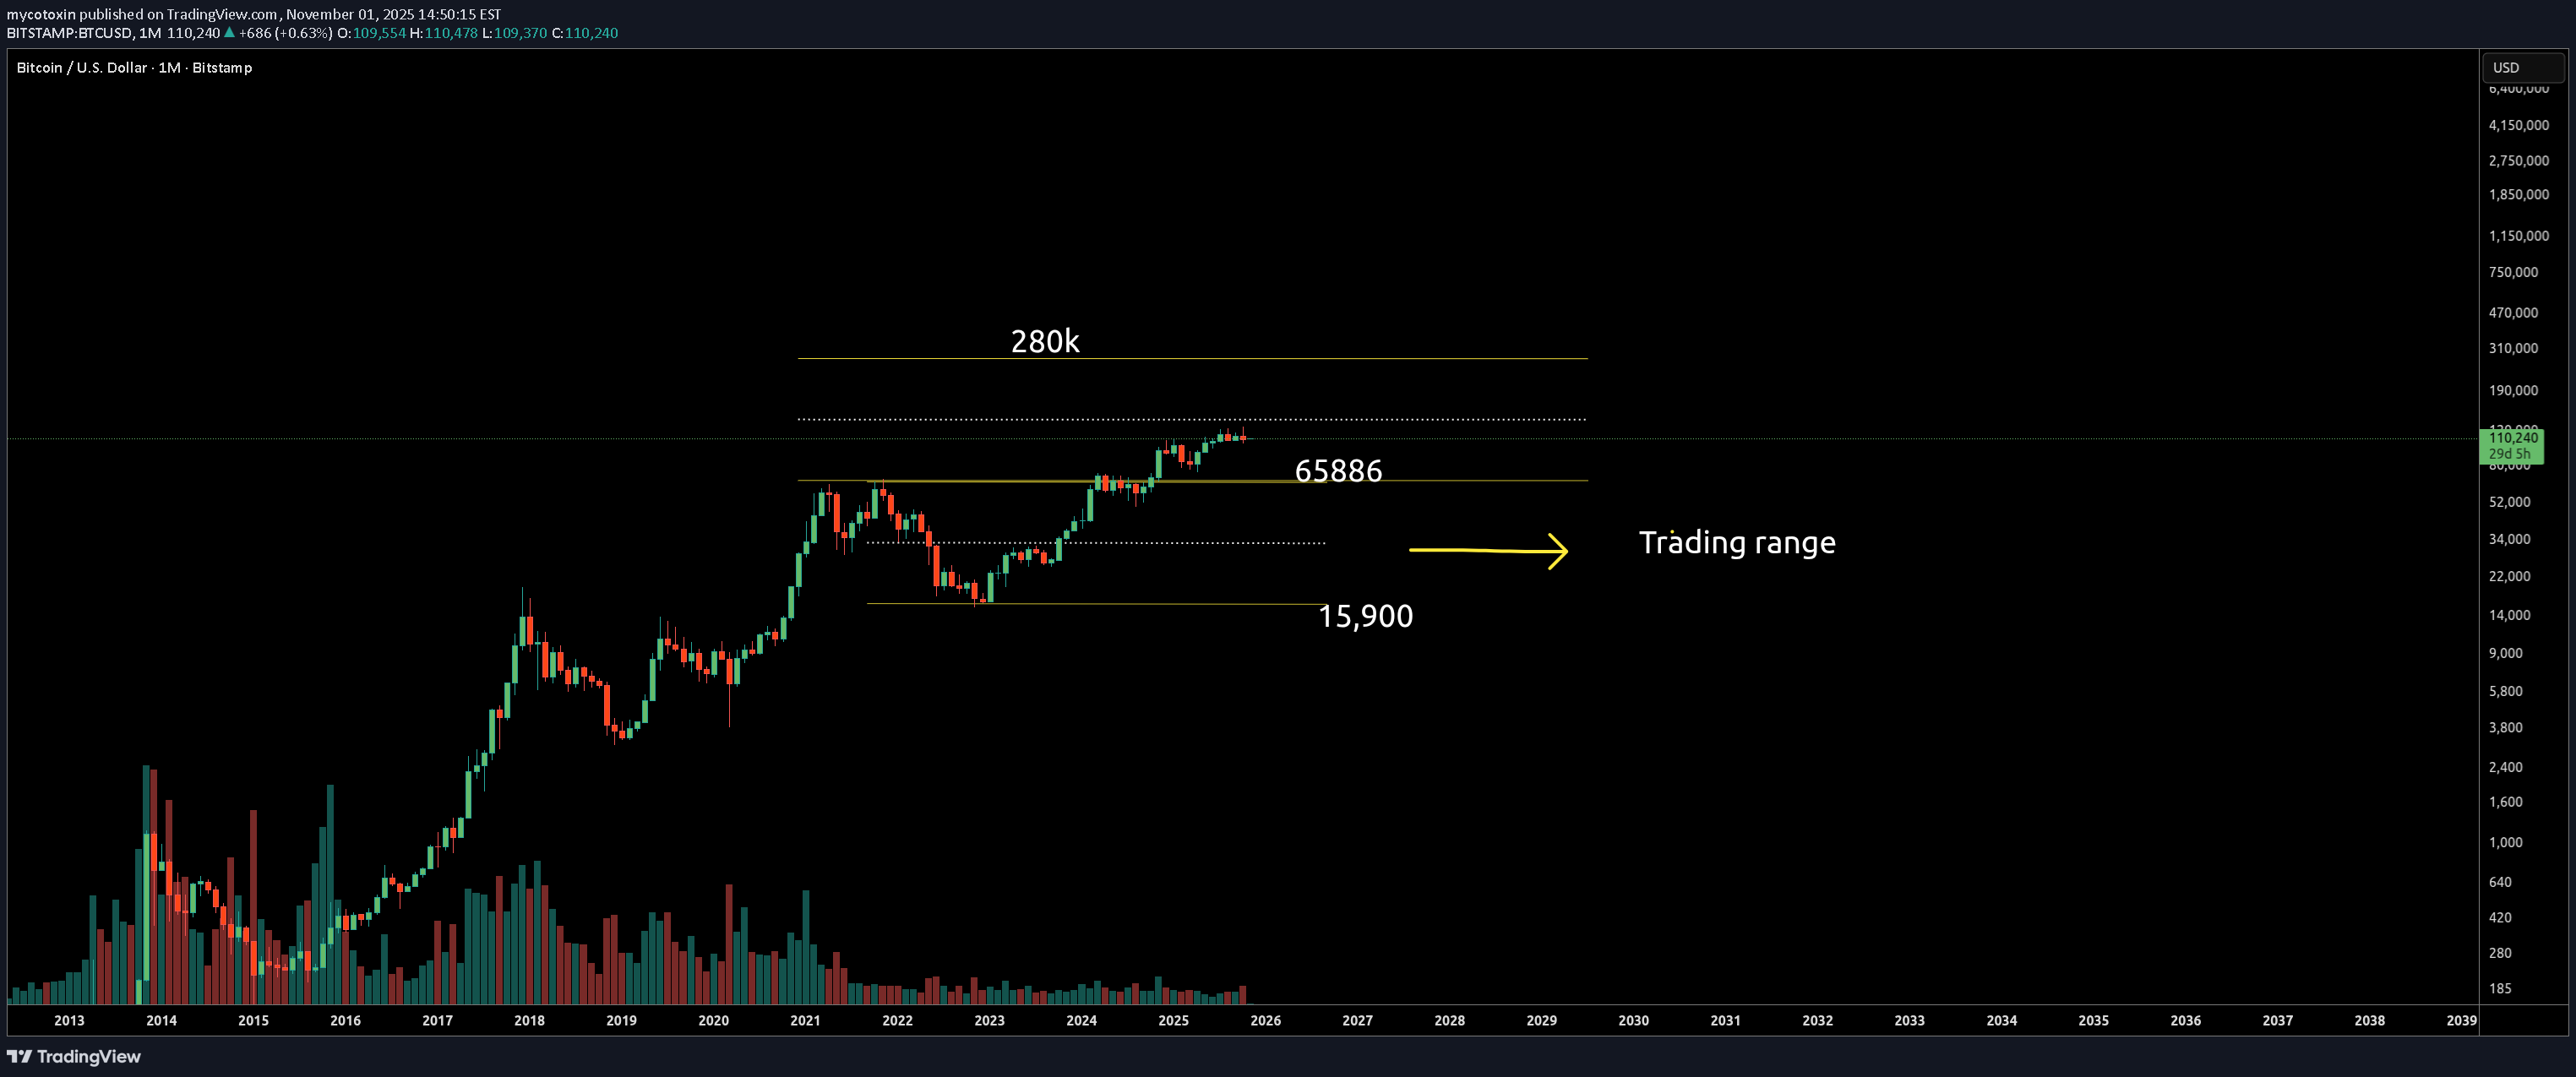
BTC همچنان در مسیر دستیابی به اهداف تحلیل من در آگوست ۲۰۲۵ (نمودار زیر) قرار دارد. با اعمال روش وایکوف، رسماً از دامنه معاملاتی چند ساله ۱۵,۹۰۰ تا ۶۵,۸۸۸ دلار خارج شده و در حال صعود خزنده است. اهداف بدون تغییر باقی میمانند: ۱۳۷ هزار تا ۱۵۰ هزار دلار برای فاز اول و پس از آن ۲۵۰ هزار تا ۲۸۰ هزار دلار.
mycotoxin
XLM در آستانه انفجار؟ رمز ارز قدیمی با پتانسیل صعودی بزرگ به ۱.۷۰ دلار!
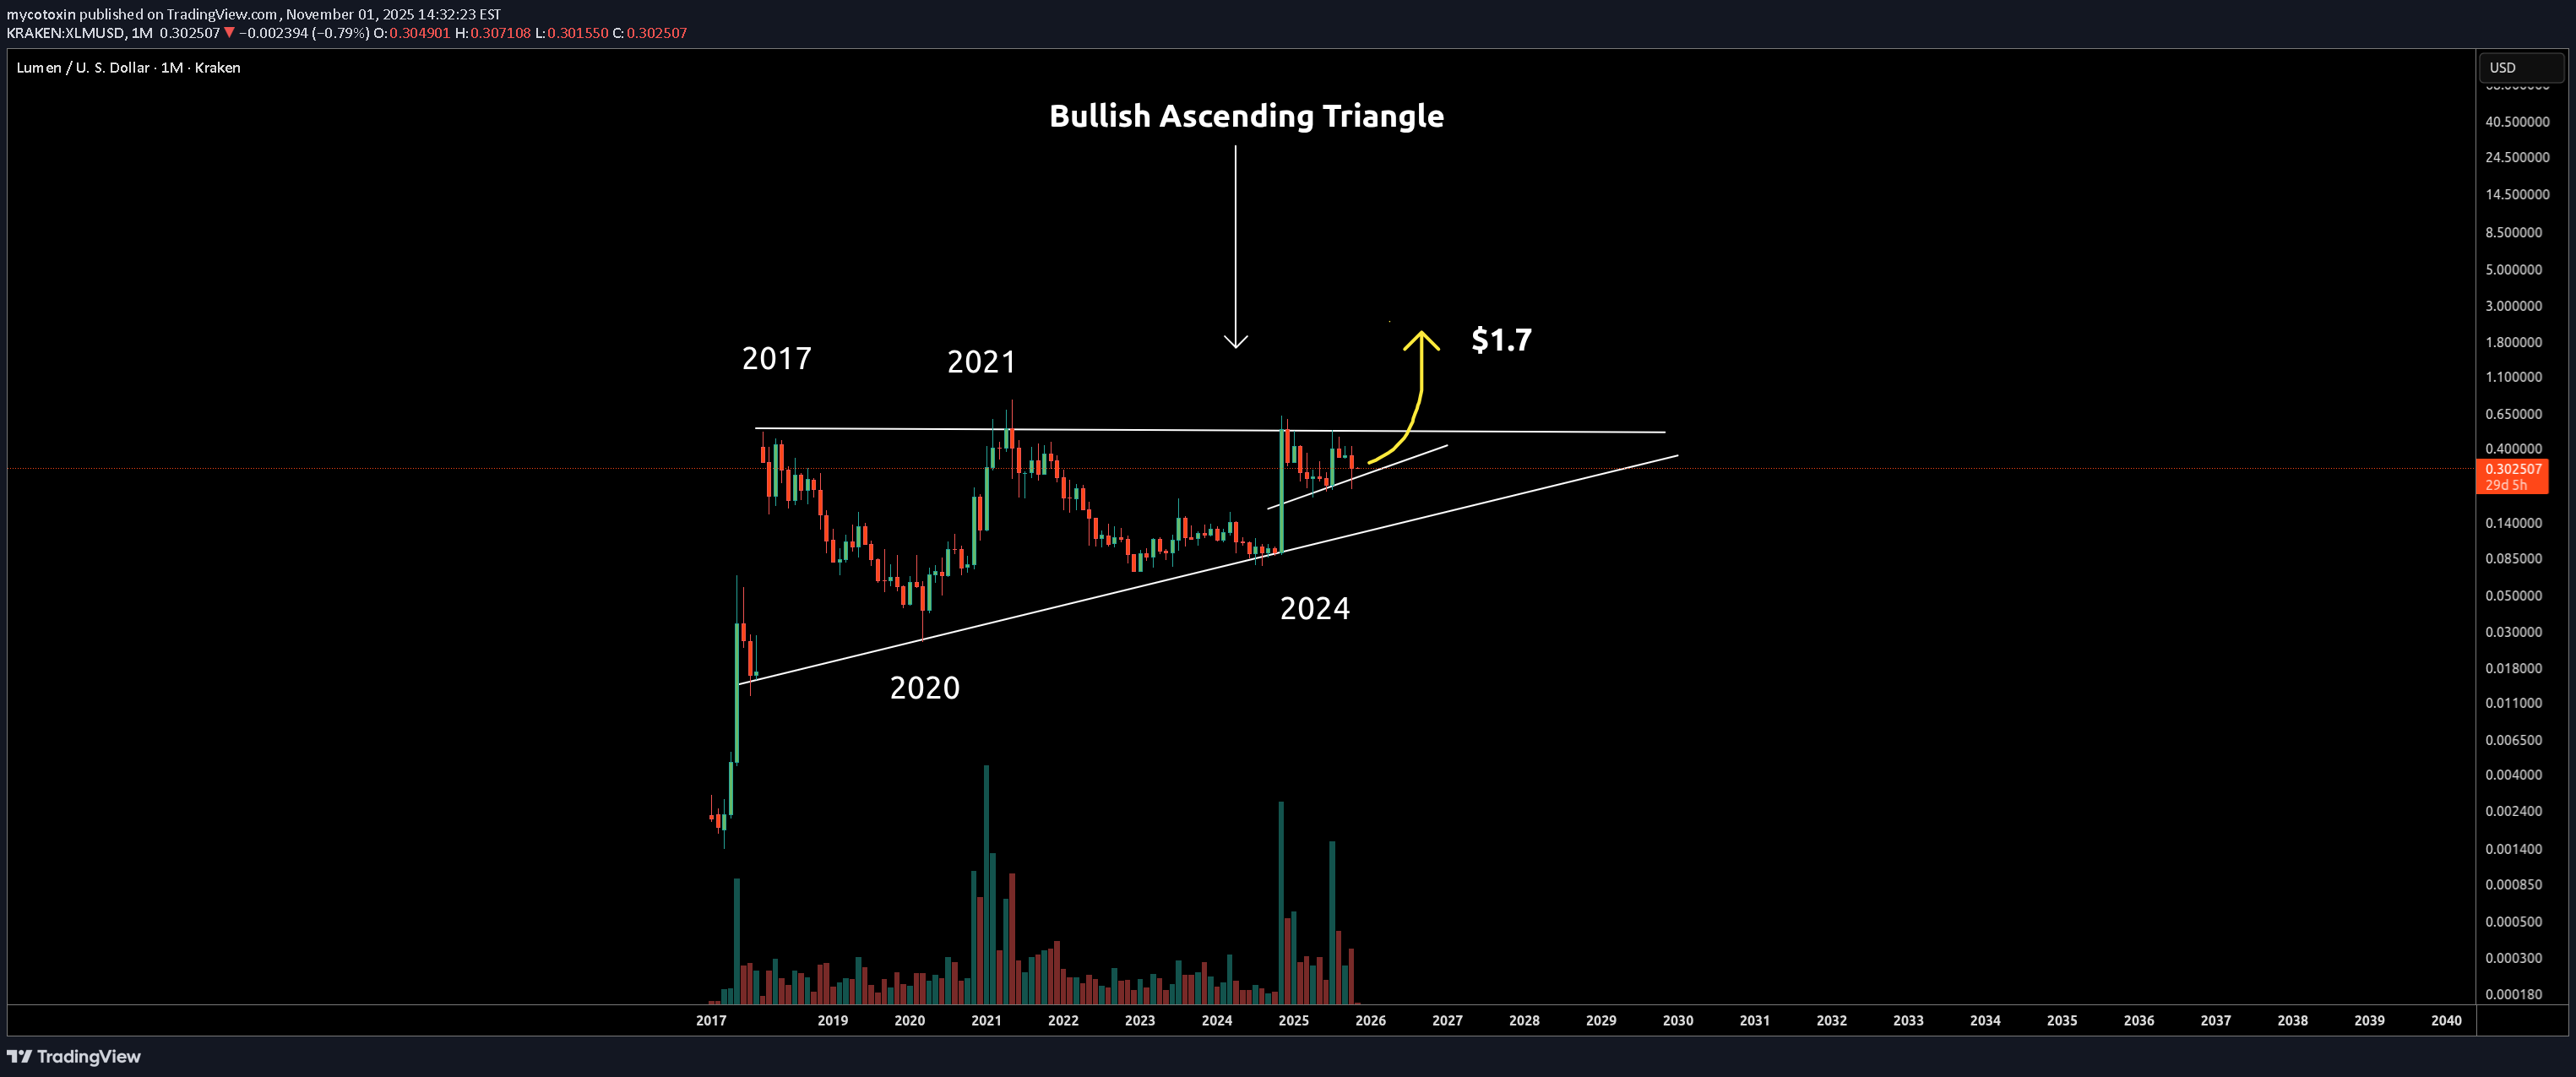
XLM در حال اتمام یک فاز انباشت چند ساله (۸ سال از ۲۰۱۷ تا ۲۰۲۵) است. الگوی مثلث صعودی (گاوی) نشان میدهد که دستهای قوی، سالهاست که به طور پیوسته این توکن را انباشت کردهاند. از آنجایی که این یک توکن قابل اعتماد OG با تاریخچه و قدرت ماندگاری ثابتشده است، انتظار دارم یک move اولیه به محدوده ۱.۷۰ دلار برای XLM اتفاق بیفتد تا حرکت آغاز شود و سپس از آنجا بالاتر رود. این یک سناریوی تمیز است و move اندازهگیریشده، پتانسیل صعود قابل توجهی را در پیش رو نشان میدهد. از این فرصت غافل نشوید.
mycotoxin
تغییر رژیم ZCASH: سیگنال انفجاری صعودی با شمع مارابوزوی تاریخی!
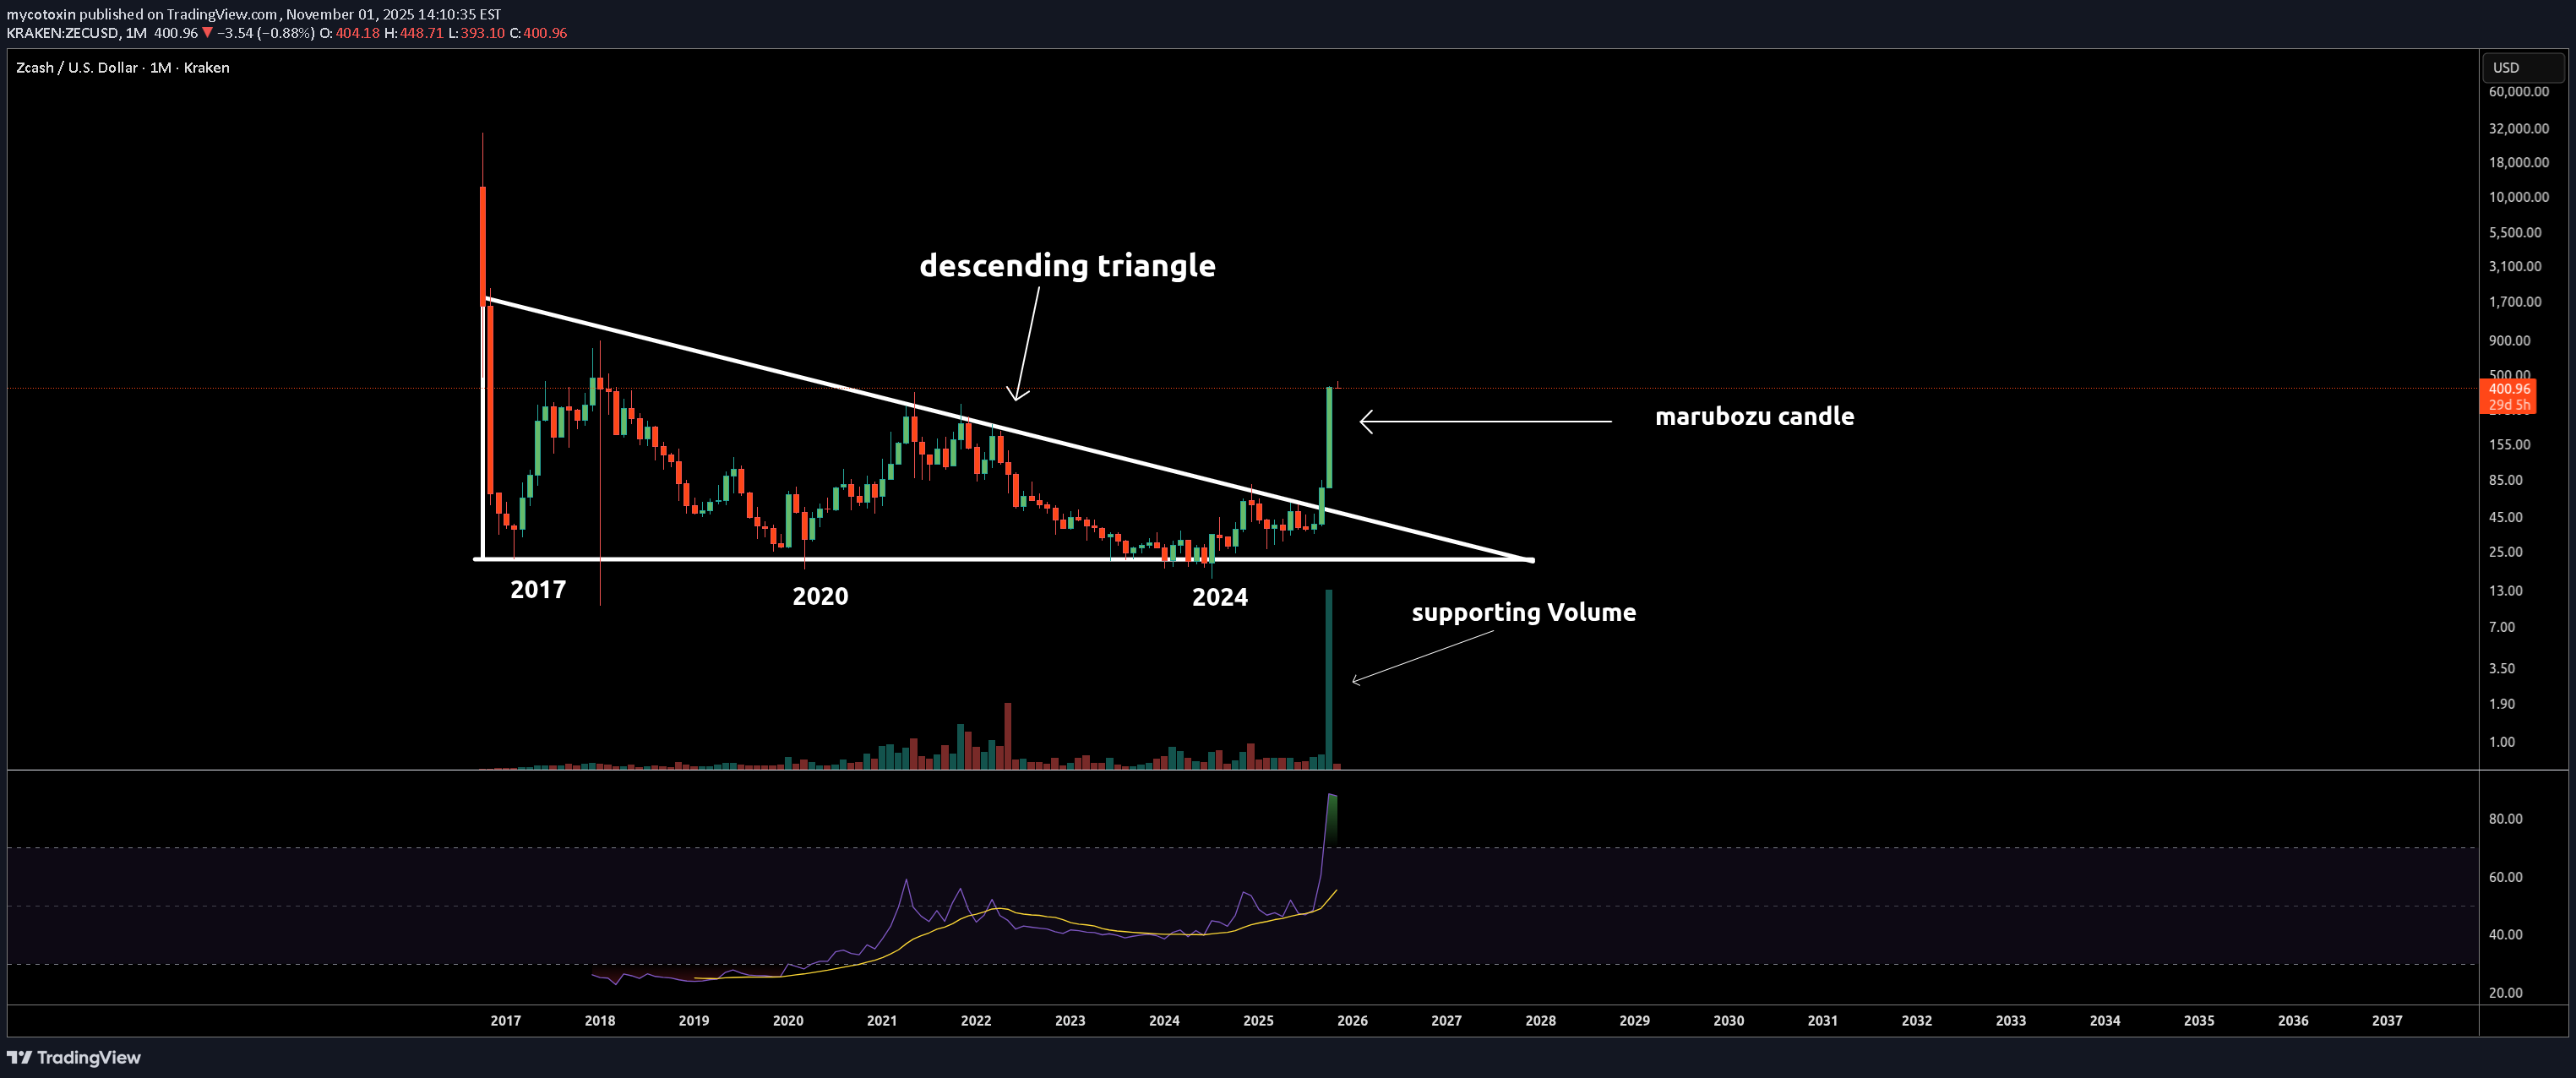
شمع ماروبوزو یک شمع قوی صعودی با حجم زیاد و بدون فتیله در دو طرف آن است. فقدان فتیله به این معنی است که خریداران کاملاً کنترل داشتند - قیمت را از باز به بسته شدن بدون تردید بالا می بردند. آنچه در اینجا بسیار rare است این است که شمع های marubozu معمولاً در نمودارهای روزانه یا ساعتی نشان داده می شوند، نه نمودارهای ماهانه. با این حال در نمودار ZCASH، ما شاهد یک marubozu کامل در بازه زمانی ماهانه با حجم پشتیبانی عظیم هستیم. این فقط یک تغییر روند نیست، بلکه یک تغییر رژیم است. نهنگ ها به مدت 8 سال در حال انباشته شدن بوده اند و در نهایت نشان داده اند که آماده اند تا قیمت ها را به مراتع بالاتر ببرند. من انتظار دارم که قیمت به مقاومت حدود 460 دلار برسد، کمی در آنجا تثبیت شود، سپس به سمت منطقه 1000 تا 1500 دلار حرکت کند. این یک شکست کتاب درسی پس از سال ها انباشت است. marubozu ماهانه با حجم همه چیزهایی را که باید بدانید به شما میگوید - پول هوشمند در انتظار انجام میشود و این میتواند شروع چیز بزرگی باشد. با نگاهی به نمودار ZECBTC هیچ مقاومتی تا رسیدن قیمت به 0.00678 BTC وجود ندارد، بنابراین قیمت میتواند قبل از مشاهده عقب نشینی به حدود 700 دلار برسد. مرور نمودار ZECBTC. قیمت در حال حاضر در بالای مقاومت اصلی در حدود 700 متوقف شده است. صادقانه بگویم، من فکر نمیکنم که ZEC انفجار در این منطقه وجود داشته باشد زیرا افرادی که از سال 2017 به دام افتادهاند خارج شد، همراه با موسسات که احتمالاً مقداری سود میبرند. من حدس میزنم قبل از بهبود قیمت، یک شیب تثبیت به منطقه 400-380 در حال انجام است. انتظار من این است که قیمت برای چند هفته/ماه بین 750-380 تثبیت شود، سپس روند ZEC در سال 2026 به سمت منطقه 10k ادامه یابد. فقط افکار من - نه توصیه مالی.
mycotoxin
DASH: بازگشت از خواب زمستانی! آیا انفجار بزرگ قیمتی در راه است؟
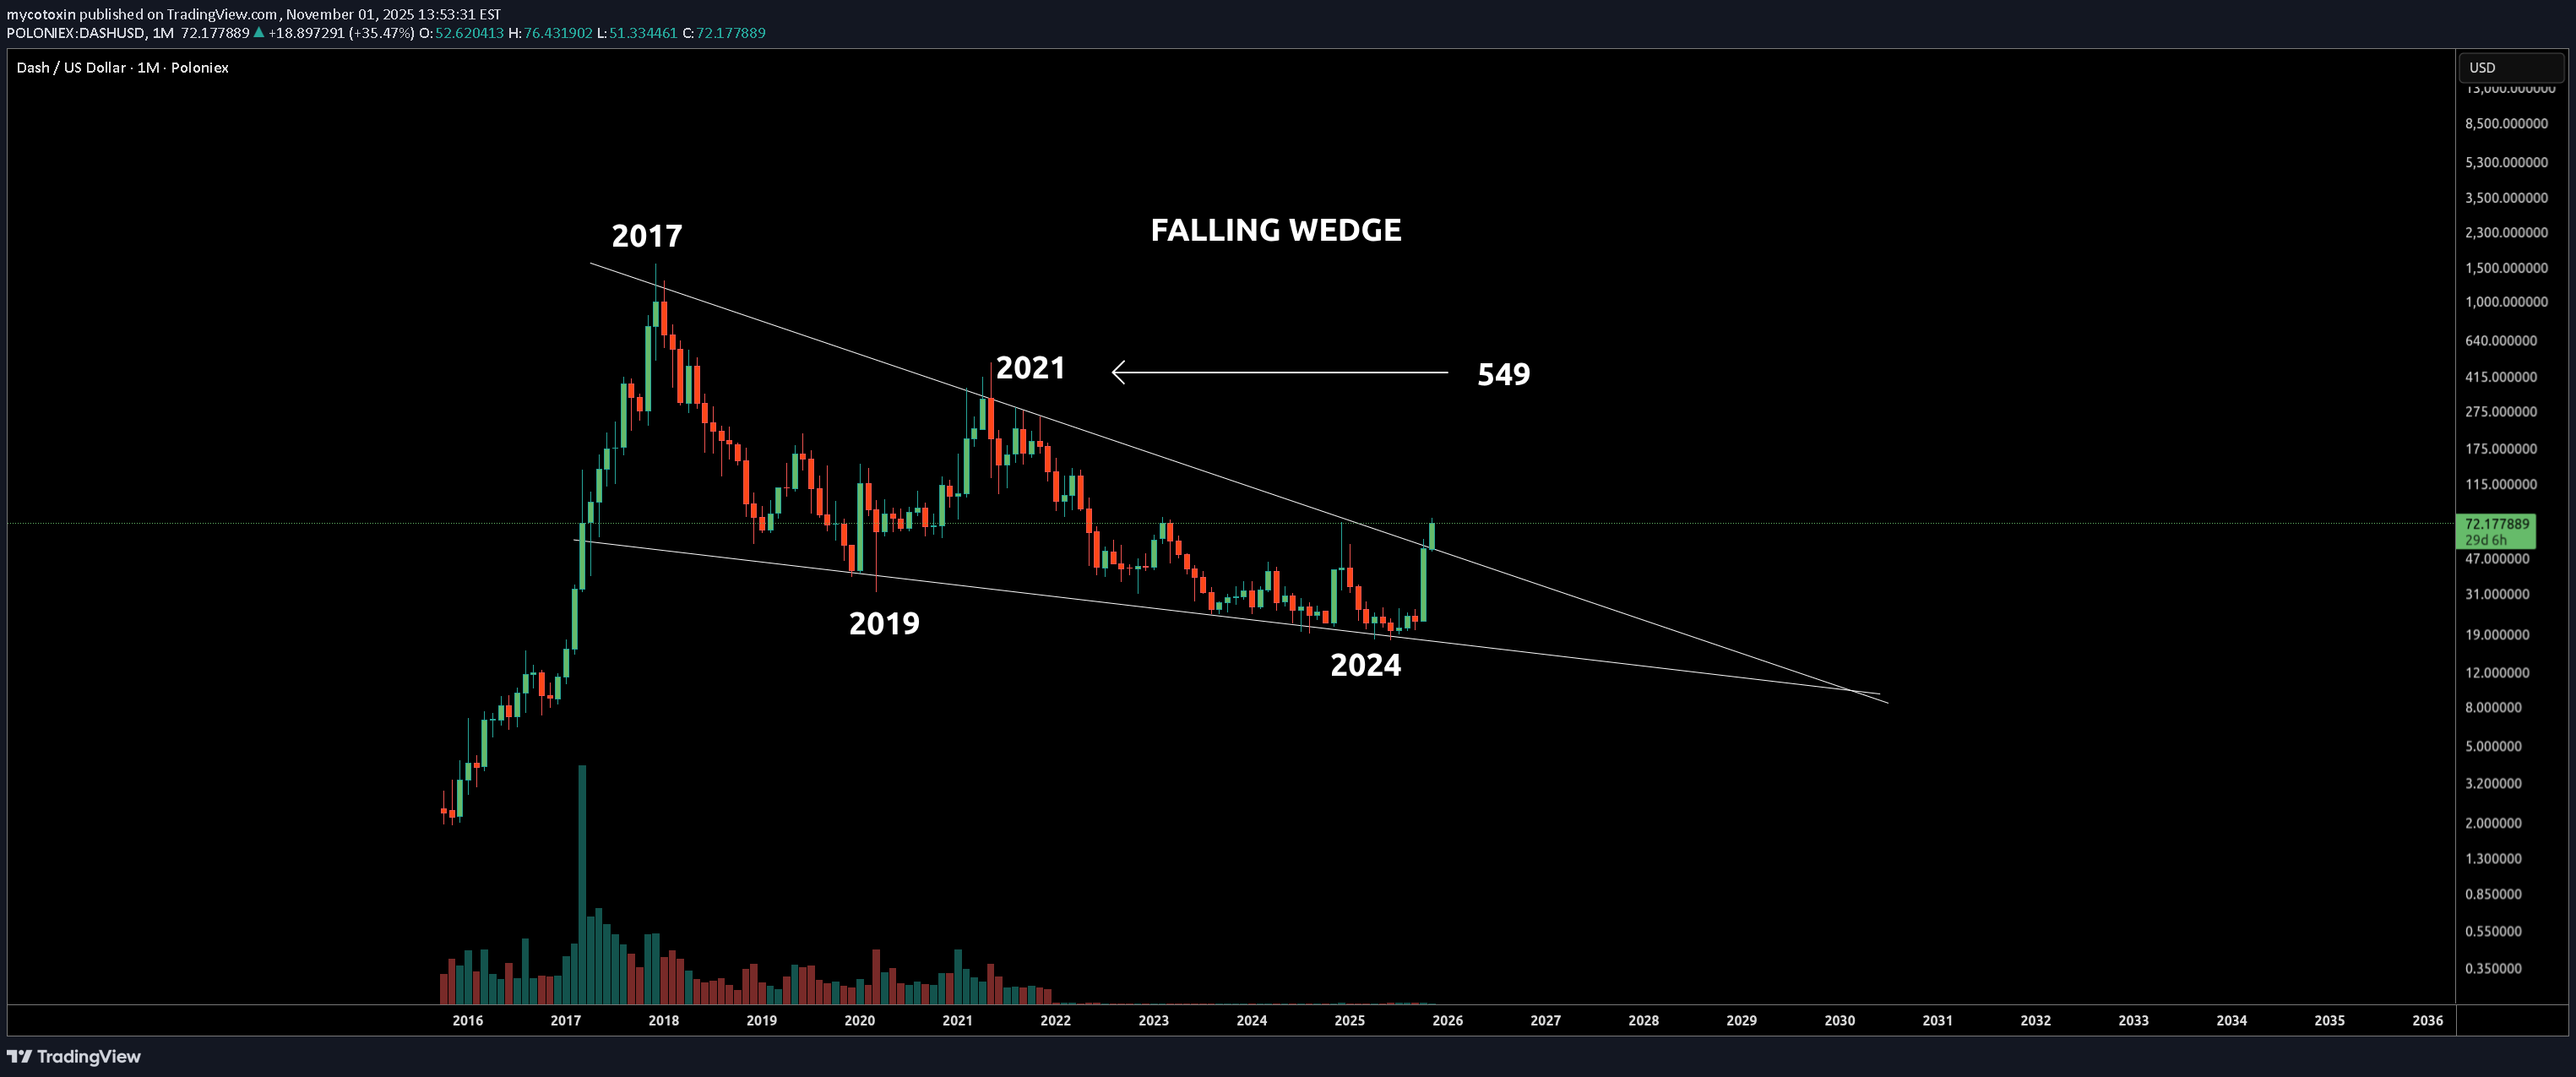
به نظر میرسد که DASH در حال اتمام یک دوره انباشت ۸ ساله است که با الگوی گوه نزولی (Falling Wedge) مشهود است. یکی از نکات جالبتوجهی که در سال ۲۰۱۷ برای من برجسته شد، این بود که به یاد دارم در اوج قیمتی آن زمان، خواندم که دارندگان DASH با بهکارگیری ۱۰۰۰ توکن DASH برای راهاندازی یک مسترنود (Masternode)، سالانه ۱۲۰ هزار دلار درآمد کسب میکردند. با قضاوت بر اساس الگوی گوه نزولی، اینطور به نظر میرسد که برخی از «نهنگها» (Whales) متوجه این واقعیت شده و قیمت DASH را طی ۸ سال سرکوب کردهاند تا انباشت خود را تکمیل کنند. مشابه ZCASH، زمانی که DASH از محدوده انباشت خود خارج شود، انتظار دارم قیمت با قدرت جهش کند و هدف قیمتی اولیه آن در محدوده ۵۴۹ بود.
mycotoxin
BTC 150k followed by target to 260-280k .
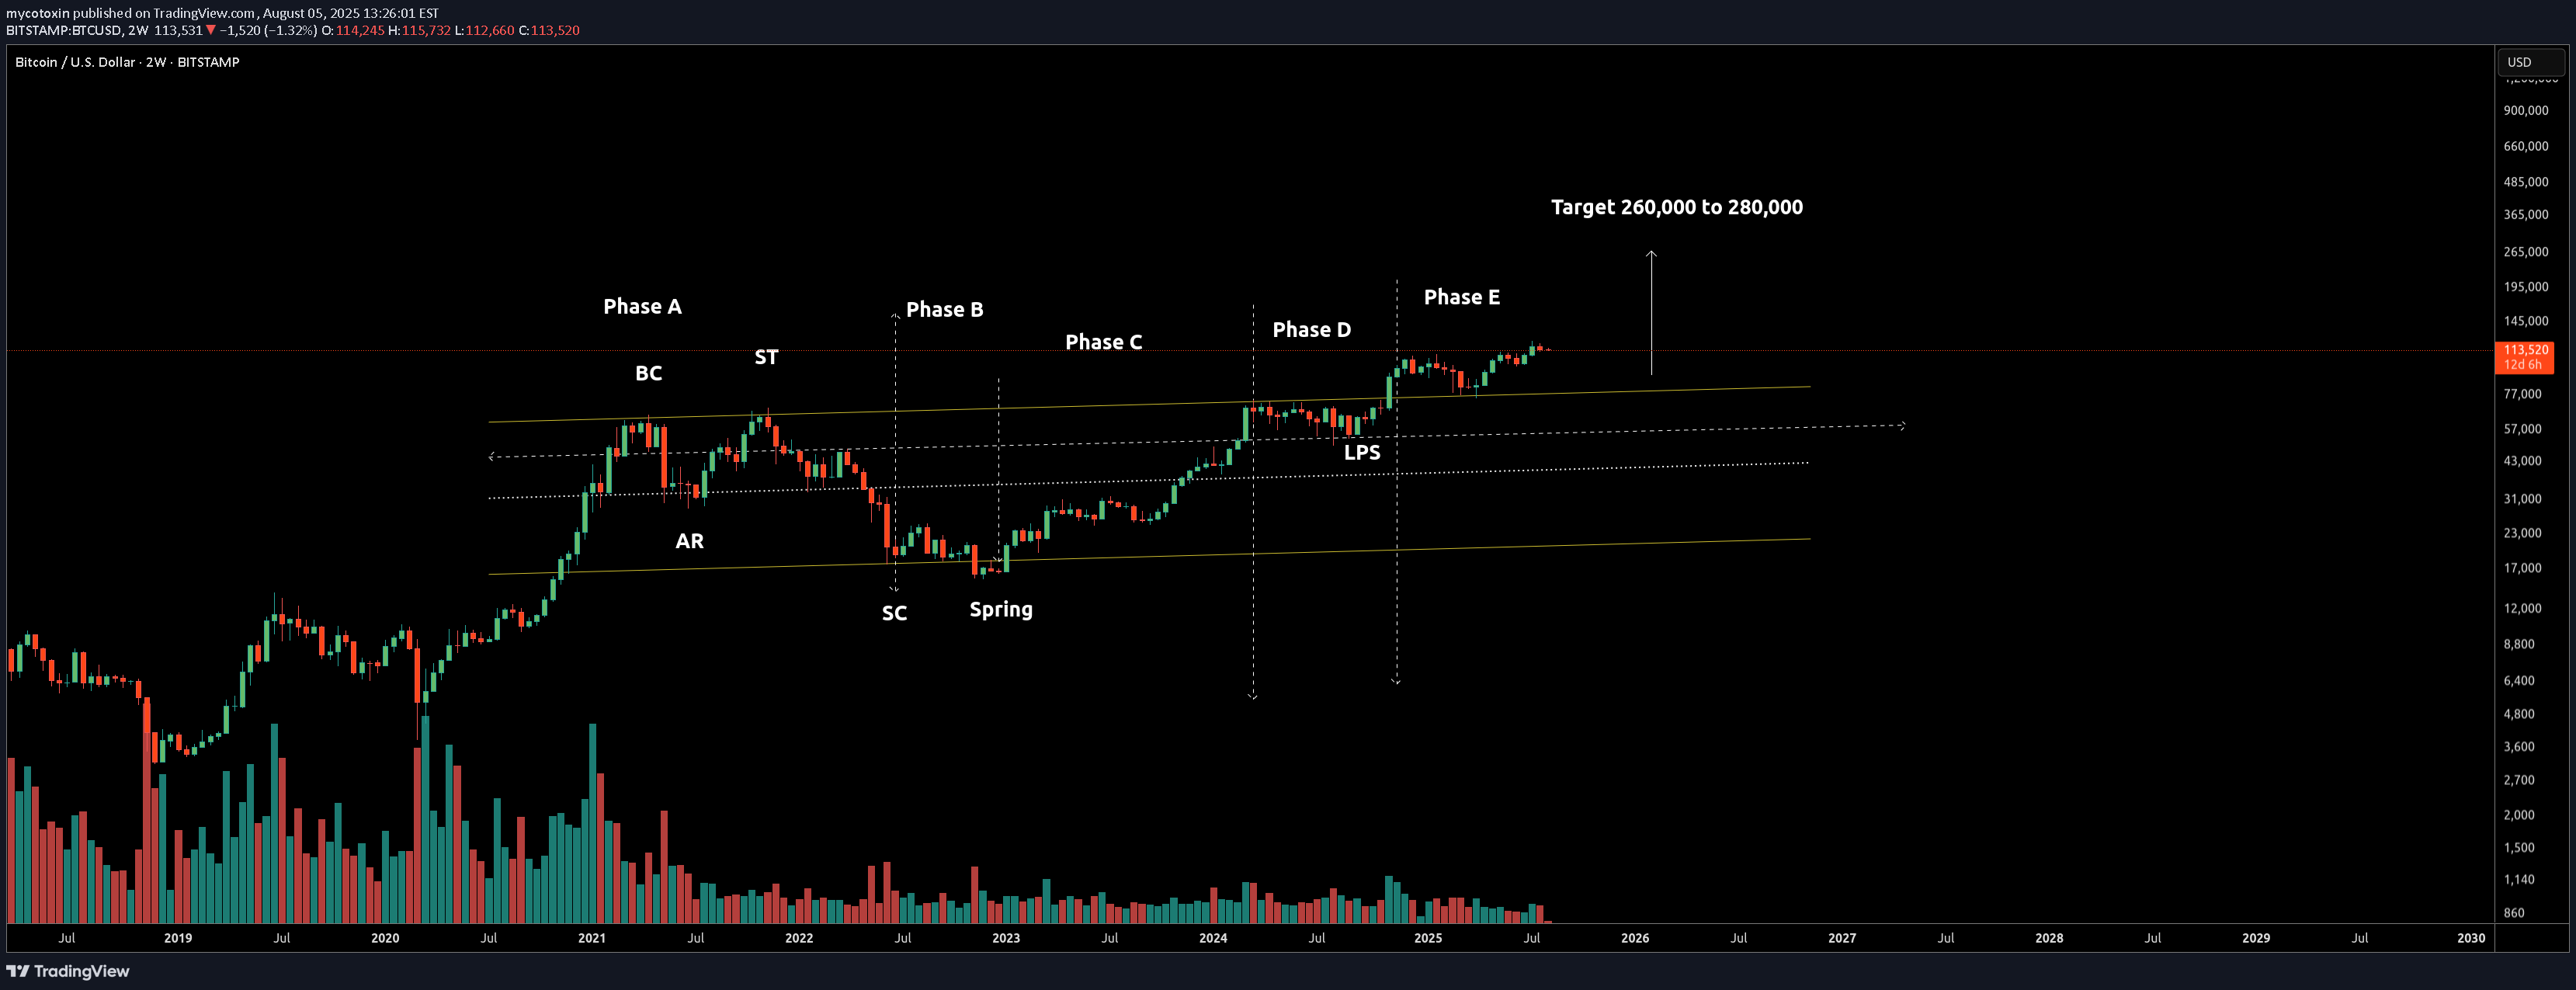
اگر از روش Wyckoff استفاده شود ، این فاز جمع آوری مجدد با a هدف اول در منطقه 150K و هدف اصلی a در منطقه 260K تا 280K است. مراحل Wyckoff که در نمودار مشخص شده اند به شرح زیر است فاز A: قبل از میلاد (خرید اوج) AR (واکنش خودکار) ST (تست ثانویه) فاز B: با نوسانات و آزمایش در محدوده مشخص می شود. مرحله C: SC (فروش اوج) بهار - a لرزش نهایی زیر پشتیبانی از بازرگانان گمراه کننده قبل از رو به بالا movement. مرحله D: اوج بالاتر و پایین تر از حد بالاتر. نشانه قدرت (SOS) و آخرین نقطه پشتیبانی (LPS) مشاهده شده است. مرحله E: قیمت بالاتر از محدوده انباشت مجدد است و دامنه معاملاتی را که اکنون به عنوان پشتیبانی عمل می کند ، استراحت می کند. از آنجا که قیمت دارایی از محدوده معاملات id انتظار a قوی move در حدود منطقه 150K و به دنبال آن a ثانویه move به هدف 260-280k. با استفاده از روش PNF ، هدف اول باید بین 133 تا 180k باشد و این نیز منطقه سود بود. تخمین شمارش P&F با استفاده از موارد زیر: ساختار: ========================================================================================================================. a) Major کم (بهار/فاز C): حدود 15،500-16،000 دلار b) سطح بالقوه برک آوت: حدود 73،000-75،000 دلار (اوج قبلی) ج) مقاومت فعلی در برابر پاک کردن: حدود 70،000-75،000 دلار محدوده د) از عرض الگوی تجمع 12-15 ستون فعالیت ادغام وجود دارد. هدف P&F محافظه کار ---------------------------------------------------- با استفاده از روش شمارش عمودی: پایه = 60،000 $ عرض دامنه نقطه شکست = 73،000 پوند هدف محافظه کارانه = 73،000 دلار + 60،000 دلار = 133،000 $ هدف P&F تهاجمی: ---------------------------------------------- با استفاده از a تعداد گسترده تر یا روش شمارش افقی: دامنه گسترده = 90،000-100،000 پوند نقطه شکست = 73،000 پوند هدف تهاجمی = 73،000 دلار + 100،000 دلار = 173،000-180،000 $
سلب مسئولیت
هر محتوا و مطالب مندرج در سایت و کانالهای رسمی ارتباطی سهمتو، جمعبندی نظرات و تحلیلهای شخصی و غیر تعهد آور بوده و هیچگونه توصیهای مبنی بر خرید، فروش، ورود و یا خروج از بازارهای مالی نمی باشد. همچنین کلیه اخبار و تحلیلهای مندرج در سایت و کانالها، صرفا بازنشر اطلاعات از منابع رسمی و غیر رسمی داخلی و خارجی است و بدیهی است استفاده کنندگان محتوای مذکور، مسئول پیگیری و حصول اطمینان از اصالت و درستی مطالب هستند. از این رو ضمن سلب مسئولیت اعلام میدارد مسئولیت هرنوع تصمیم گیری و اقدام و سود و زیان احتمالی در بازار سرمایه و ارز دیجیتال، با شخص معامله گر است.