
moomoo
@t_moomoo

تریدر چه نمادی را توصیه به خرید کرده؟
سابقه خرید
تخمین بازدهی ماه به ماه تریدر
پیام های تریدر
فیلتر
نوع سیگنال
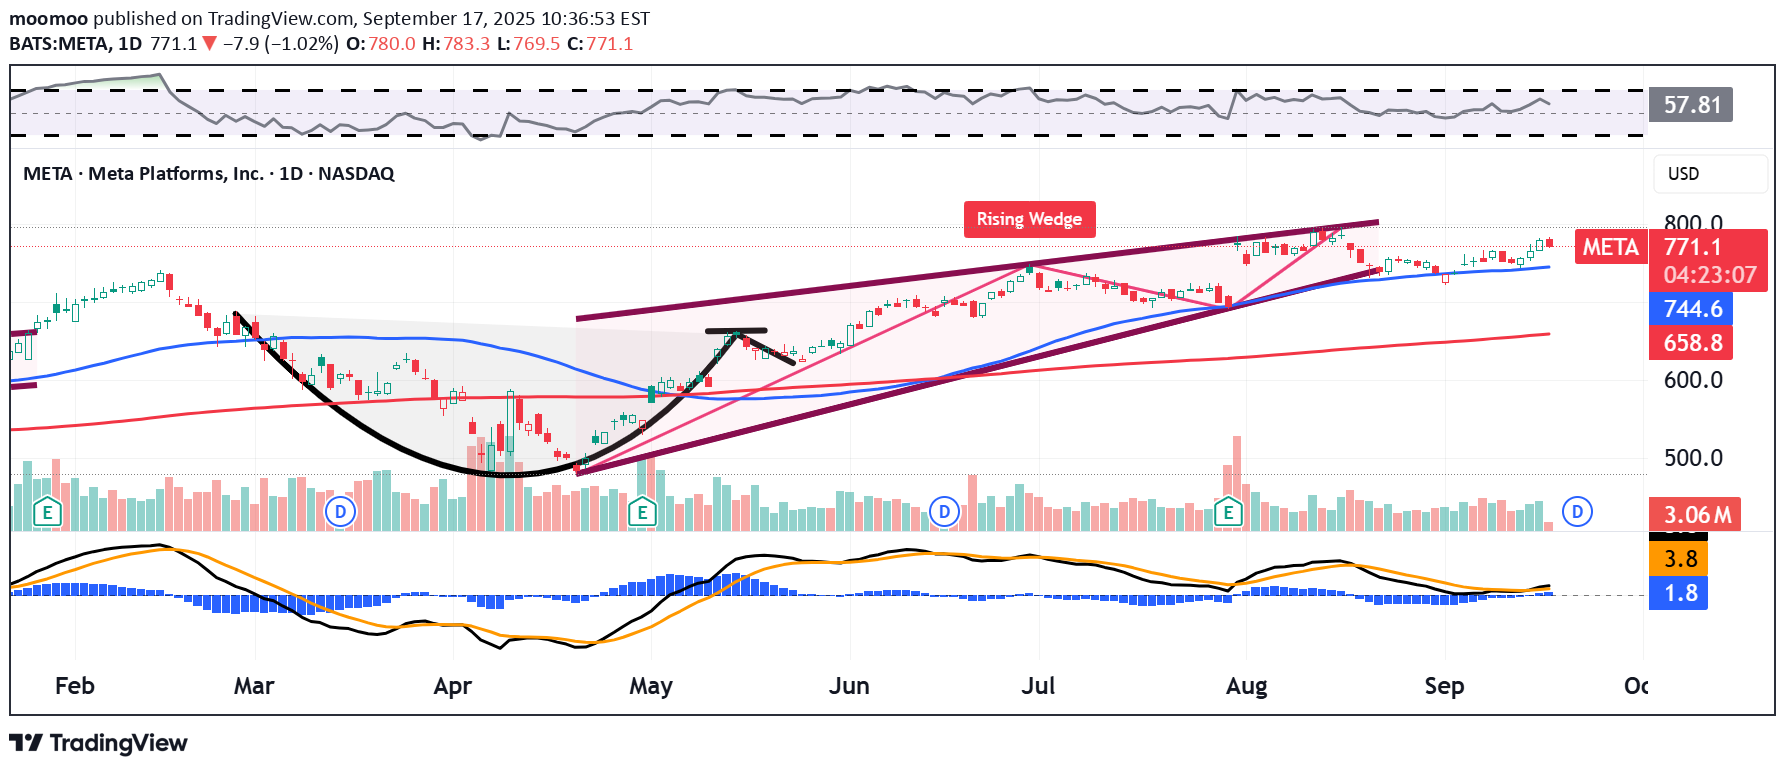
Meta Platforms META has long seemed to defy expectations, but the social-media giant has seen its stock stall over the past six weeks or so. What does its chart say? Meta's Technical Analysis META has gained some 30% year to date and more than 40% over the past 12 months, but has gone pretty much nowhere since July. The stock was trading Wednesday morning at $770.77, down 0.3% from its July 31 $773.44 finish. Let's look at META's six-month chart as of Thursday afternoon: Readers will see that the stock came out of a bullish "cup-with-handle" pattern in May, as denoted with the black curving line at left in the above chart. The stock blasted past the pattern's $661 pivot (marked with a short black horizontal line) to hit a $796.25 all-time intraday high on Aug. 15. Based on that pivot and pattern, a trader such as myself would have had a target price in the mid-$790s. So, that technical pattern worked like a charm. However, META has traded lower to sideways ever since hitting that apex. In fact, the stock has developed what's called a "rising-wedge" pattern of bearish reversal that goes all the way back to the very bottom of its cup with handle. META broke the rising wedge's lower trendline in recent days, but did find support at its 50-day Simple Moving Average (or "SMA," marked with a blue line above). A loss of that line would likely result in some loss of institutional support. Why would technicals that worked so well for this stock suddenly look so lost? Maybe it becomes very difficult to sell tech stocks or even short them ahead of this week's expected dovish monetary-policy pivot by the Federal Reserve. An Options Strategy Based on META's Volatility Under these conditions, options traders might consider a strategy based on Meta's potential volatility instead of taking a directional stake in the stock. After all, there are some potentially important catalysts for META on the way. First, markets widely expect the Fed to cut the Fed Funds rate's target rate on Wednesday afternoon. The Fed has scheduled its next policy decision after that for Oct. 29 -- roughly the same time that Wall Street expects Meta to release Q3 results. (META has yet to announce an official earnings-release date.) An example of a volatility strategy would be a so-called "strangle." This would involve: -- Selling a $690 Oct. 31 put. -- Selling an $810 Oct. 31 call. As I write this, that trade would net a rough $31 in premiums. Of course, there's certainly risk in this move. For instance, the trader would be obligated to purchase META shares at $690 or sell them at $810 if the stock moves beyond either of those bands. That said, the trade doesn't lose money on a net basis in this set-up unless the stock trades above $846 or below $659 at expiration. This chart illustrates the price levels for the equity where profit created by the options set up starts to degrade: A more-cautious trader might purchase an even-wider strangle in order to manage the risk. However, that would eat into the net credit received from the premiums collected. (Moomoo Technologies Inc. Markets Commentator Stephen “Sarge” Guilfoyle had no position in META at the time of writing this column.) This article discusses technical analysis, other approaches, including fundamental analysis, may offer very different views. The examples provided are for illustrative purposes only and are not intended to be reflective of the results you can expect to achieve. Specific security charts used are for illustrative purposes only and are not a recommendation, offer to sell, or a solicitation of an offer to buy any security. Past investment performance does not indicate or guarantee future success. Returns will vary, and all investments carry risks, including loss of principal. This content is also not a research report and is not intended to serve as the basis for any investment decision. The information contained in this article does not purport to be a complete description of the securities, markets, or developments referred to in this material. Moomoo and its affiliates make no representation or warranty as to the article's adequacy, completeness, accuracy or timeliness for any particular purpose of the above content. Furthermore, there is no guarantee that any statements, estimates, price targets, opinions or forecasts provided herein will prove to be correct. Options trading is risky and not appropriate for everyone. Read the Options Disclosure Document ( https://j.moomoo.com/017y9J ) before trading. Options are complex and you may quickly lose the entire investment. Supporting docs for any claims will be furnished upon request. Options trading subject to eligibility requirements. Strategies available will depend on options level approved. Moomoo is a financial information and trading app offered by Moomoo Technologies Inc. In the U.S., investment products and services on Moomoo are offered by Moomoo Financial Inc., Member FINRA/SIPC. TradingView is an independent third party not affiliated with Moomoo Financial Inc., Moomoo Technologies Inc., or its affiliates. Moomoo Financial Inc. and its affiliates do not endorse, represent or warrant the completeness and accuracy of the data and information available on the TradingView platform and are not responsible for any services provided by the third-party platform.

Amazon AMZN has been in an upward-sloping trend since early April, but the e-commerce giant is trailing the S&P 500 SPX year to date and has fallen some 4% since its February all-time peak. Let's look at what the stock's chart says. Amazon and the Macro Environment Many would find it difficult to take on a short position or liquidate a long one on a major tech stock like Amazon just as Wall Street expects the Federal Reserve to pivot toward a significantly more-dovish policy stance. But remember, Amazon is more than just a tech stock. It's also a major online retailer, the owner of a high-end brick-and-mortar grocer (Whole Foods), parent of a major consumer-discretionary product (Amazon Prime Video) and more. Would it be as difficult to take a short position or liquidate a long one in such a name as the Fed goes into a dovish stance amid a U.S. labor market that's markedly weaker than anyone knew? After the U.S. Bureau of Labor Statistics recently issued as massive downward annual to its Apil 2024/March 2025 job-creation numbers, Chief Bloomberg U.S. Economist Anna Wong argued that America could already be in a recession. "When all the revisions for 2024 and 2025 are complete -- we won't get the final revisions until early 2026 and 2027 -- we expect they'll show the business cycle peaked around April 2024," she said. "It's possible the economy is either still in recession, or is in the early phase of a new business cycle," said Wong, who formerly served as principal economist for the Federal Reserve Board. It's not every day that a highly respected economist talks about backdating a recession by a year and half. That would be potentially bad news for a consumer-focused company like Amazon. Amazon's Technical Analysis Now let's look at Amazon's year-to-date chart as of Wednesday: There are two patterns under development, both potentially bearish. Readers will first note the potential development of a very large "double-top" pattern of bearish reversal, marked with two red boxes in the chart above. This pattern's downside pivot would be way down at $161 vs. the $232.54 that AMZN was trading at Tuesday morning. That would be a long way to go just to reach a pivot, and would also put a so-called "double-bottom" pattern into play. Meanwhile, Amazon's chart also shows another potentially bearish set-up in the works with a more realistic pivot: This chart shows an almost-completed "rising-wedge" pattern of bearish reversal with a realistic downside pivot that just happens to be Amazon's 50-day Simple Moving Average (or "SMA," marked with a blue line above). Th 50-day SMA line is currently running alongside the rising-wedge pattern's power trendline. Amazon is also seeing potential support at its 200-day SMA (the red line above) as well. However, the chart above shows what happened the last time AMZN came out of a rising wedge this past February, as marked with a purple-shaded area at the chart's left. The stock fell nearly 30% from about $225 during February's third week to a $161.38 52-week low on April 7. Meanwhile, Amazon's other technical indicators in the above chart don't tell us much just yet. For instance, the stock's Relative Strength Index (the gray line at the chart's top) is still better than neutral, but sliding towards mediocrity. Separately, AMZNs daily Moving Average Convergence Divergence indicator (or "MACD," marked with black and gold lines and blue bars at the chart's bottom) is still technically postured bullishly -- but has some issues. The histogram of Amazon's 9-day Exponential Moving Average (or "EMA," marked with blue bars) is still positive, but the 12-day EMA (the black line) is curling down towards the 26-day EMA (the gold line). A cross-under there would be a short- to medium-term bearish signal for the stock. (Moomoo Technologies Inc. Markets Commentator Stephen “Sarge” Guilfoyle had no position in AMZN at the time of writing this column.) This article discusses technical analysis, other approaches, including fundamental analysis, may offer very different views. The examples provided are for illustrative purposes only and are not intended to be reflective of the results you can expect to achieve. Specific security charts used are for illustrative purposes only and are not a recommendation, offer to sell, or a solicitation of an offer to buy any security. Past investment performance does not indicate or guarantee future success. Returns will vary, and all investments carry risks, including loss of principal. This content is also not a research report and is not intended to serve as the basis for any investment decision. The information contained in this article does not purport to be a complete description of the securities, markets, or developments referred to in this material. Moomoo and its affiliates make no representation or warranty as to the article's adequacy, completeness, accuracy or timeliness for any particular purpose of the above content. Furthermore, there is no guarantee that any statements, estimates, price targets, opinions or forecasts provided herein will prove to be correct. Moomoo is a financial information and trading app offered by Moomoo Technologies Inc. In the U.S., investment products and services on Moomoo are offered by Moomoo Financial Inc., Member FINRA/SIPC. TradingView is an independent third party not affiliated with Moomoo Financial Inc., Moomoo Technologies Inc., or its affiliates. Moomoo Financial Inc. and its affiliates do not endorse, represent or warrant the completeness and accuracy of the data and information available on the TradingView platform and are not responsible for any services provided by the third-party platform.

Readers have likely noticed the early September breakout clocked by Google parent Alphabet GOOGL , which hit an all-time intraday high this week. Can the stock's nearly 15% run so far this month continue? Let's see what technical and fundamental analysis says. Alphabet's Fundamental Analysis GOOGL has risen 13.9% over September's first eight sessions to hit a $242.25 intraday record high on Thursday. Most of Alphabet's September gains came on Sept. 3, when the stock popped 9.1% after a federal judge overseeing the U.S. government's antitrust case against Alphabet GOOG ruled that the firm doesn't have to sell off the Google search engine. The court also said Google and Apple can retain a contract under which AAPL pre-loads Google's search engine onto iPhones in exchange for big payments from Alphabet. GOOGL has risen another roughly 5% since then even though the company is still some six weeks out from its next earnings release. Of the 45 sell-side analysts that I know of that cover the stock, 36 have revised their earnings estimates higher since the quarter began, while three have lowered their numbers. (The other six have so far left their earnings estimates unchanged.) Alphabet's Technical Analysis Now let's get down to business and take a look at GOOGL's technical breakout, as shown here in the stock's year-to-date chart through midday Tuesday: Readers will see that from late January into August, GOOGL developed a bullish "cup-with-handle" pattern that looks like it came out of a textbook. Marked with a purple curving line in the chart above, this pattern has a $206 pivot. For those new to technical analysis, a cup pattern's pivot is the apex of the cup's left side. Once a handle is added, that pivot moves across to the right-side peak. While I think that GOOGL could in theory move higher from here, I do have some concerns that are starting to nag at me. For starters, the stock created a still-unfilled gap on the morning of Sept. 3, as denoted by the orange circle at the chart's right above. Such unfilled gaps don't have to be filled, but they often are. That said, Alphabet's bullish technical set-up remains in place in the chart above. However, it does look like the stock's recent price surge was starting to top off in the high $230s and low $240s as I wrote this Thursday afternoon. Meanwhile, GOOGL's Relative Strength Index (the gray line at the chart's top) is beyond merely extended. While that's a good problem for Alphabet bulls to have, it's the result of the stock's recent parabolic move and reflects a technically overbought condition. Similarly, readers will see that Alphabet's daily Moving Average Convergence Divergence indicator (or "MACD," marked with black and gold lines and blue bars at the chart's bottom) is postured in a seemingly bullish way. The histogram of the stock's 9-day EMA (the blue bars) is now significantly positive and has been for a number of days. Alphabet's 12-day EMA (black line) is also well into positive territory and has crossed well above the 26-day EMA (gold line). That's also typically a bullish technical signal. All in, GOOGL was trading at a roughly 20% premium to its 50-day Simple Moving Average (or "SMA," marked with a blue line above) and a whopping 31% premium to its 200-day SMA (the red line) as of Thursday afternoon. That's all somewhat concerning technically. An Options Option How might someone try to protect themselves if they're long the stock? Consider purchasing a "protected collar." First, buy puts that expire later than Alphabet's next expected earnings date -- say, a contract with an Oct. 24 expiration date. The person would pay for those puts (or at least subsidize their purchase) by selling an equal-sized covered call against their long position. Such a set-up would create a possible escape for an investor for a reduced cost through the sale of some potential excess gains. (Moomoo Technologies Inc. Markets Commentator Stephen “Sarge” Guilfoyle was long GOOGL at the time of writing this column.) This article discusses technical analysis, other approaches, including fundamental analysis, may offer very different views. The examples provided are for illustrative purposes only and are not intended to be reflective of the results you can expect to achieve. Specific security charts used are for illustrative purposes only and are not a recommendation, offer to sell, or a solicitation of an offer to buy any security. Past investment performance does not indicate or guarantee future success. Returns will vary, and all investments carry risks, including loss of principal. This content is also not a research report and is not intended to serve as the basis for any investment decision. The information contained in this article does not purport to be a complete description of the securities, markets, or developments referred to in this material. Moomoo and its affiliates make no representation or warranty as to the article's adequacy, completeness, accuracy or timeliness for any particular purpose of the above content. Furthermore, there is no guarantee that any statements, estimates, price targets, opinions or forecasts provided herein will prove to be correct. Options trading is risky and not appropriate for everyone. Read the Options Disclosure Document ( https://j.moomoo.com/017y9J ) before trading. Options are complex and you may quickly lose the entire investment. Supporting docs for any claims will be furnished upon request. Moomoo is a financial information and trading app offered by Moomoo Technologies Inc. In the U.S., investment products and services on Moomoo are offered by Moomoo Financial Inc., Member FINRA/SIPC. TradingView is an independent third party not affiliated with Moomoo Financial Inc., Moomoo Technologies Inc., or its affiliates. Moomoo Financial Inc. and its affiliates do not endorse, represent or warrant the completeness and accuracy of the data and information available on the TradingView platform and are not responsible for any services provided by the third-party platform.

Perhaps the most important single earnings release of this earnings season is on deck. AI-friendly chipmaker Nvidia NVDA will report earnings this week at a time when many of the artificial-intelligence trade's darlings have come off of their highest valuations. What does NVDA's technical and fundamental analysis say ahead of the report? Let's take a look: Nvidia's Fundamental Analysis What timing! NVDA will unveil fiscal Q2 earnings on Wednesday after the bell in what could be the market's next big thing following AI stocks' recent pullback and Federal Reserve Chairman Jerome Powell's key Jackson Hole speech. Nvidia also recently got the go ahead from the US government to resume exports of certain products to China, and its stock has risen more than 100% since hitting an $86.62 52-week intraday low on April 7. As I write this, analysts expect NVDA to report $1.01 of adjusted earnings per share on about $45.3 billion of revenue. That would be good for about 53% year-over-year growth from fiscal Q2 2025's $30 billion in revenue, as well as a 48.5% increase from the firm's $0.68 in adjusted EPS in the same period last year. Now, many investors would view 53% year-over-year sales growth as enormous for most companies, but that would actually represent a deceleration of y/y growth for Nvidia. That said, the "law of large numbers" argues that the pace at which Nvidia has been increasing year-over-year sales since the surge in AI-based capital-expenditure spending began in earnest is unsustainable. Still, some on Wall Street expect NVDA to stabilize sales growth in the low 50%-ish range for at least a few quarters. A number of very highly rated sell-side analysts have also increased their price targets for Nvidia heading into this week's earnings report. Cantor Fitzgerald's CJ Muse, Joseph Moore of Morgan Stanley, TD Cowen's Joshua Buchalter and John Vinh of KeyBanc have all upped their NVDA target prices in just the past few days. TipRanks rates every one of those four at either four or five stars out of a possible five. The group increased their price targets from an average of $191.25 to an average of $224 vs. the $179.81 that Nvidia closed at on Monday. Nvidia's Technical Analysis Now let's look at NVDA's year-to-date chart as of Aug. 20: We have a very complex chart to take in here. Readers will first note that a "cup-with-handle" pattern (the purple curving line at the chart's center) kicked off Nvidia's April-into-August rally. However, the stock's trend -- illustrated here by a Raff Regression model marked with orange shading -- has been broken to the downside as Nvidia approaches earnings. NVDA also appears to have tested the swing crowd at the stock's 21-day Exponential Moving Average (or "EMA," marked with a green line) and lost that fight. Next up would be the stock's 50-day Simple Moving Average, or "SMA," denoted by the blue line above. It will be very interesting to see if institutional money defends the stock at that level. Keep in mind that key Fibonacci retracement levels also exist at roughly $162 (23.6% retracement) and $147 (38.2% retracement), as denoted by the gray shaded area above. The stock's 50-day SMA is the downside pivot that could pave the way to the stock's even more important 200-day SMA (the red line above at $137.40). Meanwhile, Nvidia's upside pivot would be the stock's recent high near $184. A retake of that level in response to a well-received earnings report could make the above analysts' new target prices suddenly seem very realistic. As for the other technical indicators in the above chart, they're not looking very pretty. Nvidia's Relative Strength Index (the gray line at the chart's top) is sinking like a rock and is trying to hold at a neutral reading. And check out the stock's daily Moving Average Convergence Divergence indicator (or "MACD," marked with black and gold lines and blue bars at the chart's bottom). The histogram of the 9-day EMA (marked with blue bars) is suddenly deeply negative. That's usually a short-term bearish signal. The 12-day EMA (the black line) has also crossed below the 26-day EMA (the gold line). That's also typically a negative signal -- but with both lines still in positive territory, it's not quite as foreboding. (Moomoo Technologies Inc. Markets Commentator Stephen “Sarge” Guilfoyle was long NVDA at the time of writing this column.) This article discusses technical analysis, other approaches, including fundamental analysis, may offer very different views. The examples provided are for illustrative purposes only and are not intended to be reflective of the results you can expect to achieve. Specific security charts used are for illustrative purposes only and are not a recommendation, offer to sell, or a solicitation of an offer to buy any security. Past investment performance does not indicate or guarantee future success. Returns will vary, and all investments carry risks, including loss of principal. This content is also not a research report and is not intended to serve as the basis for any investment decision. The information contained in this article does not purport to be a complete description of the securities, markets, or developments referred to in this material. Moomoo and its affiliates make no representation or warranty as to the article's adequacy, completeness, accuracy or timeliness for any particular purpose of the above content. Furthermore, there is no guarantee that any statements, estimates, price targets, opinions or forecasts provided herein will prove to be correct. The Analyst Ratings feature comes from TipRanks, an independent third party. The accuracy, completeness, or reliability cannot be guaranteed and should not be relied upon as a primary basis for any investment decision. The target prices are intended for informational purposes only, not recommendations, and are also not guarantees of future results. Moomoo is a financial information and trading app offered by Moomoo Technologies Inc. In the U.S., investment products and services on Moomoo are offered by Moomoo Financial Inc., Member FINRA/SIPC. TradingView is an independent third party not affiliated with Moomoo Financial Inc., Moomoo Technologies Inc., or its affiliates. Moomoo Financial Inc. and its affiliates do not endorse, represent or warrant the completeness and accuracy of the data and information available on the TradingView platform and are not responsible for any services provided by the third-party platform.

Apple AAPL will report earnings Thursday at a time when the tech giant has been struggling more than most other "Magnificent Seven" stocks or higher-end, AI-focused companies. What does fundamental and technical analysis say about AAPL heading into the report? Let's see: Apple's Fundamental Analysis Apple was down 14.4% year to date as of Friday's close, while the S&P 500 was up 8.6%. Meanwhile, fellow Mag-7 members Nvidia NVDA and Microsoft MSFT -- the only publicly traded U.S. companies other than Apple with more than a $3 trillion market cap -- are up 29.2% and 21.9%, respectively. AAPL has lagged largely because the consumer-electronics giant has dragged its feet on innovation, as well as on the great chase into the world of generative artificial intelligence. Readers might recall that back in early May, Apple's board increased the firm's dividend payout and authorized a whopping $100 billion share-repurchase program in an attempt to attract investment. But so far, that hasn't seemed to impress Wall Street much. As for Apple's upcoming fiscal Q3 earnings, the Street is looking for the company to post $1.42 a GAAP EPS of $1.42 on some $89 billion of revenue. That would represent 1.4% earnings growth and 3.7% better revenues from the $1.40 EPS on $85.8 billion of revenues that the iPhone maker reported in the same period last year. If this sounds like weak growth, it is. Apple saw 6% year-over-year growth during fiscal Q2 2025, as well as 4.9% in fiscal Q3 2024. In fact, 20 of the 29 sell-side analysts that I found that cover AAPL lowered their earnings estimates lower for the fiscal Q3 since the period began. (Five have boosted their numbers, while four have made no changes.) Apple's Technical Analysis Now let's look at Apple's chart going back to November: Readers will see that the stock appears to be at a crossroads. On one hand, Apple developed a "triple-top" pattern of bearish reversal beginning in early May, as marked with red boxes at the above chart's right. A triple top occurs when a "double-top" pattern fails and a stock retests its resistance from below for a third time. However, we can see at the chart's extreme right that AAPL has just about reached its resistance level for a fourth time. What now? Often when someone knocks on a door often enough, that door will open. Perhaps even more interestingly, we can see that Apple's roughly $215 resistance level (vs. the $213.88 AAPL closed at Friday) appeared at almost precisely the 50% retracement point of the stock's December 2024-April 2025 sell-off. Note that while they're included with most Fibonacci retracement models, 50% retracements aren't true Fibonacci levels. They are their own thing, but just as technically noteworthy. All in, Apple now has two potential upside pivots. One would be the break above the apex of the pattern that's in place. The other would be Apple's 200-day Simple Moving Average (or "SMA," marked with a red line above.) That creates a potentially bullish set-up. Apple could see support from both its 21-day Exponential Moving Average (or "EMA," denoted with a green line above) and from its 50-day SMA (the blue line above). That's likely where we'll find out if professional managers are willing to defend the stock. Meanwhile, Apple's Relative Strength Index (or "RSI," marked with a gray line at the chart's top) is robust, but not in a technically overbought state. Similarly, the stock's daily Moving Average Convergence Divergence indicator (or "MACD," denoted with black and gold lines and blue bars at the chart's bottom), has a bullish look to it, but not overwhelmingly so. The histogram of Apple's 9-day EMA (the blue bars) is above zero, which is historically a short-term positive signal. Additionally, both the 12-day EMA (black line) and 26-day EMA (gold line) are above zero, with the black line above the gold line. That's traditionally a short- to medium-term positive signal as well. Still, it's what happens at that fourth top in the above chart that will likely decide Apple's fate technically. (Moomoo Technologies Inc. Markets Commentator Stephen “Sarge” Guilfoyle had no position in AAPL at the time of writing this column.) This article discusses technical analysis, other approaches, including fundamental analysis, may offer very different views. The examples provided are for illustrative purposes only and are not intended to be reflective of the results you can expect to achieve. Specific security charts used are for illustrative purposes only and are not a recommendation, offer to sell, or a solicitation of an offer to buy any security. Past investment performance does not indicate or guarantee future success. Returns will vary, and all investments carry risks, including loss of principal. This content is also not a research report and is not intended to serve as the basis for any investment decision. The information contained in this article does not purport to be a complete description of the securities, markets, or developments referred to in this material. Moomoo and its affiliates make no representation or warranty as to the article's adequacy, completeness, accuracy or timeliness for any particular purpose of the above content. Furthermore, there is no guarantee that any statements, estimates, price targets, opinions or forecasts provided herein will prove to be correct. Moomoo is a financial information and trading app offered by Moomoo Technologies Inc. In the U.S., investment products and services on Moomoo are offered by Moomoo Financial Inc., Member FINRA/SIPC. TradingView is an independent third party not affiliated with Moomoo Financial Inc., Moomoo Technologies Inc., or its affiliates. Moomoo Financial Inc. and its affiliates do not endorse, represent or warrant the completeness and accuracy of the data and information available on the TradingView platform and are not responsible for any services provided by the third-party platform.

هفته آینده شاهد گزارش سود سه ماهه four از سهام «هفت غول فناوری» بود -- اپل (AAPL)، آمازون (AMZN)، مایکروسافت (MSFT) و متا پلتفرمز (META). بیایید قبل از اعلام نتایج، نگاهی به AMZN بیندازیم. تحلیل بنیادی آمازون به تازگی FactSet گزارش داد که دیدگاه اجماعی تحلیلگران نشان میدهد شرکتهای S&P 500 در سال 2025 شاهد رشد 9.3 درصدی سود بود که نسبت به 9 درصد در سال 2024 افزایش یافته است. اما جالب اینجاست که FactSet همچنین اعلام کرد که رشد سود در بین «هفت غول فناوری» تنها برای سه ماهه دوم به صورت سالانه 14.1 درصد پیشبینی میشود. در مقابل، تحلیلگران تنها 3.4 درصد افزایش سود سالانه را برای 493 شرکت دیگر S&P 500، «کمتر از هفت غول» پیشبینی میکنند. این نشاندهنده تأثیر Mag-7 بر بازار گستردهتر است. در مورد آمازون، تحلیلگران تخمین میزنند که این غول تجارت الکترونیک در سه ماهه دوم 1.32 دلار سود GAAP به ازای هر سهم با تقریباً 162 میلیارد دلار درآمد داشته باشد. این نشاندهنده رشد 4.8 درصدی نسبت به 1.26 دلار سود GAAP به ازای هر سهم در سه ماهه دوم سال 2024 و همچنین رشد 9.5 درصدی نسبت به تقریباً 148 میلیارد دلار درآمدی است که AMZN در مدت مشابه سال گذشته کسب کرد. این برای آمازون به یک هنجار تبدیل شده است، زیرا رشد درآمد در هر یک از four فصل گذشته بین 9 تا 11 درصد بوده است (و پیشبینی میشود برای four فصل آینده نیز در همین محدوده قرار گیرد). اما نکته قابل توجه این است که از بین 34 تحلیلگر فروش که من میتوانم پیدا کنم که AMZN را ردیابی میکنند، 27 نفر از زمان شروع سه ماهه جاری، برآوردهای سود سه ماهه دوم خود را برای این شرکت کاهش دادهاند. (هفت نفر دیگر خلاف جهت شنا کردند و در واقع پیشبینیهای خود را افزایش دادند.) تحلیل تکنیکال آمازون در مرحله بعد، بیایید نمودار AMZN را از حدود شش ماه قبل تا بعد از ظهر سهشنبه بررسی کنیم: این یک نمودار جالب است، با سیگنالهای فنی مثبت و منفی. در جنبه مثبت، این سهام یک الگوی «دوقلوی کف» از برگشت صعودی را مشاهده کرد که در ماه آوریل رخ داد، با یک نقطه محوری 193 دلاری (که در سمت چپ نمودار بالا با عنوان "دوقلوی کف" مشخص شده است). این امر منجر به یک شکست رو به بالا شد که به نظر میرسید شتاب گرفته است، با یک "تقاطع طلایی" که در 7 ژوئیه رخ داد (در سمت راست نمودار مشخص شده است). یک تقاطع طلایی عموماً به عنوان یک الگوی فنی صعودی در نظر گرفته میشود که زمانی رخ میدهد که میانگین متحرک ساده 50 روزه یک سهم (یا "SMA"، که با یک خط آبی در نمودار نشان داده شده است) از بالای یک SMA 200 روزه رو به افزایش (خط red) عبور کند. البته یک مشکل وجود دارد. در حالی که AMZN در نمودار بالا رو به بالا شکسته است، به نظر میرسد که یک الگوی «مثلث صعودی» از برگشت نزولی را ایجاد کرده است که با خطوط مورب بنفش در نمودار بالا مشخص شده است. خوانندگان متوجه شد که این الگو در واقع از پایینترین نقطه دومین کف دوقلو در اواخر آوریل آغاز شد. خط روند بالایی مثلث صعودی در 13 مه فعال شد، اما به نظر میرسد دو خط الگو در حال نزدیک شدن هستند. هنگامی که یک مثلث پس از دو تا سه لمس در هر خط روند بسته میشود (که در اینجا داریم)، حرکت حاصل میتواند انفجاری باشد. با این حال، لزوماً مشخص نیست که یک سهم از آنجا به کدام سمت حرکت کرد - بالا یا پایین. یک مثلث بسته واقعی میتواند به شدت در هر دو جهت منفجر شود، اما همانطور که در بالا ذکر شد، آنچه که ما در آمازون میبینیم یک الگوی برگشت نزولی است. این به من در مورد AMZN تردید میدهد و باعث میشود قبل از اعلام نتایج، نسبت به مشارکت در این سهم محتاطتر باشم. (من در حال حاضر هیچ سهم AMZN ندارم.) در همین حال، شاخص قدرت نسبی آمازون (خط خاکستری در بالای نمودار) قوی به نظر میرسد، اما به هیچ وجه به طور فنی در منطقه خرید بیش از حد قرار ندارد. با این حال، اندیکاتور روزانه همگرایی/واگرایی میانگین متحرک سهام (یا "MACD"، که با خطوط سیاه و طلایی و نوارهای آبی در پایین نمودار مشخص شده است) اصلاً چیز زیادی به ما نمیگوید. هیستوگرام میانگین متحرک نمایی 9 روزه آمازون (یا "EMA"، که با نوارهای آبی مشخص شده است) تقریباً در محدوده صفر مسطح شده است، در حالی که EMA 12 روزه (خط سیاه) در راستای EMA 26 روزه (خط طلایی) در حال حرکت است. در حالی که هر دو خط بالاتر از صفر در حال حرکت هستند، مهم است که کدام یک در نهایت در بالا قرار میگیرد. در کوتاه مدت تا میان مدت، گاوها برای خط سیاه ریشه میدوانند، در حالی که خرسها امیدوارند که خط طلایی بتواند در بالا قرار گیرد. (استفان "سارج" گیلفویل، مفسر بازارهای Moomoo Technologies Inc.، در زمان نوشتن این مقاله هیچ موقعیتی در AMZN نداشت.) این مقاله به تحلیل تکنیکال میپردازد، سایر رویکردها، از جمله تحلیل بنیادی، ممکن است دیدگاههای بسیار متفاوتی ارائه دهند. نمونههای ارائه شده فقط برای اهداف نمایشی هستند و نباید نشاندهنده نتایجی باشند که میتوانید انتظار داشته باشید. نمودارهای امنیتی خاص استفاده شده فقط برای اهداف نمایشی هستند و توصیهای برای فروش یا پیشنهاد فروش، یا درخواست پیشنهاد برای خرید هیچ امنیتی نیستند. عملکرد سرمایهگذاری گذشته نشاندهنده یا تضمینکننده موفقیت در آینده نیست. بازده متفاوت بود و همه سرمایهگذاریها دارای ریسکهایی از جمله از دست دادن اصل سرمایه هستند. این محتوا همچنین یک گزارش تحقیقاتی نیست و نباید به عنوان مبنایی برای تصمیمگیری سرمایهگذاری تلقی شود. اطلاعات موجود در این مقاله مدعی توصیف کامل اوراق بهادار، بازارها یا تحولات ذکر شده در این مطلب نیست. Moomoo و شرکتهای وابسته آن هیچ گونه اظهار یا ضمانتی در مورد کفایت، کامل بودن، دقت یا به موقع بودن مقاله برای هیچ هدف خاصی از محتوای فوق ارائه نمیدهند. علاوه بر این، هیچ تضمینی وجود ندارد که هیچ یک از اظهارات، تخمینها، اهداف قیمت، نظرات یا پیشبینیهای ارائه شده در اینجا درست از آب درآیند. Moomoo یک برنامه اطلاعات مالی و معاملاتی است که توسط Moomoo Technologies Inc ارائه میشود. در U.S.، محصولات و خدمات سرمایهگذاری در Moomoo توسط Moomoo Financial Inc ارائه میشوند که عضو FINRA/SIPC است. TradingView یک شخص ثالث مستقل است که به Moomoo Financial Inc.، Moomoo Technologies Inc. یا شرکتهای وابسته آن وابسته نیست. Moomoo Financial Inc. و شرکتهای وابسته آن کمال و صحت data و اطلاعات موجود در پلتفرم TradingView را تأیید، نمایندگی یا ضمانت نمیکنند و مسئولیتی در قبال خدمات ارائه شده توسط پلتفرم شخص ثالث ندارند.

The S&P 500 SPX has made a series of new all-time closing and intra-day highs in recent days as Wall Street staged a remarkable comeback from the April lows that followed President Donald Trump's announcement of "Liberation Day" tariffs. Does fundamental and technical analysis say the key index could go higher from here ... or pull back? Let's check it out: The S&P 500's Fundamental Analysis The SPX fell more than 21% intraday in less than seven weeks between its Feb. 19 peak and its April 7 low as Trump rolled out his plan for big tariffs on foreign imports. Many investors feared that high import duties -- coupled with foreign retaliatory tariffs on American exports -- would boost U.S. inflation and unemployment at the same time, creating "stagflation." But about a week after Trump rolled out the "Liberation Day" tariffs on April 2, the president paused much of the plan for 90 days to allow for trade talks with other countries. Risk-on assets quickly started to come back as Wall Street began to think deals with trading partners might blossom. So far, only the United Kingdom, China and Vietnam have played ball, but that's been good enough for many investors. Meanwhile, consumer-level U.S. inflation has largely been beaten back (at least for now), and Trump has had other economic victories as well. For example, his "Big, Beautiful Bill" of tax cuts and spending changes recently passed into law, offering what many see as multiple pro-growth provisions. True, the Congressional Budget Office warned that the Big, Beautiful Bill could add some $3.3 trillion to the U.S. government's already huge deficits over the next decade. However, the agency's projections didn't include $2.8 trillion of expected revenues over the next 10 years from Trump's tariffs. The CBO also chose to model almost no economic growth over the next decade, which probably isn't very realistic. Of course, it's still unclear whether Wall Street has already priced in all of the "Big, Beautiful Bill" potential positives, or whether the measure's tax cuts and deregulation will have their desired economic effects. Similarly, we don't know whether there are any more bilateral trade deals around the corner, or whether the Federal Reserve will soon cut interest rates -- which could boost stocks by making bond and money-market yields less attractive. The S&P 500's Technical Analysis Now let's look at the SPX's chart going back some four months and running through midday Tuesday: Readers will see that the S&P 500 has been in a clear uptrend for the past three months, as denoted by the orange- and purple-shaded areas above. The index has colored neatly within the lines, finding support at the lower trendline in mid-June. Additionally, support came at the S&P 500's 21-day Exponential Moving average, or "EMA, marked with a green line above. More recently, the S&P 500 also enjoyed the benefits of what we call a "golden cross." That's when the index's 50-day Simple Moving Average (or "SMA," marked with a blue line) crosses above a rising 200-day SMA (marked with a red line). That's historically a bullish technical signal for the index. The S&P 500 also experienced "Day One" bullish reversals on May 27 and June 23. Those "Day Ones" were then confirmed on June 3 and June 26, respectively. A "Day One" reversal occurs when an index reversed direction up or down on increased trading volume, followed by a "Confirmation Day" that moves the market in the same direction as the reversal on increased volume as well. That combination typically signifies changes in an index's short-term trend. Now, astute readers might notice that the S&P 500's June 23 "Day One" reversal occurred on decreased day-over-day trading volume. However, that's misleading because the market day just prior to June 23 was a "triple-witching" day, which technical analysts therefore discard. Readers should also understand that there must be at least a one-day pause between a "Day One" reversal and a "Confirmation Day." Otherwise, technical analysts will consider both days to represent one move, and we wouldn't have a volume-based technical confirmation. Next, let's look at the SPX's chart going back to January and running through midday Tuesday: This chart shows that the S&P 500 is in danger of putting in what's called a "Double Top" pattern of bearish reversal, denoted with the red boxes above marked "Top 1" and "Top 2." With all that's going on politically and geopolitically, that's a concern. On top of that, Q2 earnings season begins next week, and analysts' consensus is for rather paltry 5% year-over-year earnings growth for the S&P 500 component companies as a whole. In addition, the S&P 500 has a conflicting Relative Strength Index ("RSI") and Moving Average Convergence Divergence indicator (or "MACD"). The index's RSI, marked with gray lines at the above chart's top, is practically at technically overbought levels. But at the same time, the daily MACD (marked with black and gold lines and blue bars at the chart's bottom) is showing signs of weakness. The histogram of S&P 500's 9-day EMA (the blue bars) is now below the zero-bound, which is historically a short-term bearish technical signal. On top of that, the 12-day EMA (the black line) is threatening to cross under the 26-day EMA (the gold line). This hasn't happened yet, but would be a short-term bearish signal if it did. Add it all up and the S&P 500 is showing a mixed technical picture right now despite trading at or close to all-time record highs. (Moomoo Technologies Inc. Markets Commentator Stephen “Sarge” Guilfoyle had no position in S&P 500-related ETFs or mutual funds at the time of writing this column.) This article discusses technical analysis, other approaches, including fundamental analysis, may offer very different views. The examples provided are for illustrative purposes only and are not intended to be reflective of the results you can expect to achieve. Specific security charts used are for illustrative purposes only and are not a recommendation, offer to sell, or a solicitation of an offer to buy any security. Past investment performance does not indicate or guarantee future success. Returns will vary, and all investments carry risks, including loss of principal. This content is also not a research report and is not intended to serve as the basis for any investment decision. The information contained in this article does not purport to be a complete description of the securities, markets, or developments referred to in this material. Moomoo and its affiliates make no representation or warranty as to the article's adequacy, completeness, accuracy or timeliness for any particular purpose of the above content. Furthermore, there is no guarantee that any statements, estimates, price targets, opinions or forecasts provided herein will prove to be correct. Moomoo is a financial information and trading app offered by Moomoo Technologies Inc. In the U.S., investment products and services on Moomoo are offered by Moomoo Financial Inc., Member FINRA/SIPC. TradingView is an independent third party not affiliated with Moomoo Financial Inc., Moomoo Technologies Inc., or its affiliates. Moomoo Financial Inc. and its affiliates do not endorse, represent or warrant the completeness and accuracy of the data and information available on the TradingView platform and are not responsible for any services provided by the third-party platform.

Amazon AMZN has been reducing its exposure to U.S. tariffs on Chinese imports recently, and is also possibly slowing down its AI-related infrastructure purchases as the online-retail giant prepares to report Q1 earnings next week. What does fundamental and technical analysis say could happen next for the stock? Let’s check it out: Amazon’s Fundamental Analysis AMZN plans to release its earnings after the bell next Thursday (May 1) in the middle of an interesting period for the company. Published reports recently indicated that Amazon has been canceling orders from some Chinese vendors in a bid to avoid the Trump administration’s new 145% tariffs on the Asian nation’s goods. After all, Amazon would be the "importer of record" for items purchased at the wholesale level, and that’s who actually gets Uncle Sam’s tariff bills. Of course, the tariff situation remains murky, as the Trump administration appeared this week to seek a de-escalation of its trade wars with China and other countries. Meanwhile, Wells Fargo this week released a research note implying that Amazon could possibly become the second hyper-scaler to slow down on AI-related infrastructure purchases. The report posited that AMZN has put some leasing discussions for the co-location of its data centers on hold. If true, that would make Amazon the second hyper-scaler to ease AI-focused capital-expenditure spending, following the lead of its key cloud competitor Microsoft MSFT . However, TD Cowen published its own research note on Monday that offered a potentially different explanation of what's going on at Amazon. Cowen agreed that AMZN has been walking away from some co-location deals, but argued that the change stems from Amazon shifting to a preference for operating its data centers on company-owned properties. Cowen noted that Amazon “continues to move ahead with powered shells and self-builds." The firm also pointed out that other major hyper-scalers Meta Platforms META , Alphabet GOOG GOOGL and Oracle ORCL haven’t shown any signs of slowing down their collective appetite for securing increased capacity through co-location. In fact, Amazon CEO Andy Jassy recently wrote in his annual letter to shareholders that generative AI “is going to reinvent virtually every customer experience we know and enable altogether new ones about which we've only fantasized.” He also said that’s why Amazon’s Amazon Web Services cloud business is “quickly developing the key primitives (or building blocks) for AI development.” Jassy said those efforts includes such things as “custom silicon AI chips in Amazon Trainium to provide better price-performance on training and inference, highly flexible model-building and inference services in Amazon SageMaker and Amazon Bedrock, our own frontier models in Amazon Nova to provide lower cost and latency for customers’ applications and agent creation and management capabilities." Hmm, does that sound like a CEO who’s cutting back on AI investment? Not to me. Jassy did say that chips or GPUs are the reason why Amazon’s AI investments are so expensive, but added that those costs should be headed lower in the future. Why? Because the firm's own Trainium2 chips offer performance that is 30% to 40% better in some ways than what the firm is purchasing from exterior providers. That might not be so great for Nvidia NVDA , but it doesn't sound like a problem for Amazon. All in, the Street is looking for Amazon to report about $1.36 of Q1 GAAP earnings per share on roughly $155 billion of revenue. That would represent a 38.8% EPS gain compared to the company’s year-ago results of $0.98, as well as more than 8% y/y growth in revenues. While many investors would view such year-on-year growth as reflecting a solid quarter, that would also mark a deceleration of growth rates for Amazon. After all, the company hasn’t seen less than 8.5% y/y sales growth for any single quarter since Q2 2022. I also don't know if Amazon will issue any forward guidance given our current environment of unclear tariff policies. Amazon’s Technical Analysis Now let’s check out AMZN’s chart going back some seven months: Readers will first see a sloppy-looking “head-and-shoulders” pattern that formed over recent months, marked with purple boxes above. That appeared to point to a bearish reversal. In fact, that’s exactly what happened to Amazon, leading to a sell-off that bottomed out in early April at close to $161. But interestingly, this pattern seems to have since morphed into a potentially bullish small “double-bottom” pattern (the black diagonal lines at right) that shows a $191 pivot at its conclusion. (AMZN was trading at $186.92 Friday morning.) Amazon also appears to have suffered a so-called "death cross" in recent days without being adversely impacted. A “death cross” occurs when a stock’s 50-day Simple Moving average (or “SMA,” marked with a blue line above) crosses below its 200-day SMA (marked with a red line above). This is historically a bearish signal -- but anecdotally, I’ve noticed that to be true less and less often with stocks of late. Meanwhile, readers will notice that Amazon’s Relative Strength Index (the gray line at the chart’s top) is neutral, although rising. Separately, the stock’s daily Moving Average Convergence Divergence indicator (or “MACD,” marked with gold and black lines and blue bars at the chart’s bottom) is postured rather bullishly. True, Amazon’s 12-day Exponential Moving Average (or “EMA,” marked with a black line) and 26-day EMA (the gold line) are both below zero. That’s historically a bearish signal. But on the positive side, that 12-day line is above the 26-day line, which is typically bullish. The histogram of Amazon’s 9-day EMA (the blue bars above) has also moved above the zero bound, which is also often a bullish sign. (Moomoo Technologies Inc. Markets Commentator Stephen “Sarge” Guilfoyle had no position in AMZN at the time of writing this column.) This article discusses technical analysis, other approaches, including fundamental analysis, may offer very different views. The examples provided are for illustrative purposes only and are not intended to be reflective of the results you can expect to achieve. Specific security charts used are for illustrative purposes only and are not a recommendation, offer to sell, or a solicitation of an offer to buy any security. Past investment performance does not indicate or guarantee future success. Returns will vary, and all investments carry risks, including loss of principal. This content is also not a research report and is not intended to serve as the basis for any investment decision. The information contained in this article does not purport to be a complete description of the securities, markets, or developments referred to in this material. Moomoo and its affiliates make no representation or warranty as to the article's adequacy, completeness, accuracy or timeliness for any particular purpose of the above content. Furthermore, there is no guarantee that any statements, estimates, price targets, opinions or forecasts provided herein will prove to be correct. Moomoo is a financial information and trading app offered by Moomoo Technologies Inc. In the U.S., investment products and services on Moomoo are offered by Moomoo Financial Inc., Member FINRA/SIPC. TradingView is an independent third party not affiliated with Moomoo Financial Inc., Moomoo Technologies Inc., or its affiliates. Moomoo Financial Inc. and its affiliates do not endorse, represent or warrant the completeness and accuracy of the data and information available on the TradingView platform and are not responsible for any services provided by the third-party platform.

Nvidia NVDA soared nearly 20% Wednesday before pulling back some later in the week, leaving the stock down roughly 25% over the past six months. Where does technical and fundamental analysis say the chip giant’s stock could go from here? Let’s take a look: Nvidia’s Fundamental Analysis Nvidia got a huge boost Wednesday from the Trump administration's decision to pause the tariffs it planned to impose on most nations’ U.S.-bound exports. Instead, the White House decided to delay most tariffs on countries other than China for the next 90 days while it conducts trade negotiations with some 70 nations. As an added benefit for Nvidia, the president's team separately paused an expected export ban that would have prohibited Nvidia from shipping its high-end H20 GPUs to China. Now, I don't know how many of these chips Nvidia would really sell to Beijing, as both nations recently placed almost prohibitive tariffs on each other's exports. But the market had probably already largely priced in the H20 export ban, which is now not moving ahead. The sale of these chips to Chinese customers in all likelihood remains legal. Nvidia's publicly known Chinese customers for those chips include such well-known names as Alibaba BABA , Tencent TCEHY and privately held ByteDance. All of those three have placed large H20 orders this year. As for earnings, Nvidia won’t report fiscal Q1 results until probably May’s last week. However, the firm posted fiscal Q4 numbers in February that showed 82% year-over-year earnings growth on 72% y/y revenue gains. While those are big percentage increases, they nonetheless marked a deceleration from prior quarters’ y/y gains. Similarly, management’s latest forward sales guidance remains strong, but also reflects a continuance of this year-over-year percentage deceleration. The company’s midpoint projection calls for $43 billion in fiscal Q1 revenue, which would amount to about a 65% year-on-year revenue gain. NVDA also guided fiscal Q1 GAAP gross margin to 70.6% and adjusted gross margin at 71%, plus or minus 50 basis points. That was just a touch below analysts’ consensus view at the time. All in, the Street is looking for Nvidia to report $0.88 in GAAP earnings per share for its current quarter, as well as $0.93 in adjusted EPS and $43.3 billion in revenues. That would represent an 52.5% gain from the year-ago quarter’s $0.61 in adjusted EPS, while also reflecting 64% in year-over-year sales growth. This would beat of the firm's own guidance, as 25 of the 32 sell-side analysts that I can find that cover Nvidia have increased their estimates for the quarter since it began. (Seven have cut their forecasts.) Technically Speaking Now let’s check out NVDA’s chart going back to last September and running through midday on Thursday (April 10): Readers will see that NVDA recently came out of a so-called “double top” pattern of bearish reversal that spanned from last October into early January, as marked with the “Top 1” and “Top 2” red boxes above. However, the stock trended lower from that point on, as I capture above within the confines of an Andrews' Pitchfork model. Though the chipmaker’s stock has at times pierced both the pitchfork’s upper and lower trendlines, it hasn’t broken out in either direction so far. Even after NVDA’s 18.7% one-day rally on Wednesday, the stock immediately gave back its 21-day Exponential Moving Average (or “EMA,” marked with a green line above) on the very next day. The stock also remains well below both its 50-day Simple Moving Average (or “SMA,” denoted by a blue line) and its 200-day SMA (marked with a red line). This means that in all likelihood, Nvidia might very well remain an instrument of short-term trading rather than long-term investing. After all, portfolio managers generally don’t like to carry a lot of exposure below those two moving averages. As for Nvidia’s other technical indicators, the stock’s Relative Strength Index (or “RSI,” marked with a gray line at the chart’s top) remains unimpressive. Similarly, the company’s daily Moving Average Convergence Divergence indicator (or “MACD,” marked with the black and gold lines and blue bars at the chart’s bottom) looks bearish. All of its three components -- the histogram of the 9-day EMA (the blue bars), the 12-day EMA (the black line) and the 26-day EMA (the gold line) -- are below zero. That’s usually a bearish technical indicator. From where I stand, Nvidia’s upside pivot is the stock’s 50-day Simple Moving Average (or “SMA,” marked with a blue line and currently at around $119.30 vs. NVDA’s $107.57 close Thursday). Meanwhile, if the stock can hold its 21-day EMA (the green line above, currently at about $109.90) that could get the swing-trading crowd on board. However, a failure to hold there would likely make the odds of attracting capital flows from portfolio managers pretty weak. (Moomoo Technologies Inc. Markets Commentator Stephen “Sarge” Guilfoyle had no position in NVDA at the time of writing this column.) This article discusses technical analysis, other approaches, including fundamental analysis, may offer very different views. The examples provided are for illustrative purposes only and are not intended to be reflective of the results you can expect to achieve. Specific security charts used are for illustrative purposes only and are not a recommendation, offer to sell, or a solicitation of an offer to buy any security. Past investment performance does not indicate or guarantee future success. Returns will vary, and all investments carry risks, including loss of principal. This content is also not a research report and is not intended to serve as the basis for any investment decision. The information contained in this article does not purport to be a complete description of the securities, markets, or developments referred to in this material. Moomoo and its affiliates make no representation or warranty as to the article's adequacy, completeness, accuracy or timeliness for any particular purpose of the above content. Furthermore, there is no guarantee that any statements, estimates, price targets, opinions or forecasts provided herein will prove to be correct. Moomoo is a financial information and trading app offered by Moomoo Technologies Inc. In the U.S., investment products and services on Moomoo are offered by Moomoo Financial Inc., Member FINRA/SIPC. TradingView is an independent third party not affiliated with Moomoo Financial Inc., Moomoo Technologies Inc., or its affiliates. Moomoo Financial Inc. and its affiliates do not endorse, represent or warrant the completeness and accuracy of the data and information available on the TradingView platform and are not responsible for any services provided by the third-party platform.

EV maker Tesla TSLA is perhaps the most controversial stock in U.S financial markets right now. Sales appear to be slowing, while CEO Elon Musk's position as a Trump administration adviser has led political opponents to attack Tesla vehicles, dealerships and even some vehicle owners. TSLA popped 11.9% on Monday (March 24), but has generally been sinking for months. What does technical and fundamental analysis say might happen next? Let's dig in and see what we find: Tesla’s Fundamental Analysis TSLA rose almost 95% in the roughly seven weeks between Donald Trump’s November election victory and the stock’s $488.54 all-time intraday high on Dec. 18. After all, Musk’s close ties to Trump seemed to point to good times ahead for the company. However, the stock’s price has been in decline ever since then, while vandalism of Tesla vehicles by Trump opponents has made owning or one a slightly risky affair. As of this writing, TSLA was down 32.2% year to date and 44% from the stock's Dec. 18 peak. Beyond politics, a lot of this had to do with the reality that demand for electric vehicles might have hit something of a saturation point, at least for now. There’s also been a tremendous increase in competition in recent years for electric-vehicle purchases or leases. Volkswagen VWAGY has ramped up its EV efforts, while China is absolutely full of homegrown competitors like BYD BYDDF , Nio NIO and XPeng XPEV . All in, Tesla’s vehicle sales have slackened not just in America, but also in Europe and China. But to be fair, Ford F , General Motors GM and Rivian RIVN have all hit slowdowns in EV sales as well. Still, add it all up and Wall Street is looking TSLA to report Q1 results in May that include $0.47 of adjusted earnings per share on $22.9 billion of revenue. That would represent 4.4% larger earnings and about 7.5% higher revenues when compared to last year’s Q1, where Tesla reported $0.45 of adjusted EPS on $21.3 billion in revenues. However, all 13 sell-side Tesla analysts that I can find have revised their quarterly estimates lower since current quarter began. On the bright side, the automaker’s operating and free cash flows have remained strong for the past three quarters. The firm ended 2024 with some $36.6 billion in cash against a $13.6 billion total debt load. That’s what many would consider a strong balance sheet that could sustain Tesla’s operations for a time if need be. Tesla’s Technical Analysis A look at Tesla’s one-year chart shows that while the stock has been falling since December, it still managed to make a stand technically in recent days: The purple line at right in the above chart shows that TSLA found support twice in March very close to $212.30. That’s the 78.6% Fibonacci retracement level of the stock’s entire April 2024 to December 2024 run. That purple line also shows indicates that Tesla has formed a small “double bottom” pattern of what could be a bullish reversal at the Fibonacci support level, and that the stock has since tried to rally from there. TSLA was also able to recently take back its 21-day Exponential Moving Average (or “EMA,” denoted by the green line above). However, the stock appears to have hit resistance at the 200-day Simple Moving Average (or “SMA,” marked above with a red line). That makes the 200-day SMA the stock's likely new pivot point. A retaking of the 200-day SMA would allow for increased target prices. Conversely, a retest and loss of Tesla’s 78.6% Fibonacci retracement level could permit a further decline. Meanwhile, Tesla’s Relative Strength Index (the gray line in the above chart’s top) has mostly improved recently and now stands in neutral territory. Similarly, the stock’s daily Moving Average Convergence Divergence indicator -- or “MACD,” denoted by the black and gold lines and blue bars at the chart’s bottom -- is in a less-awful place than it was earlier this year. The histogram of Tesla’s 9-day Exponential Moving Average (or “EMA,” denoted by the blue bars at the chart’s bottom) is now above zero. That’s historically a short-term bullish sign. Similarly, the stock’s 12-day EMA (the black line at the bottom) is now above its 26-day EMA (the gold line). That’s typically somewhat positive, but both of those lines are still below zero -- which is historically a negative signal. (Moomoo Technologies Inc. Markets Commentator Stephen “Sarge” Guilfoyle had no position in TSLA at the time of writing this column.) This article discusses technical analysis, other approaches, including fundamental analysis, may offer very different views. The examples provided are for illustrative purposes only and are not intended to be reflective of the results you can expect to achieve. Specific security charts used are for illustrative purposes only and are not a recommendation, offer to sell, or a solicitation of an offer to buy any security. Past investment performance does not indicate or guarantee future success. Returns will vary, and all investments carry risks, including loss of principal. This content is also not a research report and is not intended to serve as the basis for any investment decision. The information contained in this article does not purport to be a complete description of the securities, markets, or developments referred to in this material. Moomoo and its affiliates make no representation or warranty as to the article's adequacy, completeness, accuracy or timeliness for any particular purpose of the above content. Furthermore, there is no guarantee that any statements, estimates, price targets, opinions or forecasts provided herein will prove to be correct. Moomoo is a financial information and trading app offered by Moomoo Technologies Inc. In the U.S., investment products and services on Moomoo are offered by Moomoo Financial Inc., Member FINRA/SIPC. TradingView is an independent third party not affiliated with Moomoo Financial Inc., Moomoo Technologies Inc., or its affiliates. Moomoo Financial Inc. and its affiliates do not endorse, represent or warrant the completeness and accuracy of the data and information available on the TradingView platform and are not responsible for any services provided by the third-party platform.
سلب مسئولیت
هر محتوا و مطالب مندرج در سایت و کانالهای رسمی ارتباطی سهمتو، جمعبندی نظرات و تحلیلهای شخصی و غیر تعهد آور بوده و هیچگونه توصیهای مبنی بر خرید، فروش، ورود و یا خروج از بازار بورس و ارز دیجیتال نمی باشد. همچنین کلیه اخبار و تحلیلهای مندرج در سایت و کانالها، صرفا بازنشر اطلاعات از منابع رسمی و غیر رسمی داخلی و خارجی است و بدیهی است استفاده کنندگان محتوای مذکور، مسئول پیگیری و حصول اطمینان از اصالت و درستی مطالب هستند. از این رو ضمن سلب مسئولیت اعلام میدارد مسئولیت هرنوع تصمیم گیری و اقدام و سود و زیان احتمالی در بازار سرمایه و ارز دیجیتال، با شخص معامله گر است.