holeyprofit
@t_holeyprofit

تریدر چه نمادی را توصیه به خرید کرده؟
سابقه خرید
تخمین بازدهی ماه به ماه تریدر
پیام های تریدر
فیلتر
نوع پیام
holeyprofit
Looking at Examples of 4.23 Breaks
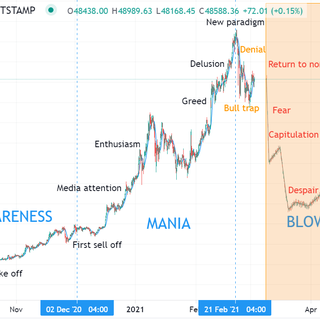
If markets continue to make shallow dips and rally higher, or even if there's a big sell off and false break of the lows that makes a V recovery then we're seeing a whole lot of things up-trending above massive inflection points. In this post I want to show you some different examples of what has happened on 4.23 breaks. The 4.23 level is a very high probability level to trade off. Even on an intra day basis this will most often have at least reactions and can have full reversals off it. You can see in the SPX chart that the 2022 top came off the 4.23. When a 4.23 is going to be a reversal level it will often react to the 4.23 spike it out. Come back under and hold a retest. Forming a head and shoulders pattern with 4.23 as the shoulders. That setup when successful is a fatal setup for the trend. When inside the 4.23 head fake you're inside the end of the trend. Interestingly, not only is SPX at this 4.23 level but so are lots of other things. Bitcoin is, for example. BTC is often a good proxy for risk on/off so it's interesting this is at this big decision level along with SPX is interesting. In the 4.23 reversal the rejection of rallies can be so strong and abrupt there's not a chance to do anything during it. You really have to think about it in advance. But if the 4.23 break it's extremely easy to the upside for the foreseeable future. Let's start with looking at the different 4.23 decisions in AAPL over the years. This first one shows how the head fakes can be the end of rallies. This correcting relatively shallow compared to the full risk. Holding the 2.61. From this pullback and 4.23 break AAPL went up 200% without any sizable pullbacks. Advancing to the further swing. In this one AAPL began to go parabolic in the run to the 4.23. Got a bit above it. Crashed back to it. Held retests and then went into a big boom move. Almost every week closed higher in this period which continued until over 100% above the 4.23. We advance the swing again and ... what's the chances? AAPL last top is 4.23 and now we're retesting the 4.23. Now ... there are different things that can happen. But if you were to assume the 4.23 pattern in AAPL continues it'd have to do this. And if you believe that is possible (and it's possible) then the SPX chart in the OP makes a lot of sense, right? Expecting BTC would do this would be obvious if indices made that move. Look at NVDA. To overlook the risks of rejection would be fatal if wrong (this could be a simple head and shoulders like pattern) but viewed through the lens of a 4.23 pullback this would have a hyper bullish forecast to it. Over and over again you can make this case for things doubling without any major pullbacks. Candle after candle up-trends. It would not be a time to be a bear! Here's a look left on NVDA. If you had fibs from the crash range here was the 4.23 decision. We could be somewhere like here in NVDA. These are things you certainly have to respect the risk of as an active shorter of things. It'd not be good. And they're such massive outsized opportunities if they form like this that it'd be insane to not prep for what to do in this. If week after week after week is closing green and we never trade under the last week - a smart trader can build a massive position in that. Think about the positions you could build in these periods where the market never crosses your entry again. And then wait and start to trail stops when it goes parabolic. During this period there will be 10% jumps up and the trend of shallow pullbacks will continue. Carrying a bear bias into this would be bad because although the trend never breaks there a enough pullbacks to mean you can easily end up bearish in the worst rally zones. If betting on things like bull traps/spike outs. These moves above the 4.23 are very common. A sharp doubling of the trend happens above the 4.23 a lot! If SPX is going to break it and have the common reaction - everything is going vertical. There are lots of things that are at the 4.23 zones now and you can add 100% onto the 4.23 and think it's probable it will get to there and head fake over it a bit. 100% should be a fairly "Safe" target for the 4.23 break. More speculative ideas would be to look for things that are currently down a lot and draw a fib from the high to the low of those. If we enter into a mania condition where indices are up every week then we might see mania in the hyper speculative things that were in favour previously. Example; Not think this sort of thing works on doge? We have a current 4.23 top and a drop to the 1.27. That's the full predicted correction off a 4.23. It's not always the bottom - but this is the target for a 4.23 drop. Doge may have completed a full 4.23 cycle and be heading into the next. Absolutely possible. If that were true, this would be set to begin to trend very hard. The consideration has to be what if SPX is here. It'd be fair to say the odds of this are low but how high would they have to be to make it worth considering? People act as if the idea of considering massive downside risk means you're scared to take upside risk. Which isn't the case. If anything, I am advocating for more aggressive upside risk betting on the solid trend continuation with tight trailing stops if the breakout is made. Inside the area where we have most chance of a pullback in an uptrend and a wipe out top in a reversal I'm extremely aware of what those risks might look like, but I won't be "Side lined" in a breakout. It means I don't want to broke if the extreme risk thing happens. Indices could more than double or more than half off the 4.23 decision. We're in a really interesting time. If we break I plan to trade as if we're going to be up and up every week. Only take long setups. Maybe have a few macro short levels along the way but be mainly a perma bull. If we get the consistent buying weeks I'll expect all dips will be bought and the uptrend will turn into a parabolic run, I'll act accordingly. And if we start to get massive 10 - 20% weekly candles somewhere over 10,000, I'll suspect that may be blow off action and start to think about fading. By this time we'll be at the next set of important fib levels and I'll use a very similar form of analysis. If you use any half decent trend strategy with a stop loss you really can't lose money in a typical 4.23 breakout. Even those mindlessly buying with no downside control can run up a lot (although it's questionable if they get to keep it or not). The fact this is a possible outcome for bears if the resistances fail at this level is something I think macro bears should consider, deeply. Because you don't have to "Be wrong" for this to happen. If your thesis this is all a big stinking bubble - your biggest risk isn't you're wrong, it's you're right! And we're inside the bubble. Not at the end of it. Bubbles FREQUENTLY double into their end points. This would be a major opportunity for any who embraced it. I do think seeing this happen would be warning things were going to get ugly later but the money to be made in the 5000 - 10,000 run would be exceptional. Accumulating intra day/week with trailing stops would probably see you hit trailing stops about three times most of them you getting in lower and you could end up making 1.000% for the 100% the market went up - and do this while keeping risk capped low since you're always trailing stops to lock in profit. The opportunity isn't in the price forecast/% as such. It's more in the fact that if it is right it should be evidenced by those periods of extremely consistent trend. These will go on for a long time. Be interrupted. Chop / drop and then resume. The amount you can make in those types of trends if you expect them is off the page. And it'd be easy. There's a few times it'd be tricky and these can be deal with by simply waiting - because later it will be easy. What makes this all the more important to consider for bears I think is the fact that we could say the highest probability way that SPX makes this move is by dumping under the last low to retest the 4.23 first. Which would feel very bearish. Very "I should sell the rip" ish. The move that this would make is one I already have marked in as a warning that we could end up going significantly lower. I have to understand all those conditions could fill and even although it all looks exactly like a bear setup, it's actually a 4.23 retest. Very different things for the next swing. Every major high and low in SPX during the last decade has interacted with the fibs from the 2008 low. They've marked out the highs/lows better than anything else. We're now at the most important one of those. It hit in 2022 and since then we've been inside the suspense period of it. The 4.23 reaction didn't tell us all that much. A 4.23 spike out doesn't tell us all that much. Both of these things happen in the bull and bear moves. But the actual decision after the attempt to break 4.23 matters a lot. Whatever happens here is likely to be the most pivotal decision point so far.
holeyprofit
Bear Case Requires Downtrend Action. Strong Bull Bias Otherwise.
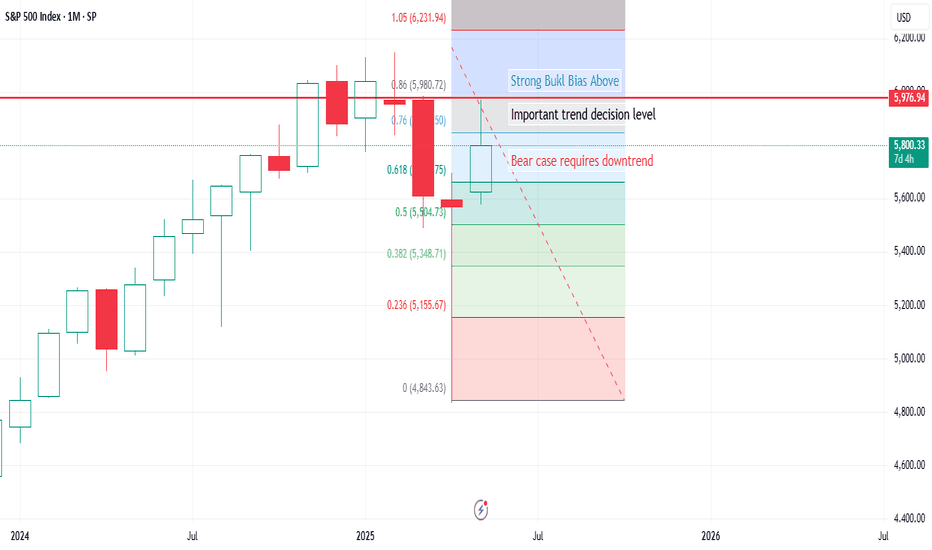
With the recent breaks the odds are strongly towards 5500 hitting and if that breaks the odds are greatly for far lower hitting but I want to take some time to make sure I am clear on the binary nature of where we are. The market is in a "Might go up, might go down" spot. Probably won't go sideways for long. I think we're probably going to see strong trends coming out of whatever decision is made here. First thing I want to really drill in for my bear friends is a sell off from the 86 means nothing at all. Most of the time this is a bear trap. We have broken the first level it may have bottomed so the bias is strongly towards the next ones hitting but having a strong bear bias at this point in historic SPX setup would have led you into a lot of trouble most of the time. If you fade trends the thing you always have to be worrying about is you've got this "pretty much" right but you're actually one swing too early. Because when that happens, the last swing is always exceptionally strong. Fading trends is hard because if you're wrong it trends against you and if you're 95% right it spikes against you in the most ruthless of ways. What makes this all the worse is that comes off a correction in the trend so you end up with a bigger zone in which you're wrong. For example if we began to rally here there's now about 4% extra you could be wrong while saying we're still inside the last high. Any time you're fading a trend and it's going well you should think of this risk. You have to map in the risk of a 161 head fake. These happen a lot. A common thing in blow offs. If you're right about the reversal after this move the short will be easy - but it's not easy to take if you're short bias into it. Given the broader context of everything, I don't think I favour the 1.61 head-fake being the outcome if we rally. If we rally again then we're seeing prolonged big chart trending action above the macro 4.23 and I've only ever seen trends getting stronger when they can break a 4.23. If the 1.61 breaks we can end up at the 4.23 - which would be a monster move. The instance of a 4.23 hitting from a 50% crash are extremely rare. Every instance of it there has been in indices has led to a massive trend decision. All instances of bubbles tend to have clear changes in their momentum when breaking 4.23 fibs. SPX is already above the 4.23 fib. The bear thesis has it this is a head-fake of that. It needs to be evidenced by a strong rejection of the head-fake. Earlier I mentioned the tendency of 1.61 head-fakes. This was the most recurring big obvious topping signal I found when looking at crashes. We'd usually dummy drop and then make a 1.61 spike out. This is the rule I use to tell a pending false breakout from a breakout. If it breaks the 1.61, I expect it will get at least very close to the 2.20. If it can not break the 1.61, then there's a strong chance it may be topping. Our current top is on the 1.61 hit and we're now into a retest of that. The 1.61 sell off is interesting because if it's a 4.23 reversal we have to be in a head fake above it and if it's a head fake we are looking for a 1.61 spike. These things make the speculative bets into the retest compelling and the pragmatic "What if" planning for a break worth covering. A 1.61 reversal would be expected to be a nasty event. A 1.61 reversal would take out the last low (by definition, it's just a bit pullback otherwise) and it would do this in a strong consistent selling manner. Which would be crash like on this timeframe. But the 1.61 reaction is not in any way prescriptive of a crash at this point. A common pattern is a big pullback from the 1.61 and then when it has been broken again it goes into a strong rally to the following fibs. This can top on a few of the fibs but full extensions in strong trends spike out 4.23. Inside the context of the overall building of the trend what is happening now would be insignificant overall. Even if dropping all the way to 5500. A full expansion of this would agree with the other fibs we had around the 10,000 level. Furthermore, a doubling period off the breakout of a 4.23 I'd consider to be a highly probable outcome. If the bear thesis is wrong here it can be wrong in a way that is irrecoverable. A persist bear will get you slaughtered. The case for a potential bear move here is extremely strong but that does also tend to mean the failure of it would be all the more spectacular. It makes a lot of sense to bet in these zones because there's a high chance you can at least break even on short term reactions and can perhaps make a lot in bigger reversals. It's pragmatic to be aware of what the larger risks of a reversal would be and how the swings in that would likely form. You have to think about these things ahead of time because otherwise it all happens too fast to really have time to think. Impulse decisions are usually bad. I have a high degree of confidence in the fibs being able to map out the important levels. My ability to know what that means ... not so much. I may or may not get it right. What is highly likely to be right based on 100 yrs of swings in SPX is the next major swing will relate to a previous swing in such a way that fib levels make it possible to get a good idea of the major highs/lows of the move. All the ways we can do that from here imply massive moves. If it's not 50% off the high it's 100% from the 4.23 break. How all this relates to where we are at this moment in time is we have to accept the potential of the bear bet being so wrong that even if there's a crash later it comes back to this price - meaning if it doesn't work here- entirely drop it and aggressively trend follow. If the bear bet is right we have to be inside of a 1.61 head fake of a 4.23. If we're inside of a head fake is has to sell off very consistently. We crash back to the break level. Price "Isn't meant" to be above that level and when the brief flurry is over it's nothing but selling. The consistency with which this style of rejection has is uncommon so it was really weird seeing it off the first 1.61 reaction. For the rejection thesis to be valid now the pullback in is we should be in the second trend leg which will complete the return to 4.23. If it's the second trend leg it can't be weaker than the first. The first was extremely consistent. From my perspective that's the bear bet. It's really specific for me at this point. If the bear thesis is going to be good we're inside a 1.61 head fake. The 1.61 is retesting and when it is rejected for a second time we're into a strong downmove to where the false breakout started. What it would take from the prices we currently are to turn me into a hyper raving bull that was discussing different bubble moves that may be about to build up is not a lot at this point. It would take very little to convince me to start to buy all the dips with tight stops and it'd not take all that much longer of that working for me to say it was extremely likely all the implied bear risk was behind us and it's all rockets and emojis for the next two years. I think when it comes to what the next big swings will be in markets it's important to be very objective because it's wild just how easily juxtaposed ideas can make sense. For example, AI. One could make a bulletproof case that we should expect a productivity boom based on AI. Lots of people can do much more. But you can make the inverse forecast that AI will be deflationary. Bringing prices down. Creating job losses. As jobs are lost, less money is spent - especially if things are deflationary because you can buy it cheaper later. Less money being spent is less business income and more jobs lost. Companies that survived would likely main use AI and it's easy to see how all that could end up being bad for markets. There are a lot of things like could go either way like that and have polarised reactions in the market but something related to AI is almost certainly going to happen. If AI advancements don't stall out rapidly they're going to start making real changes in the things happening in the world - this could easily justify a bubble or it could put prices into a race to zero. Then there's weird things like what happens when AIs become more and more of the trading volume - surely that's coming ... right? What will they do? It's something you can again make binary extreme cases for. You could make a case that the AIs would notice patterns of a topping market and start to trade in a way that brought about a crash. Or you could argue AIs might start to engage in some form of reward hacking and the way to optimise success is to drive the market vertical. I don't really see the point in narrative based analysis but if you do a thought experiment where you imagine the market either has crashed or has doubled rapidly it's now easier than it ever has been to find different viable ways you could work backwards to how events complimented that. It's wise to be agnostic and evidence based while we're at such a big decision level because the potential to be wrong big is so great and the likelihood you'll be bluffed into thinking you're right just at the worst moment is so high. Maybe bulls have had that now. But even if we sell and make a new low, this may turn out to be a second leg of a bear trap and be the low- being wrong from there as a bear would be even worse. Runs to new highs could come before a crash. If and when the decision is made it should be easy to make money. The 4.23 break would be far better to make money. The trend lasting over a year. A bear break would be trickier with the ups and downs of a bear market but lucrative for the correct strategies. The important thing is being equally acceptant of either outcome - and also accept the reality that neither of the implied outcomes may happen. Which would be a huge anti-climax for me. Really would. If whatever happens next is vanilla, I'd feel a bit cheated. The 4.23 rejection off a 1.61 spike out would be a very exceptional thing. It should be evidenced by exceptional action. If the bear trend is not persistent, there's a good chance it's not working. Up-trending through the resistance levels would make the bear case indefensible in my opinion and in the event of a typical 4.23 break make being bear bias into the future certain to fail no matter how good you are at it. The down move has a lot of proving it to do yet before it crosses from an expected move in a bullish pullback to a real threat of a trend break. At this point both would look exactly the same - what we see in the coming week is likely to be more telling.
holeyprofit
Full Bear Break Plans
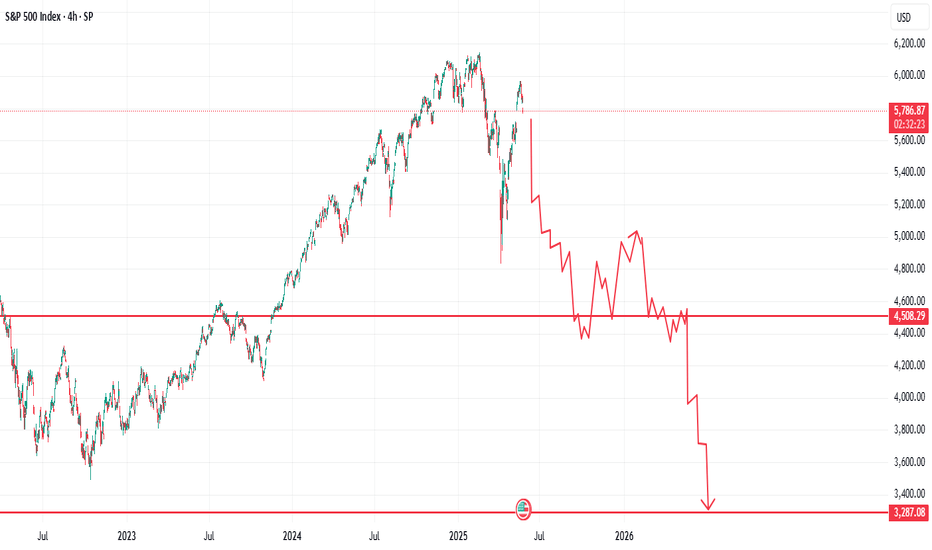
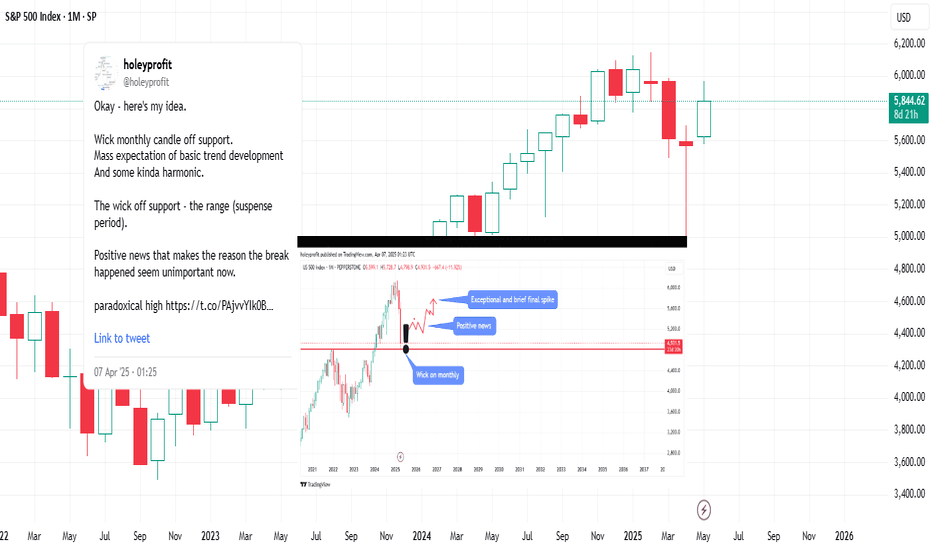
امروز ما دومین سطح پشتیبانی مهم خود را بیرون کشیدیم و تحت آن قوی فروخته ایم. ما در حالی که این را می نویسم در یک تجمع هستیم اما هنوز در محدوده اصلاحی مورد انتظار قرار دارد. ما هنوز خالص نداریم که در آن انتظار داشته باشم که پشتیبانی های مهم در حدود 5500 باشد ، اما در این مرحله کی احساس می کنیم اطلاعات کافی داریم تا پیش بینی کنیم که احتمالاً یک تصادف به نظر می رسد. مردم همیشه فکر می کنند پیش بینی های تصادف hard است. پیش بینی های برتر hard است. پیش بینی های دقیق در مورد وقفه تصادف یا اتفاق نمی افتد. وقتی صحبت از نوسانات واقعی تصادف هنگام وقوع است - از نظر تاریخی همیشه بسیار ساده بود. اگر تله گاو نر کم و زیاد شناخته شود ، سطح تصادف همیشه قابل پیش بینی بوده است. به عنوان مثال ، هنگامی که این کم و زیاد در سال 2007 شناخته شد ، می توان تمام سطوح مهم و پایین حرکت 2008 /2009 را ترسیم کرد. این یک مورد منزوی نیست. در تمام تصادفات قبلی اتفاق افتاده است. اگر کار من را دنبال کنید ، بارها و بارها در سطح مهم در قطره / پایین تجارت می کنید و همیشه بر اساس برخی از مشتق های این موضوع است. اگر ما از بالا/پایین دام گاو می دانیم ، می توانیم سطح مهم استراحت را شناسایی کنیم و تمام سطوح را به سمت نزولی که به طور معمول hit است ، نقشه برداری کنیم. ما می توانیم مناطق را بدانیم که خطر این امر وجود دارد و همچنین می دانیم که آیا تنظیم خرس در حال شکست است. اگر SPX قصد داشت یک استراحت کلاسیک ایجاد کند ، می توان نوسانات کلاسیک را که اکنون داشتیم ، تقریباً آسان کند. اولین قاره برای این امر ، رد ویک در نمودار ماهانه و ایده آل در آخرین قسمت ماه است. این ممکن است اکنون در حال انجام باشد. فروش باید با ما بماند یا پایین تر باشد یا حداقل نگه داشته شود - اما اگر اوضاع ادامه یابد همانطور که اخیراً ما شمع فتیله ای داشت. من اخیراً نشان دادم که چگونه ما قبل از وقفه روند تمایل به عدم موفقیت شمع های Wick Wick داریم. در آن تنظیم ما معمولاً یک شمع بزرگ ویک را می بینیم. غالباً تلاش برای تجمع و طرد ، بنابراین ما شمع های ویک مخالف داریم (گاو نر معمولاً بزرگتر است) و پس از این یک شمع درگیر نزولی که از همه شمع های اطراف آن بزرگتر است و فتیله را پایین می آورد. این حرکت ما را به حدود 4500 نفر می رساند. و تقریباً مطمئناً اخبار محور است. از اینجا ما معمولاً وارد دوره ای از عمل ناخوشایند می شویم. این احساس صعودی و نزولی است اما واقعاً فقط به پهلو می رود. غالباً این کار با دو بلوف بزرگ به پایان می رسد. ابتدا یک بلوف در حال شکستن به نزولی و سپس یک سنبله بزرگ از اوج اخیر است. این عمل خردکننده احتمالاً برای چند ماه در کل با جایی زیاد در حدود 5000 ادامه یافت. این آخرین تله گاو نر major بود و از آنجا شروع به رفتن به قسمت Crash می کنیم. در طول این بخش ما به اندازه ای که خرس کامل از بالا به کمترین میزان فعلی گرفته شده بود ، سفر می کردیم اما ما این کار را در کسری از زمان انجام می دادیم. در طی دو ماه ، ما می خبرهای گسترده ای را که از پایتخت در زیر 2022 پایین پشتیبانی می کند ، حمایت کنیم. سپس یک قطره 50 ٪ از بالا را تکمیل می کند. حتی در مجموعه های بسیار نزولی ، ما تمایل به گزاف گویی از حدود 50 ٪ تخفیف از سطح بالا داریم و همچنین وقتی یک منطقه پشتیبانی آشکار را می ریزیم ، تمایل به گزاف گویی داریم - بنابراین هرچه حرکت کلی باشد ، اگر و وقتی که 2022 پایین بود ، این در جایی است که انتظار دارم پایین باشد. این یک برنامه تجارت قاره است. ما می توانیم یک نشانگر را تعریف کنیم و اگر برخورد کند ، تعصب به سمت نشانگر بعدی است. اولین نشانگر این بود که یک شمع ویک ماهانه وجود داشته باشد. نشانگر زیر بود که پایان ماه رد و نزدیک است. نشانگر سوم می تواند یک شمع خرس عظیم باشد که فتیله را کم می کند. نشانگر چهارم "بازیابی" خاموش و متوقف شدن در حدود 500 بود. اگر همه این موارد اتفاق بیفتد ، خطر ابتلا به یک اتفاق پس از آن یک رویداد تصادف زیاد بود. از نظر تئوری ، ما می توانیم حدود 6 ماه از یک تصادف major باشیم و می توانیم در یک سری از نشانگرهای خاص به عنوان علائم هشدار دهنده در این راه قرار بگیریم. اولین علامت هشدار دهنده این است که هیچ بازیابی V در این فروش و بسته شدن شمع ماهانه با یک فتیله وجود ندارد. این پست موارد مختلفی را که در پست های اخیر با جزئیات بسیار بیشتری توضیح داده شده است ، لمس می کند. توصیه می شود مواردی را برای متن کامل بخوانید.
holeyprofit
Wick Tricks at Highs
بر اساس خرد متعارف ، نمودار ماهانه SPX super صعودی با ویک بزرگ به نظر می رسد. من می توضیح دهم که چگونه این می تواند گمراه کننده باشد. برای برخی از "اعتبارات" در مورد این ایده ، من پستی را که تقریباً دقیقاً در جایی که من ویک و سنبله ها را پیش بینی می کنم ، ضمیمه کرده ام و در حالی که بیان می کنم این می تواند در یک مجموعه نزولی باشد. در مجموعه نزولی ، ما اغلب در مورد این قیمت خبرهای بدی دریافت می کنیم. البته این شمع ها می توانند صعودی باشند - فکر نمی کنم با توضیح خواندن صعودی در این شمع ها ، به هوش شما توهین کنم. شما آنها را می شناسید. اما آیا می دانید که یکی از این موارد را تقریباً در هر major در تاریخ مشاهده کرده اید؟ من تقریباً هر افت قابل توجه را از سال 2008 تا 1966 ارسال کردم. در اینجا یک مورد اخیر است. من می توانم بروم و شروع به ارسال نمونه هایی از دهه 1910 کنم ، اما امیدوارم که نظر خود را بیان کنم. اگر این یک تله فتیله در صدر باشد ، ما به طور کلی طی 3 ماه یک ماه کاپیتولاسیون دید. معمولاً ماه آینده با بسته شدن این ماه ضعیف است تا بتواند در صدر قرار بگیرد.
holeyprofit
Plan for Full Support Failure
ما امروز با Lotto Puts واقعاً خوب عمل کردیم و بیش از 2،000 ٪ در OTM ها را که در نزدیکی روز شرط بندی در پایین ترین چیزها قرار گرفته بود ، قرار داد - اما من می این پست را با بیان اینکه امروز هیچ چیز مهمی برای خرس ها اتفاق نیفتاده است ، شروع کنم. من اخیراً توضیح داده ام که چگونه این نوع واکنش به سطح ما در آن متداول است. مواقعی وجود دارد که اکنون پایین ساخته شده است. همانطور که من این را می نویسم ، ما با پشتیبانی تجارت می کنیم. در یک حرکت 2021-ESK ، ما در کمترین سطح قرار گرفت. در آماری متداول ترین حرکت SPX ، ما در اولین شکست 5500 بود. در حرکت عذاب ، ما می وارد یک روند نزولی سازگار شویم که دارای پرش های کم عمق باشد ، یک تراش بزرگتر در حدود 5700 گزاف گویی می کند و سپس وارد دوره ای از کاپیتولاسیون جدی می شود. نوع عمل تقریباً هرگز در شاخص ها دیده نمی شود. من معتقدم که مشروط به اقدام قبلی که به این موضوع ضربه می زند ، یک رویداد بسیار محتمل در مورد استراحت بود. اگر ما در یک حرکت خرس بزرگ هستیم ، باید این اتفاق بیفتد که قطره اول یک پا یکی از پایین آمدن الیوت یا یک پا از تصحیح بود. این پا باید یا پای C یا 3 پا باشد. هر دوی این رویدادهای کاپیتولاسیون هستند - و تیتر تصادف هستند. مانند اخبار اصلی نوع معاملات. این حرکات با فروش مداوم و قوی مشخص می شود. فقط پرش های کم عمق. اگر این چیزها اتفاق نمی افتد ، پس خرس بودن ایده خوبی نیست. اگر این اتفاقات رخ می دهد ، تلاش برای خرید DIP ممکن است شما را میخکوب کند. من در اینجا و اکنون به شما می گویم ، اگر پایان نامه Bear Break صحیح باشد - بسیاری از مردم به حاشیه می آیند. آنها شیب را خریداری می کنند و سپس فکر می کنند که می توانند به طور متوسط از خرید بیشتر آن استفاده کنند و تظاهرات کافی برای پذیرش این امر وجود داشت. آنها به تدریج موقعیت های بزرگتر و بزرگتر را انتخاب می کنند. امیدوارم و احساس کنید که در اولین گزاف گویی major همه چیز تمام شده است و سپس بدترین قسمت روند به وجود آمد. اگر فروش قوی باشد ، مردم باید به خطر آن احترام بگذارند. برای پایان دادن به یک یادداشت خوش بینانه - اگر ما در جایی از منطقه ای که امروز معامله کردیم ، پایین می آییم که تقریباً همیشه صعودی است. من مطمئناً به یک سطح جدید تعصب گاو نر رسید و اگر خطر سنبله کلاسیک را از بین ببریم ، فوق العاده صعودی بود. من به شدت معتقدم که روند دو سال بعد در این زمینه تعیین می شود. فکر می کنم سالهاست که قابل پیش بینی است. اگر خطر نزولی برطرف شود - من فکر می کنم بازارهای آسان گاو نر که به دنبال آن بوده اند ، از مواردی که ما دیده ایم فراتر می رود. یا این می تواند بدتر به فروش شما در SPX تبدیل شود. وقت آن نیست که بیش از حد فریبنده باشید. از ریسک محافظت کنید و برای بهره مندی از هر نتیجه ای آماده باشید. احتمالاً پول بزرگ ظرف 9 ماه آینده در دسترس بود. 3 بعدی اگر این یک چیز خرس باشد. کم ساخته شده در اینجا واقعاً چیزهای خوبی را در پیش می گیرد. اگر بتوانیم در اینجا کم کنیم ، من گمان می کنم که طی چند سال آینده به شدت صعودی شد. من فکر می کنم تنظیم خرس به یک چیز بسیار خاص نیاز دارد - باید مقاومت را از بین ببرد و ماه ضعیف را ببندد. برای اطلاعات بیشتر به ایده زیر مراجعه کنید.
holeyprofit
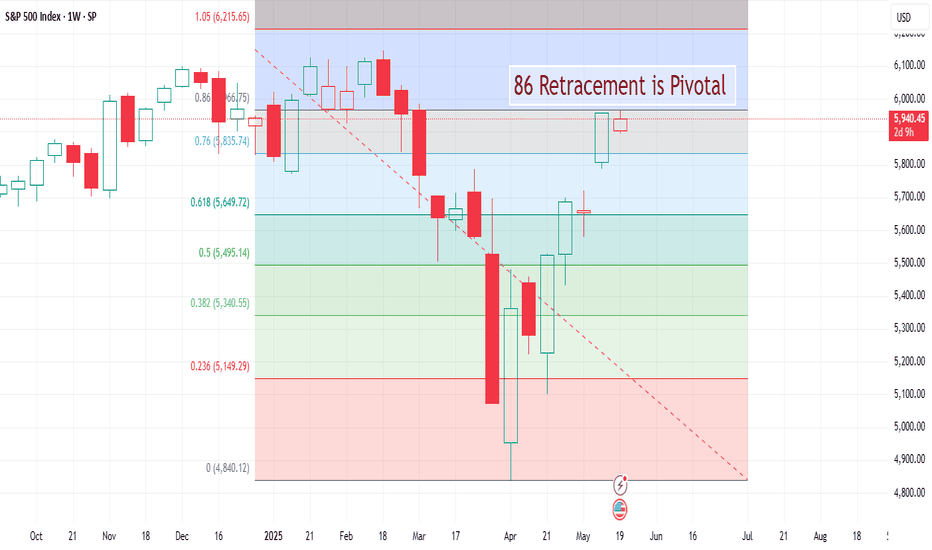
The Three Main Things That Happen at 86 Fibs.
As some of you may know, I have a bit of an interest in how trend moves have historically formed and failed. I am interested in the subject generally, with me having put a fair amount of time into just understanding the basic timeline of historic events, reading the different studies on market hypothesis' and checking how these perform or fail in the fat tail events, but when it comes to trading I have a few main interests. --How can we approximate what zone a top would generally come if we're topping. --How do we survive being early on that. --How do we know it's wrong and we should flip long. --The typical break/capitulation level for bear trends. --Where we tend to bull trap from. --Styles bull traps and market recoveries. --How markets generally bottom after extreme events. The answer all of those questions is an optimistic endeavour but these are the main things you have to understand to make it viable to be able to bet on the major turning points in these fat tail events and to be able to take exposure without going broke if you get it wrong. Be that trying to buy lows or fade highs. During the last bear move we posted short analysis at the top, throughout and then posted the different possible bull traps while we were at the low. To this point, the general norms of the historic analysis have held up. Now, we're into the 86 fib which has tended to be a critical area for the trend decision. In this piece I'm going to go through the main types of reactions we get here and how one can aim to make a plan that will be profitable in all types of scenarios. Many of the things I'll be discussing are generic retracement rules and if you follow my work you'll know them from my 76/86 theories that I discuss regularly, but all of what I am about to cover here also checks out on the SPX chart. I have manually went through every single drop of over 10% in the SPX and then modelled the different rallies from there. Be them recoveries or crashes - these rules tended to be useful in most of them. Let me start by giving a very brief history of my use of the 76/86 fibs. The original rules I had for this was a reversal should come just a little bit before the 76 fib. I'd buy/sell close to the 76 fib and use a 76 hit as my stop loss. These were great times. It would work a lot and it'd pay over 1:10 RR sometimes when it did. Over time this became a little harder and I had to increase my tolerance zone for spikes above the 76. My rules then became to trade close to the 76 and if the 86 hit then I'd stop out because I think it'll go higher. Most of the time we pullback first, but the 86 hitting I used to class as a failure of the reversal. This worked well (Albeit with reduced RR) for a long time but during the 2022 bear market this theory has significant failures with us tending to trade to the 86 and then put in full reversals. Given my bias is trade the reversal on the 76 and expect continuation if the 86 hits, this was a problem. My default rules would pick up losing signals on both sides. So I had make some further amendments to the idea in 2022. I've used the general idea for about a decade in total now, with some minor adjustments along the way. This framing is important because the general default rule I'd have here is now we 86 has hit we probably pullback a bit but it's a net bull bias- however, that strategy has weakened and I have to be a bit more agnostic now. Before, by this point I only have bull plans and ideas of how to stop out if I am wrong. With the new tendency for 86 hits, I need a bear plan also. First we'll deal with the outcome that I find happens least often, the clean 86 break. I hate this move. Be it on the upside or the downside I always find it easer to make money when something happens at the 86. I don't even care what. When it trends through I don't expect it because it only happens about 20% of the time and I can end up in a tricky situation where the market jumps from one resistance level to the next and I never want to buy and generally am bias towards fading the move - which can go really bad if the reversal thesis is wrong. When this clean break is made it's usually built in a trending way. Higher lows in an uptrend. I've found the best way to deal with this risk is if there's any credible risk of the 86 breaking I start to buy all the dips when they're at deep retracement levels. What I "Think" will happen doesn't matter. I know if we head into the type of break I dislike I'll do poorly if I do not start to fade the 86 early. I'd rather lose one or two small trades trying this than end up in a situation where I find it hard to know what to do for months. If we get back above the 86, this is the plan. Just buy all the dips until it fails. If it fails early I'll probably lose 2-3% over a few trades. If one trade works and I lose after I'll end up even. If they all work I'll end up with over 30% for my 3% risk. Although I do not "Think" this move is likely, when you can risk 3% to make 30% and cover yourself from the things that are tough to deal with - that's a good deal. The most typical result in SPX history (and in general 86 theory) is we make a crash like move off it but this only goes to the 50 fib. Very common. You'll find this in SPX recoveries from as early as 1920. Obvious ones after the 2008 crash etc. This is a net super bullish setup but we'd be in for a drop of about 10% first. It's the most common outcome and if it was not for the need to edit rules due to stop hunting this would be the only main plan I had right now. The plan would be to trade this and everything else would be planning how to not lose too much if something else happened. If the 5o fib breaks, we tend to capitulate to the 23 fib. From here is a bit of a tricky spot because a lot of different types of things can happen but inside the context of the overall move we have, this could foreshadow a massive break. If and when we get there I'll discuss more about the tactical trading decisions one can make in this area. I think for the bear thesis to have a chance we need to the monthly candle to close with a wick on the top. A drop of several 100 points into the end of the month. Giving the size and speed I'd expect this move to be, it'd almost certainly be a news related move. If that marker hits, then we'll discuss the decisions to be made into the support levels. If we uptrend above the 86, then it's buy all dips until it stops working, review after. But one thing is for sure, this is historically the riskiest spot to be short term bullish. Even in a bull setup, you're wrong 3/4 times on long entries here. In a bear setup, things get really nasty. Bulls should be super careful if the 86 can not break. Bears should be careful if it does. The historical analysis clearly shows if you make mistakes here on either side you can take crippling losses. No one should be overconfident at these prices (most people are though). The bears have the edge for the next 10% under the 86 but if they are wrong there are so many different ways it can end up terribly. Bulls are at the point where they should be most careful, but as it generally is - this is when they feel bulletproof. Interesting spot. For my part, I plan for everything and trade what happens. Being profitable is more important than making bold and clever predictions if you do this for a living.
holeyprofit
Failure to Break the 1.61 Could Get Really Bad.
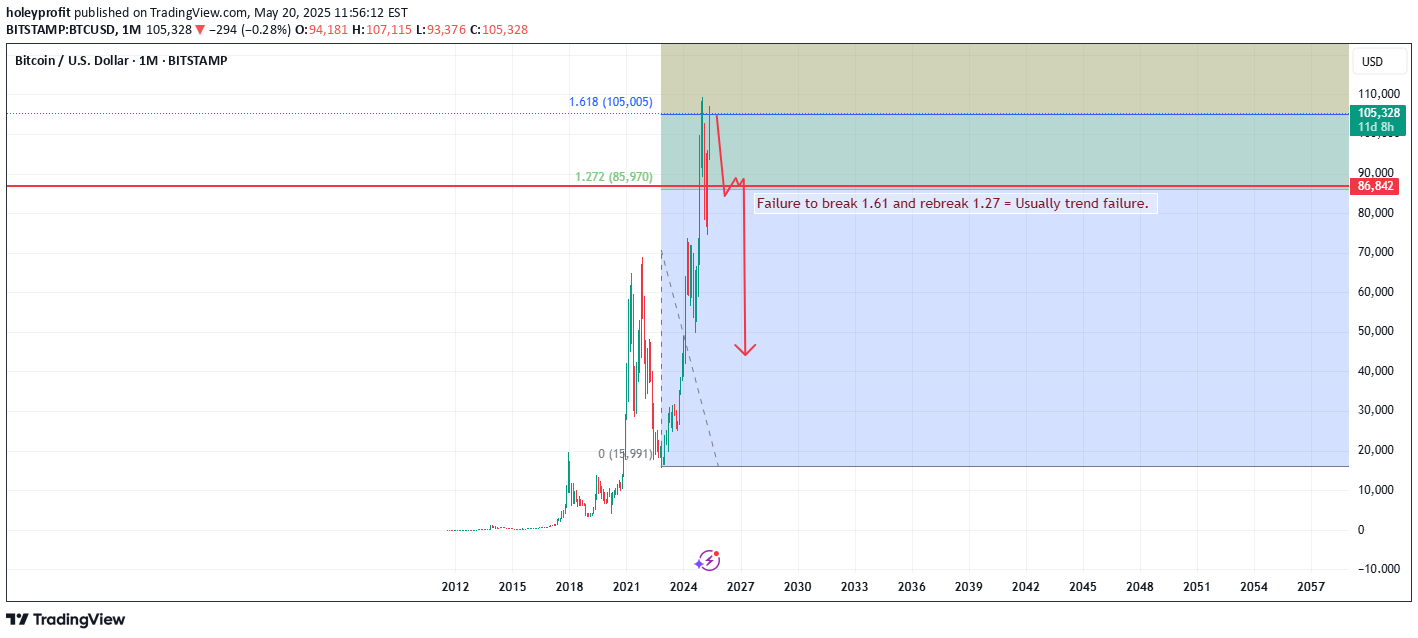
من اخیراً برنامه Breakout ضمنی را ارسال کرده ام اگر BTC می تواند از منطقه 1.61 عبور کند. قدرت و سطح مورد انتظار این حرکت برای نقشه برداری در این مرحله مهم است و به خصوص برای خرس ها قابل درک است زیرا اگر بشکنیم ، این حرکت بدون هیچ گونه بازپرداخت بزرگی می تواند اتفاق بیفتد. در صورت وقفه 1.61 ، این زمانی است که ما واقعاً می حرکت بزرگ را که مردم می گویند شما باید در حالی که ما به سمت اصلاح بزرگ حرکت می کردیم ، قرار دهیم. اکنون زمانی بود که یک شکست پایدار ساخته می شود و در صورت شکستن پول آسان در سمت طولانی وجود داشت. برای مثال مشابه ، پیش بینی من از NVDA که از 500 به 1000 ساخته شده بود ، براساس همین نوع استراحت بود. اما اگر ما نتوانیم 1.61 را بشکنیم ، می توانند انواع ناخوشایند را بدست آورند. معمولاً با بازگشت سریع به 1.27 شروع می شود و هنگامی که 1.27 شکسته شده است ، معمولاً یک شکست کامل روند است. هنگامی که به دنبال این واقعیت بود ، بدیهی است که شکست 1.27 لحظه مهمی در روند بود. ایجاد این نکته فوق العاده مهم برای BTC. در صورت پایدار بودن این شکست ، بسیاری از گزینه های خوب پس از ساختار محلی وجود دارد. توقف ها را می توان در زیر آن تنظیم کرد و می توانید در تمام حرکات اصلاحی به hit 1: 5 + RR مراجعه کنید. توقف های دنباله دار در این مورد بسیار خوب است ، اولین مقاومت major پس از یک شکست 1.61 140K. اگر تلاش برای شکستن 1.61 شکست بخورد ، معمولاً با یک حرکت شوک بزرگ شروع می شود و به یک بازار خرس بی رحمانه تبدیل می شود. اکنون زمان آن بود که در مورد خطر هر دو طرف عاقلانه باشید. برای معاملات ، به احتمال زیاد به زودی به بازارهای بسیار سودآور می رویم. به کدام طرف که می شکیم تا حد زیادی بی ربط است ، پس از اتخاذ تصمیم 1.61 ، یک سبک ساده از حرکت به هر طرف پیش بینی می شود. اما اگر 1.27 به پایان نرسد ، انتظار می رود که بسیار ناخوشایند شود. مهربانی که ظاهراً مجاز به گفتن نیستیم در مورد مواردی مانند BTC امکان پذیر است ... اگر در معرض این موضوع قرار دارید ، از هر طرف ، اگر شروع به رفتن به مقابل شما می شود ، باید بسیار مراقب باشید. یک تصمیم روند major به زودی اتخاذ می شود. یک حرکت خرس به طور معمول با برخی از اخبار شوک و فروش کاپیتولاسیون شروع می شود. اگر اتفاق عجیبی رخ داده است از این امر آگاه بود.
holeyprofit
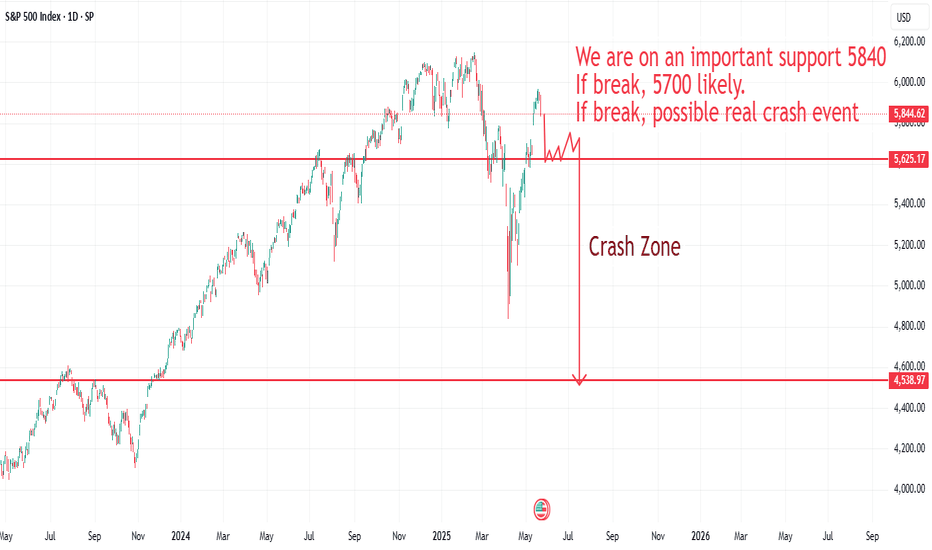
If We Break Here, Trend Decision is Likely Around 5500.
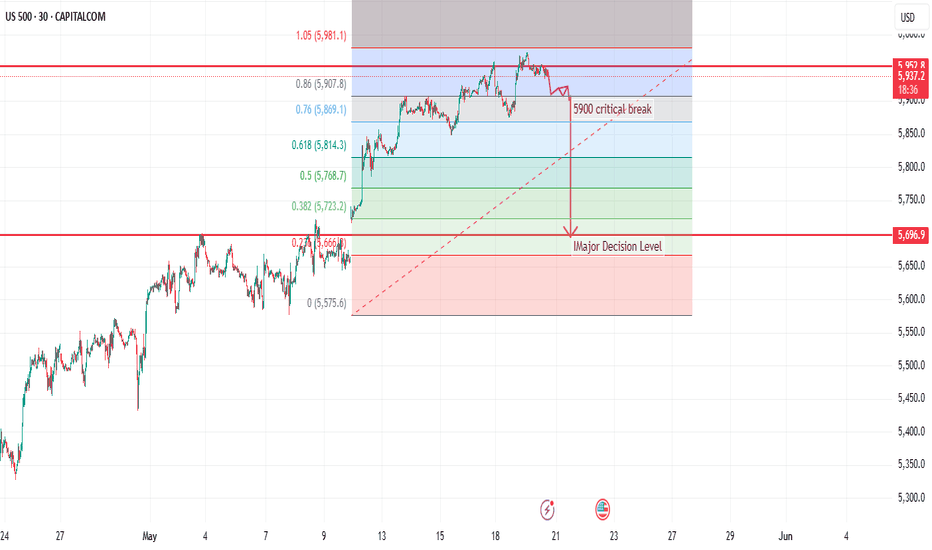
من اخیراً ملاحظات مختلف صعودی مختلفی را برای برک آوته ارسال کرده ام زیرا با توجه به زمینه کلان جایی که ما هستیم ، اگر این ساخته شود می توانند بسیار قوی باشند. با این حال ، در لحظه دقیق زمان ، ما هنوز در سطح مقاومت major تجارت می کنیم. ما در 86 فیبر تجارت می کنیم. از نظر تاریخی ، SPX حدود 80 ٪ از زمان را از اینجا عقب می کشد. معمولاً تصحیح ، برخی از آنها تصادف شده اند. اگر بالاتر از 86 صعود کنیم - این تعصب بسیار صعودی است و این طرح خرید همه شرط بندی ها بر روی ساختار روند محلی برای نگه داشتن است. بیرون رفتن به محض اینکه کمترین میزان بی عیب و نقص در زباله ها وجود ندارد. ما اخیراً کمی بالاتر از 86 معامله کرده ایم اما اگر دوباره آن را بشکنیم ، احتمال افت 10 ٪ قوی است. در این مرحله SPX به راحتی می تواند در حرکت صعودی به حدود 5900 کاهش یابد. انتظار می رود در این مرحله من بگویم. بخشی از یک پیشرفت روند ساده- اما اگر سطح 5900 شکسته شود ، احتمالاً ما نزدیک به 5500 می رویم. پیش بینی 5500 پیش بینی صعودی است. در صورتی که ما این ماه با یک شمع بزرگ ویک در بالای آن بسته شویم و سپس ما یک خرس را در حال تعطیل باشیم - ماه آینده می تواند یک شمع بزرگ درگیر نزولی باشد. ما واقعاً در یک مکان بسیار جالب قرار داریم. اندازه در انواع مختلف شرط بندی خرس در اینجا در 5940. اگر ما همچنان شاهد صعود محلی باشیم ، قصد دارم تمام توقف های غرق و دنباله دار را بخرم و امیدوارم این امر بتواند در آنچه ممکن است به یک شکست حسی تبدیل شود ، تبدیل شود. اما اگر پشتیبانی از شکست شروع شود - فکر نمی کنم این یک قطره برای خرید باشد. من در مورد شکستن 5870 یا به همین ترتیب = و از نظر RR در حرکت ، تعصب بسیار خرس بود ، شرط خرس اکنون بهینه است. تصمیمات بزرگی که باید در این زمینه اتخاذ شود. ما باید به آنها نزدیک باشیم.
holeyprofit
Why You Shouldn't "Hope" for Bear Markets.
A lot of the underlying TA analysis to support this is contained in my other post about the 4.23. It's recommended you read that first to understand context. Click below; This isn't an analysis post. In this post we won't be dealing at all with the idea of if you should expect, plan for or take steps to protect yourself against bear markets. We're going to focus solely on the fact some people really want it. They want it bad. You can tell by how extremely excited they get whenever there's even a mild hint it will happen. Some people think I want this. They say the funniest of things. The amount of times I've had someone say something like, "Don't worry there will be a crash (some variation of "But when I say so" usually goes here) - which silly concept. The idea I "Worry" there will not be a crash. That I have a thesis in which millions of people get hurt, but at least my idea was right. If you understand the scope of things that happen in a true bear market, to think this way is very shallow and selfish. People are liable to lose everything they worked their whole life for. Families losing security. Kids can end up on the streets. It's a dire tale - and to hope for this to happen just so you can say "Told you so" is a terrible way to be. There are two good reasons as a trader you may want the market to go down. 1: Volatility. Markets get faster on the downside and if you're good, that means more money. 2: Benchmark beating. Unleveraged it's hard to beat SPX in an uptrend. Pullbacks help, a lot. Both of these are now what I'd consider largely invalid reasons. They were good ones to have before but now we have massive volatility on both sides. We're inside an expansion of volatility which will likely continue whether we go up or down. On benchmarking, it's important if you're in the asset management game but at this point you should be so far ahead of the benchmark that it's irrelevant. Good active traders at this point should be streets ahead of passive investors and passive investors should not even know it because we're back at highs and they think that means they have optimal performance. What they think doesn't matter, you can show people with money your results and being so far ahead of the benchmark greatly benefits you. At this point in time you can be suitable ahead of the benchmark on a risk adjusted basis and have the prospect of heading into hyper volatile markets where you can make a fortune on either side. And if you're not in this sort of situation, you're not going to make a lot of money in a bear market - anyway. You probably have too strong a leading bias on the bear side which has led to you round tripping gains and even in a sustained bear market this same thing will happen in the bear market rallies. A prominent reason some people hope for a bear market is simply want to see bulls fail. It seemingly annoys them no end to see other people doing well by doing something they think they should be punished for. While they often won't outright admit this, it's clear in the tone of how they speak. The way they celebrate any time someone bullish might have maybe lost some money - and they are eager to tell you how they are going to go broke in the next leg. This is a bad way to be. In life. You should not be too bothered about what other people are doing. How they get on with that. And you should not expressly hope people fail and suffer just because they have a different idea of market analysis from you. It's not a healthy way to be. It's bitter and caustic - and that isn't stuff you want to cultivate as personality traits. You can spot people who are like this easily. They'll generally dress it up as "Warning people" but it's not warning people when you cheer and jeer if the bad thing happens to them. That's called "Gloating" and if you were really interested in the helping of people, you'd not gloat. Indeed, the bad thing happening to them would be consider a failure on your part. Your warning sucked and no one listened. When it becomes stupidly obvious what motivates these people is when the market goes up and they get mad. If this happens, you're not "Trying to help". You are hoping they will fail so it validates yourself in some way. Which is bad ... You want to address that and find a way to validate yourself without needing others to suffer for you to have "Told them so". If the 4.23 thesis is correct them whatever way to market resolves there's liable to be a mega trend. If you're in the game to make money - which way is better. Up or down? It's up. Clearly. Because when the market goes up your risk is contained to things like fraud and malpractice with your counter parts. You bank and broker are only going to go under if something extremely shocking is unearthed. In a downside market, it only takes one thing to have a problem and through the magic on contagion all of your banks and brokerages now have a problem. You know what problems with banks and brokerages mean? They mean you put effort into making money you might not get. It's not the thing to be "Hoping" for. Is it? It's really dump, to be blunt about it. When you drill down into it the two main reasons people want a bear market are they don't like seeing bulls succeed and they want to be able to say they got it right. That's the bottom line with most bear forecasts. And you can always tell because they'll be upset if the market goes up. The other is basic ideology of how markets "Should act" but this is basically just hoping the bulls fail and also generally totally detached from the reality of how markets have always acted. Markets have never acted "As they should". Never in 200 years. Why show up now and moan about it? These things are all entirely non important. When you weigh them against the known outcomes of bear markets. Millions of people suffering. Risk to financial structures. Increased chance of slippage and gap events in the market making it hard to understand and control risk. Just so you can "Be right". Or just so people you don't know can suffer because they did something you didn't do and you're not happy that went well for them. At the risk of repeating myself ... not a good way to be. There used to be a bit of a good reason when it comes to social media because sites like this have become increasingly less useful/interesting as the uppy markets continue. More and more we have the future knowers that will insist you use their ideas. You may not even discuss your ideas. If you do, you should be mocked and branded as [insert the bad thing you are]. While a solid bear market would bring an end to this we'd run into a couple problems. One - the bears would take their place. We seen this at the April lows. When I posted bull analysis at the April lows bears showed up with all the same tone and noise of bulls when you post into resistance. Like the bulls, if they're right they come back to tell you how stupid you were and if they're wrong you'll just not see them again until they're right. Where they'll come back to remind you how stupid you were, even if you've already banked profits on all your ideas at this point. This is mildly annoying but it's not the sort of thing that you should pick global disaster over. All you have to do is just not read the comments. Granted .... the fact you have to post analysis that's the popular idea here or you should not bother reading the comments because it's be full of childish nonsense isn't ideal for social networking. It doens't make these kinda place "Fun" places to be. But it's better than the wipe out event. And now even the wipe out event will not significantly improve the content one should expect. It used to be the case if there was a wipe out event then most of the people posting would be -people who have some deep experience trading either side of the market and can offer insightful ideas. In the previous drop we seen how this will play out now. People will not know what they're talking about but rather than let that slow them, they'll just get ChatGPT to write the post for them. And it will be entirely standard and predictable posts. Most of the "Bear market analysis" I seen in April can be duplicated by putting about 6 words into ChatGPT. If I can prompt ChatGPT and read your post - why would I read your post? I can ask ChatGPT the same thing. Can ask for more detail. Give more context. Chat back and forth about different outcomes. Or I can come to social media and read the same 5 bulletpoints over and over again. It's not hard to see which is more interesting. So even the idea that we'll have more interesting content from more objective traders is largely out the window now. We'll probably just have generic ChatGPT posts. "Hey ChatGPT, write me an essay on tips to trade a bear market". That's how most of the bear analysis in April was written. All in all, the only two reasons people hope for bear markets at this point is ideology and ego. Both are things you should leave at the door when you enter the market. Whether it will happen or not is something yet to be determined, but it's not something to hope for. Although I will say this, if the 4.23 breakout comes I think sites like this will become essentially unusable for people interested in discussing strategy, odds and contingency planning in markets. It kinda already is and it would get much worse. Unless you want to post, "I too agree with the popular idea" you may as well not post. And if everyone is posting the same thing, you may as well not post. But these are small prices to pay to know your broker is probably going to stay in business.
holeyprofit
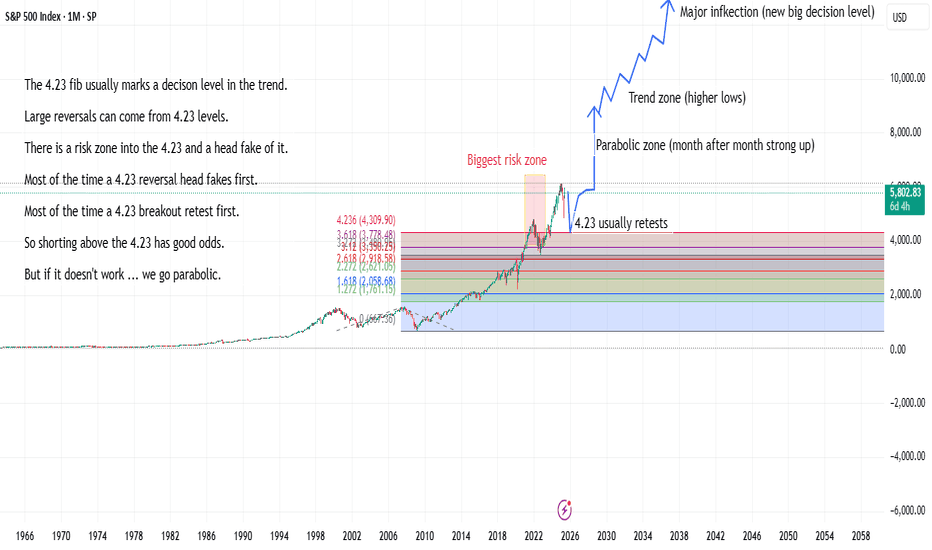
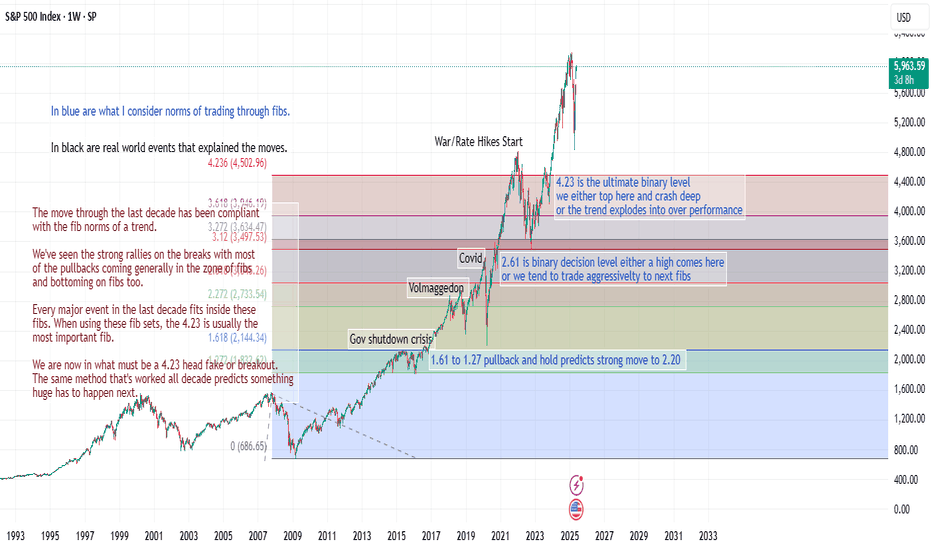
The Macro Importance of the 4.23 Breakout or Fake-out
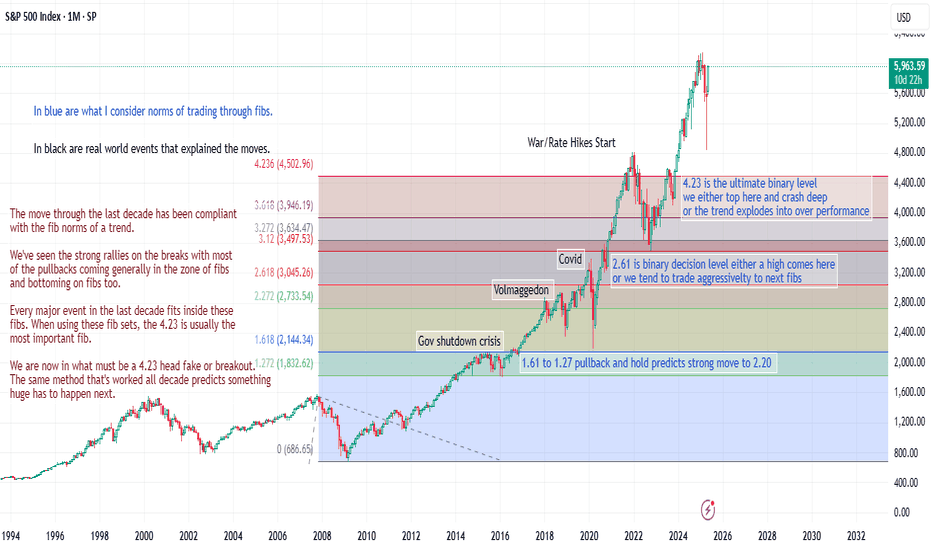
We are at an incredibly interesting and unique point in SPX. I am fascinated to see how this ends up resolving. Based on everything I know, these things predict extreme trend events come next. First let's take a moment to qualify the idea the 4.23 is going to be important. The idea of using a line generated by a multiple of a swing that happened almost 20 years ago to make decision on what will happen in the next years sounds silly. I know that. But look at what happened on all of the previous fibs. Seeing is believing. This doesn't tell me the 4.23 has to be important, but it supports the idea it may be. If you bet any of the previous fibs would not be important, you'd have been wrong. All of these did their thing in one way or another at one point. It's quite incredibly, really. Especially if you understand that these pullback/breaks levels are common any time you use these fibs in a developing trend. They tend to react to the same levels in the same ways. Then it happens on the Big Stage .It's amazing. And if it continues, the next thing is ultra amazing. The 4.23 head fake has disastrous forecasts. In the full play out of the 4.23 rejection we return to the 1.27 fib. In this case, that'd be a Depression style event. When a trend forms through fibs having all these pullback/break reactions and it gets to the 4.23, if the trend fails there -a massive mean reversion move happens. When applied to a decade long rally, that would be horrific. This is the macro bear risk I have discussed at length, generally taking shorts into the fibs and covering/reversing long into supports). In the grand scheme of things the 4.23 area would be seen to have been essentially the top with some wild blow off action above it that turned into a head fake. We'd be right in the end times. A lot of nuance is needed for real trading but in a historical analysis it'd be seen that we were at the high now. On the other hand, if the 4.23 breaks we usually see a move that is equal in size to all of the move before but happens in a fraction of the time. 4.23 breaks can be a wild with all supports/resistances being easily broken in big persistent candles. 4.23 breaks are rare, but they tend to put you into the most exceptional of price moves. For context, when a 4.23 breaks when I am trading them on a 15 min chart prices are moving that fast I generally don't have time to do much. Even if I am sitting there watching at the exact moment it kicks off. It's like this; "Wow! Okay I need to think what to ... WOW!". Prices are moving too fast to process any reasonable plan. By the time you consider the situation you're in, you're in a totally different one. Nice conditions to be trailing stops. Hard to enter into. The magnitude of a 4.23 break here would be astonishing based on the previously discussed norms. It'd predict that SPX would go into a move where it was doubling from the high. Furthermore, it was doing it in a tiny fraction of the time it took the previous rally. For our doubling number it'd be best to take the breakout of the 4.23. Let's call it 5000 to keep it simple. Would give us an upside target of 10,000 in SPX without accounting for any stop hunting or overshoots. It would also imply that this happens in a crash up type of move. "Crash" being defined as a strong and sustained breaks of SR levels with no big reactions. When it comes to tactical trading this is a total nightmare at this moment in time with the suggestion of massive profits (with potentially easy markets) in the coming year or so. At this point in time it's very tricky. If you accept the premise that either we're in a head fake over the 4.23 and a very aggressive rejection is coming or we're now into the start of what will become hyper over performance in the trend you have to consider this as a bit of a limbo point where there could be a chance to do well one way or the other but if you screw up something terrible will happen to you. If it was a 4.23 fake out we'd have a super strong sell off. There could then be a big bull trap coming up to a double top/spike out and this would then turn into the most sensational of crashes down to under the 4.23- as the macro uptrend experiences what will become its first major trend failure. The action in that move short term would be insane. There could be some late month rejection here (or next month) and then a massive monthly engulfing candle. We could see a month -20% or so and then see follow through down months. The amount the market could drop and how fast it'd be predicted to drop make it enticing to bet on this. To bet on this, you have to bet into the rallies. There are too many times we dip and rip to try to sell after bear candles etc. They produce too many false signals. You can end up losing money even if you hit the big trade eventually. Betting on rallies allows you higher RR and when there are short term pullbacks you can get stops into even. But that leads us to the headache ... If we're inside a real breakout of the 4.23, we're in the foothills of what will become the most exceptional of rallies. During this, we should see massive high momentum moves up. These will generally go from one resistance level to another. Said differently, you'll see the spikes that seem ideal to fade into the levels you think are the levels to fade - and they won't be levels to fade. Conversely, the bull strategy would have you aggressively buying all dips and breakouts. When you see momentum looking to get in one it quickly. If it pulls back, all the better. Doesn't matter if you take a string of losses because if you end up in lower at the end and it makes a new high you'll be net up on the round trip. The trend is going to be accommodating and it's only going to get better and better. You can't lose on the upside, and if you come at it in a really attacking way you could perhaps position before a massive upside move. But you might be doing that into the very end of the trend and have all sorts of sickening gap risk/slippage risk and margin call risk. Of course, the 4.23 thing might end up not even being important. But from the lens I see markets through, I have to think it will be. If it's not, I'll be surprised. And it makes me believe that whatever way it goes there has to be something exceptional. When it comes to these juxtaposed outcomes watching price is not all that helpful. Because this can happen in an up move. With this happening in a down move. It can be really hard to tell things apart until the point where you've lost is crossed. If we break the high and you think we're going higher, it's important to be aware of the risk of a bigger pullback. But it can just break and run, too. Or to the downside it could break abruptly. Breaks more commonly have traps in them and would look something like this. So we have a unique situation where I think it's fully justifiable to expect there would be exceptional moves with the market going up 100% or down over 60% - and both of these would be expected to happen within a short period of time. Bulk of it over a couple years. But the nuances of how to go about positioning in a risk efficient way are tricky. On the bear side, you should be fading this rally and looking to build positions into drops as they develop. But if you're doing that against a bull trend you'll get decent entries if you're good with resistances but build up a position into support and end up down/even on all your entries. And you'll lose a lot of entries with no reaction - so you'll lose overall. On the buy side you should be aggressively accumulating and buying close to supports but in the 4.23 head fake thesis this would be literally the worst time in your life to do that. If you're buying and we go up and breakout, you should buy more. But if it's a breakout/correction then you'll get nailed. You can buy more into the correction but you might be "Exit liquidity" in the dump. In the dump, you can short aggressively but are liable to get cut up a dozen different ways. This set of dilemmas are always something faced when you're trading at a binary inflection point. Even on small charts when we trade at 1.61/2.61 and 4.23 levels this set of paradoxes exist and are tricky to know exactly what's best to to do - on the Big Stage, it's mindboggling the different things that may happen. And daunting knowing the different traps. If this 4.23 thing is going to be right, the one thing that is sure is there's going to be well above average chances to make big money when the 4.23 decision is resolved. The 4.23 rejection would be a terrible event. And with who knows what types of real world impacts/reasons. From an intellectual standpoint it is fascinating. If we went into that style of crash now we'd have done it off basic TA patterns, mirroring major crashes of the past and even the interest rates cycles would have been the same as previous bubbles. In the final analysis of it, almost all aspects of the formation and bust of the bubble would have been foreseeable with basic pattern matching ideas. All of the things that have happened in the last 50 years and then all of the crazy things that'd have to happen for a depression crash in the years to come - all foreseeable with extremely basic pattern ideas. The fact everything has matched as well as it has so far trading through the fibs is already remarkable. If it was punctured by a mean reversion fat tail ... wow! On a personal level, even just in the minor drops of 2020, 2022 and recent one it's clear to see indices going down a lot is going to really hurt people. At this point we're just seeing this in speculators but it makes me think about what this would be like on a grand scale. It'd not be nice. The 4.23 breakout thesis is fascinating and exhilarating. A prospect of heading into the major boom section of a mega trend and having full awareness of that being what you're heading into and approximately where you can expect that to end up going. These would be conditions where someone who knows what they're doing can make insane amounts of money. Even just showing up will make money (as long as you don't end up overstaying). In this extreme doubling event we would still be predicting bad times ahead - but they'd be differed by a couple of years. From a selfish point of view this would all seem great. To benefit from a bubble and be able to bet on a spectacular reversal later. From a humanistic point of view it seems like it'd only cause greater devastation later. No one cares now because we're back at all time highs and boohoo anyone who sold the bottom, but at the lows of April there were anti suicide posts pinned in trading forums. That's how bad things are now on a 20% drop. Think how much worse they'd get if mania develops more. It's an interesting time. For the sake of sanity and profitability I am doing my best to be as agnostic as possible about what the outcome will be. Plan for all, execute as suitable. I hope we see the 4.23 break. It's the better of the trading ops (Since it offers two massive swings) and if we can crash up or down by the same amount of points, who cares which way it goes? Trading long can be logistically easier in many ways, so it'd be the preference if all else was equal. And being a bear is tiring. It's particularly tiring having to explain to people stating a statistical observation on a SR level doesn't mean you're depressed, angry, a shill and having a different opinion about markets does not mean you hate them. So they don't have to try to fight with you. Every 5 mins... If you're a bull and say something will go from 100 to 130. And it goes to 40 then it goes to 129 ... you were always right. That's what people say. If you're a bear at 100 and it goes to 120 then 40 you were an idiot that got lucky eventually. I always find that funny about social media. We're in interesting times. If my 4.23 hypothesis turns out to be correct we're heading into the history books. It's just a question of "For what?.
سلب مسئولیت
هر محتوا و مطالب مندرج در سایت و کانالهای رسمی ارتباطی سهمتو، جمعبندی نظرات و تحلیلهای شخصی و غیر تعهد آور بوده و هیچگونه توصیهای مبنی بر خرید، فروش، ورود و یا خروج از بازارهای مالی نمی باشد. همچنین کلیه اخبار و تحلیلهای مندرج در سایت و کانالها، صرفا بازنشر اطلاعات از منابع رسمی و غیر رسمی داخلی و خارجی است و بدیهی است استفاده کنندگان محتوای مذکور، مسئول پیگیری و حصول اطمینان از اصالت و درستی مطالب هستند. از این رو ضمن سلب مسئولیت اعلام میدارد مسئولیت هرنوع تصمیم گیری و اقدام و سود و زیان احتمالی در بازار سرمایه و ارز دیجیتال، با شخص معامله گر است.