
ew-forecast
@t_ew-forecast

تریدر چه نمادی را توصیه به خرید کرده؟
سابقه خرید
تخمین بازدهی ماه به ماه تریدر
پیام های تریدر
فیلتر
نوع پیام
ew-forecast
TSLA- Want to buy? Be aware of deeper correction, wait on 370/80

تسلا بهبود بسیار خوبی از پایینترین سطح آوریل 2025 داشته است و حتی به اوجهای جدید نزدیک به منطقه 500 رسیده است، اما اکنون شاهد یک بازگشت جالب در آغاز سال 2026 هستیم. این عقبنشینی همچنان میتواند اصلاحکننده باشد، اما باید عمیقتر باشد، زیرا ما هنوز سه موج فرعی در موج چهار را از دست میدهیم، قبل از اینکه بازار بتواند این اصلاح را کامل کند. یک منطقه حمایتی بسیار جالب برای کسانی که به دنبال پیوستن مجدد به روند هستند، در حدود منطقه 380 -370 است. این ناحیه با ناحیه موج چهارم قبلی و نوسان قبلی از می 2025 همسو میشود. نوسانگر موج الیوت نیز به نزولیتر اشاره میکند، زیرا تکانه احتمالاً میتواند به سطوحی مشابه آنچه در حوالی جولای و نوامبر 2025 دیده میشود، همانطور که در نمودار روزانه نشان داده شده است، با فلشهای برجسته روی نشانگر برسد. نکات برجسته • منطقه پشتیبانی کلیدی برای تماشا 380–370 است • عقبنشینی فعلی احتمالاً بخشی از موج چهار است که هنوز سه موج فرعی وجود ندارد • نوسانگر موج الیوت نشان می دهد که عقب نشینی عمیق تری وجود دارد • ساختار صعودی گستردهتر در بالای منطقه باطل 275-277 معتبر باقی میماند
ew-forecast
Tesla Read For More Gains In 2026
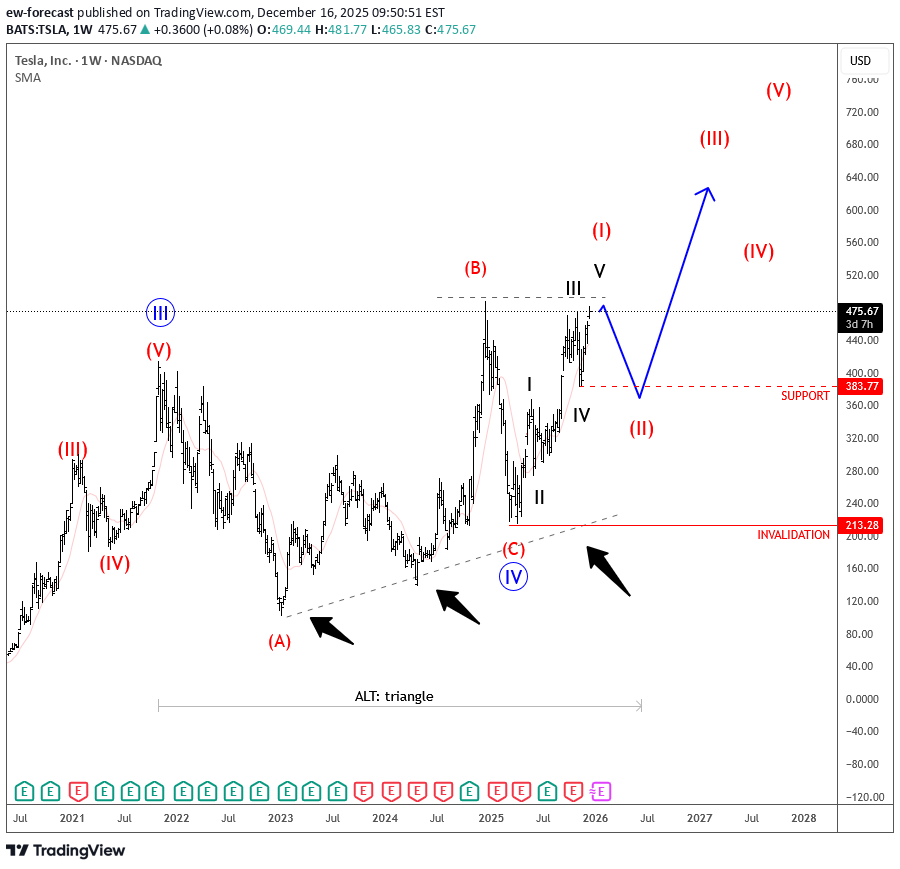
تسلا از ماه مارس امسال در حال افزایش بوده است و اکنون به برخی از سطوح بسیار مهم در حدود 480 نزدیک می شود که بالاترین سطح از حدود یک سال پیش است. آنچه واقعاً در این مرحله اهمیت دارد این است که ما پنج waves از 217 داریم که یک ساختار صعودی بسیار قوی است و نشاندهنده صعود بیشتر در آینده است، زیرا بازار روندی پیشرونده را نشان میدهد. به همین دلیل، میتواند فرصتهای جالبی برای پیوستن به این روند وجود داشته باشد، به خصوص اگر شاهد نوعی اصلاح در سال 2026 باشیم. در این صورت منطقی است که مراقب موج درجه پایینتر قبلی four در حدود 483 باشیم، که میتواند منطقه جذابی برای بازگشت مجدد بعدی باشد. شمارش موج متناوب همچنین اجازه می دهد تا یک مثلث به form در اینجا وجود داشته باشد، که دوباره نشان می دهد که پس از بازگشت به موج E از four، به احتمال زیاد شاهد صعود بیشتر بود. این سناریو تا زمانی که بالاترین سطح دسامبر 2024 نقض نشود، معتبر بود. به طور کلی، بهترین فرصتها میتواند نمایان شود اگر ما یک بازگشت به موج دوم درجه پایینتر داشته باشیم و سپس به دنبال صعود به مرحله قوی بعدی باشیم، در حالی که بازار بالای 213 است. GH
ew-forecast
Dash Is Sitting At The Strong Support Within The Wedge Pattern
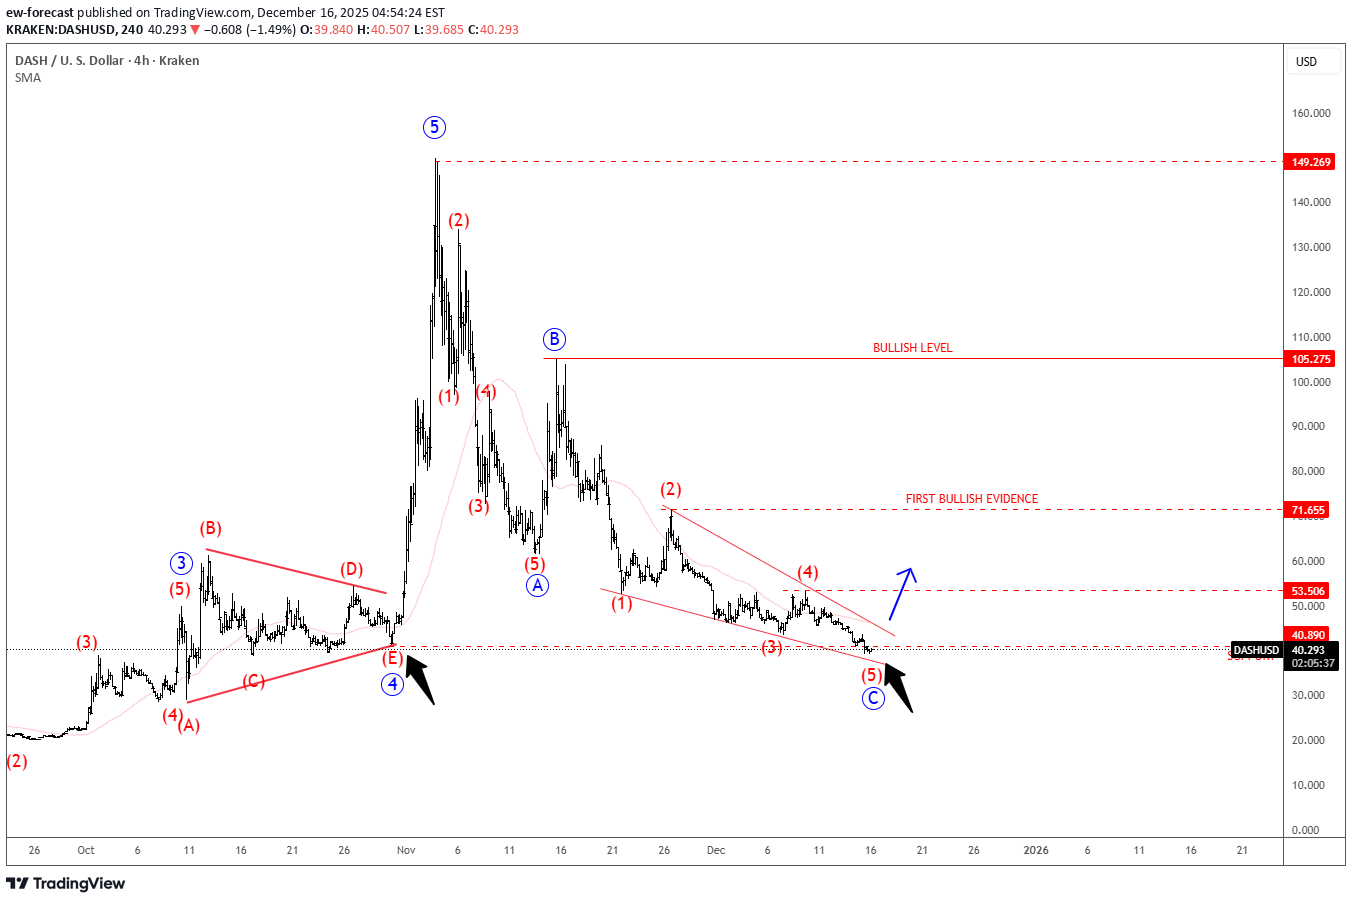
همانطور که قبلاً پیشبینی میشد، Dash صعودی قوی داشت، اما کاهش شدید اخیر نشان میدهد که انگیزه صعودی پنج موجی احتمالاً تکمیل شده است. در نتیجه، اکنون به نظر می رسد که اقدام قیمت در مرحله اصلاحی سه موجی درجه بالاتری قرار دارد. این عقب نشینی به خوبی با ساختار اصلاحی گسترده تر ABC به دنبال پیشروی تکانشی مطابقت دارد. در نمودار 4 ساعته، Dash به نظر می رسد که در موج C این تصحیح درجه بالاتر معامله می شود. علاوه بر این، اقدام قیمت نشان می دهد که بازار ممکن است در مراحل پایانی موج (5) در یک الگوی گوه باشد. این تنظیم اغلب نشان دهنده فرسودگی روند است، به خصوص زمانی که با پشتوانه تاریخی قوی ترکیب شود. در این مورد، منطقه 40 به عنوان یک منطقه پشتیبانی کلیدی که در آن خریداران می توانند عقب نشینی کنند و قیمت را تثبیت کنند، برجسته می شود. با توجه به این ساختار فنی، معامله گران باید نسبت به بازگشت احتمالی و مراحل اولیه یک رالی جدید هوشیار باشند، به خصوص اگر قیمت موفق به بازیابی و حفظ بالاتر از سطح 53.50 شود. با این حال، مهم است که محتاط بمانیم، زیرا اولین شواهد صعودی معنادار فقط در یک شکست بالای ناحیه 71 دیده میشود. سپس یک move قاطع بالای 105 به عنوان تأیید صعودی کامل عمل می کند، و نشان می دهد که ادامه صعودی بزرگتر به بازی بازگشته است. تا زمانی که این سطوح بازیابی شوند، اقدامات قیمت باید به دقت نظارت شود، زیرا ممکن است نوسانات در نزدیکی منطقه حمایت فعلی بالا بماند.
ew-forecast
آیا کوآنت (QNT) در آستانه انفجار قیمتی است؟ پایان الگوی مثلث صعودی!
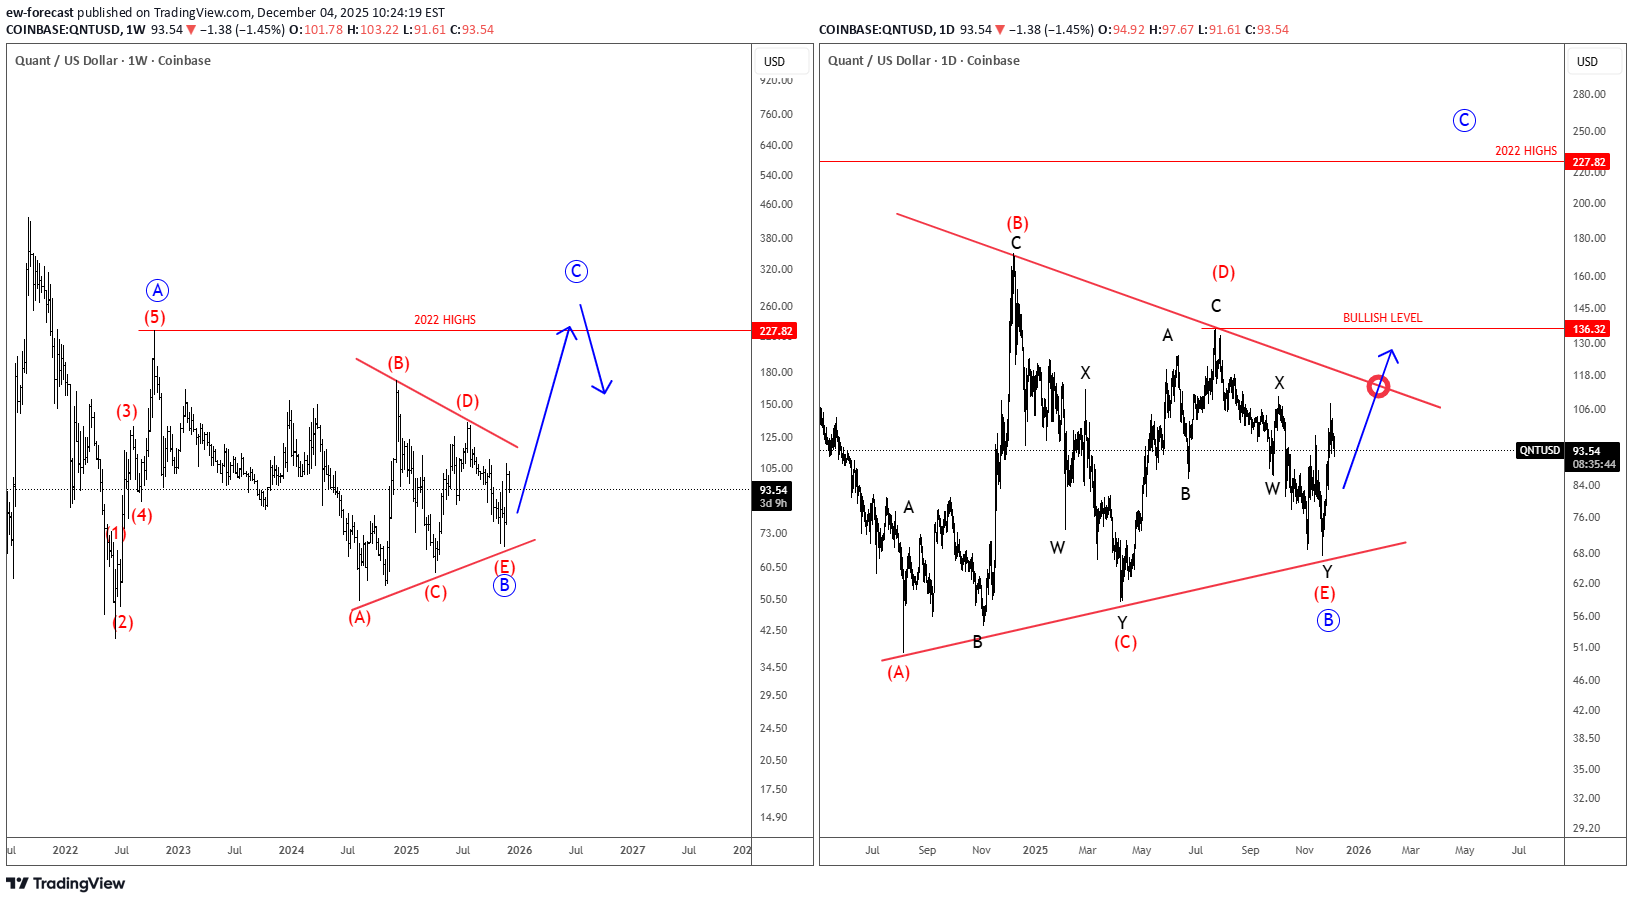
Quant شبکه یک پروژه قابلیت همکاری بلاک چین است که به بلاک چین های مختلف اجازه می دهد با یکدیگر ارتباط برقرار کنند. سیستم عامل آن، Overledger، به توسعهدهندگان و کسبوکارها اجازه میدهد تا اپلیکیشنهایی بسازند که میتوانند همزمان در چندین بلاک چین اجرا شوند. رمز QNT برای دسترسی و پرداخت خدمات Overledger استفاده می شود. Quant با نشانگر QNTUSD همچنان به خوبی بالای خط مثلث پایینی نگه داشته است، بنابراین گاوها هنوز اینجا هستند. به صورت هفتگی، اکنون میتوانیم مشاهده کنیم که یک الگوی مثلث صعودی در موج B را به پایان میرساند، قبل از اینکه ممکن است رالی دیگری برای موج C ببینیم. در نمودار روزانه، ممکن است در واقع یک کاهش پیچیده W-X-Y در موج نهایی (E) B داشته باشد، اما تأیید صعودی برای موج C فقط بالای خط مثلث بالایی و سطح 136 است.
ew-forecast
بیتکوین تا کجا سقوط میکند؟ راز موجهای الیوت و شرط کلیدی 100 هزار دلار
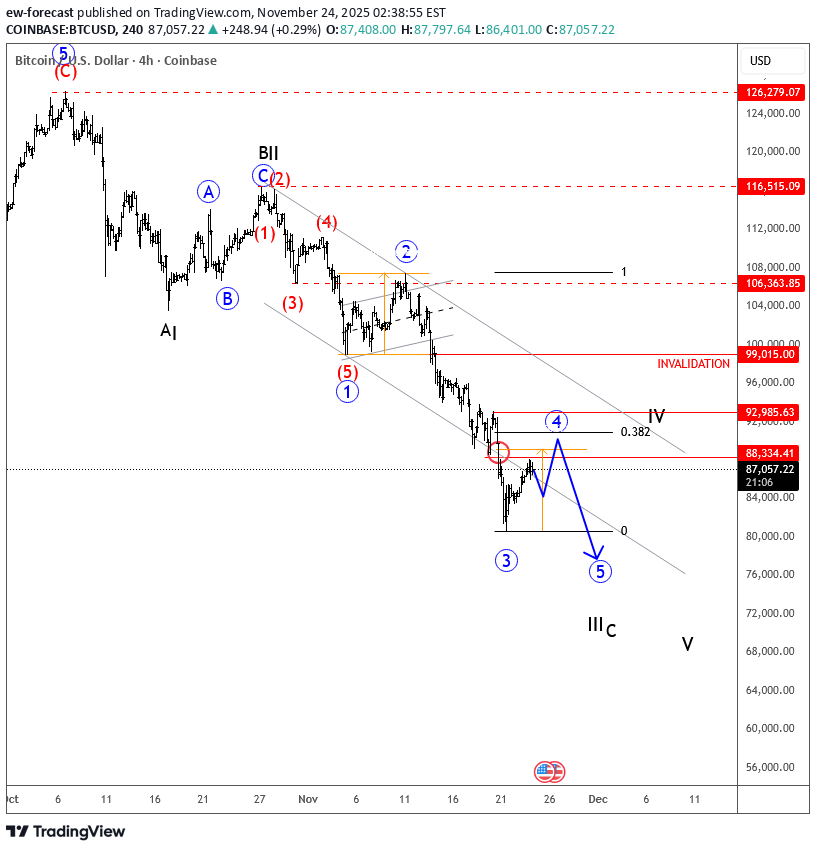
بسیاری از معامله گران در تعجب هستند که چه زمانی Bitcoin عقب نشینی را از اوج ها کامل می کند، اما اگر واقعاً در یک اصلاح با درجه بالاتر هستیم، به خاطر داشته باشید که عقب نشینی های بزرگ در Bitcoin معمولاً حدود 12 ماه طول می کشد و در حال حاضر تنها یک ماه و نیم با اوج های اخیر فاصله داریم. این اولین چیز است. دومین چیز و برای من مهمترین چیز، همیشه خود ساختار موج الیوت است. من به سادگی نمی توانم آن را نادیده بگیرم، زیرا به من کمک می کند تا سطوح کلیدی را شناسایی کنم که قبل از اینکه بتوانیم با اطمینان به دنبال نقطه عطفی باشیم، باید شکسته شوند. اگر به افت قیمت از سطح 116515 دقت کنید، به وضوح میبینید که این کاهش شدید بدون یک دنباله پنج موجی کامل است. بنابراین حتی اگر فرض کنیم این موج C به جای موج چهار است، باز هم باید با پنج ساختار waves باشد. این بدان معناست که بازگشت فعلی از منطقه 80k به راحتی می تواند تنها یک موج چهارم باشد، شاید در حدود 90k متوقف شود، که یک سطح نوسان مهم برای این هفته است. بر اساس Elliott waves و قیمت، این ضعف همچنان می تواند از سر گرفته شود. سطح کلیدی برای یک چرخش صعودی بسیار واضح است: عقب راندن به بالای 99k، یا بهتر بگوییم 100k، که یک محور روانی قوی است. در زیر آن، ما در حالت نزولی با ریسک برای یک افت بیشتر میمانیم.Bitcoin بهطور ناگهانی پایینتر میرود، که به نظر میرسد موج 3 از یک چرخه نزولی پنج موجی در موج C یا III درجه بالاتر است، بنابراین در حالی که قیمت زیر 99 هزار منطقه است، میتوان ضعف بیشتری را مشاهده کرد. پس از عقب نشینی اصلاحی اخیر در موج 4 به ناحیه مقاومت پیش بینی شده، به نظر می رسد که اکنون در موج 5 C/III به سمت ناحیه 80-74k پایین تر است. هر صعود زودهنگام به بالای خط مقاومت کانال و منطقه 99k نشانه ای از وجود پشتیبانی موقت بود.
ew-forecast
هشدار جدی برای بیت کوین: پایان چرخه صعودی و آغاز اصلاح عمیق؟
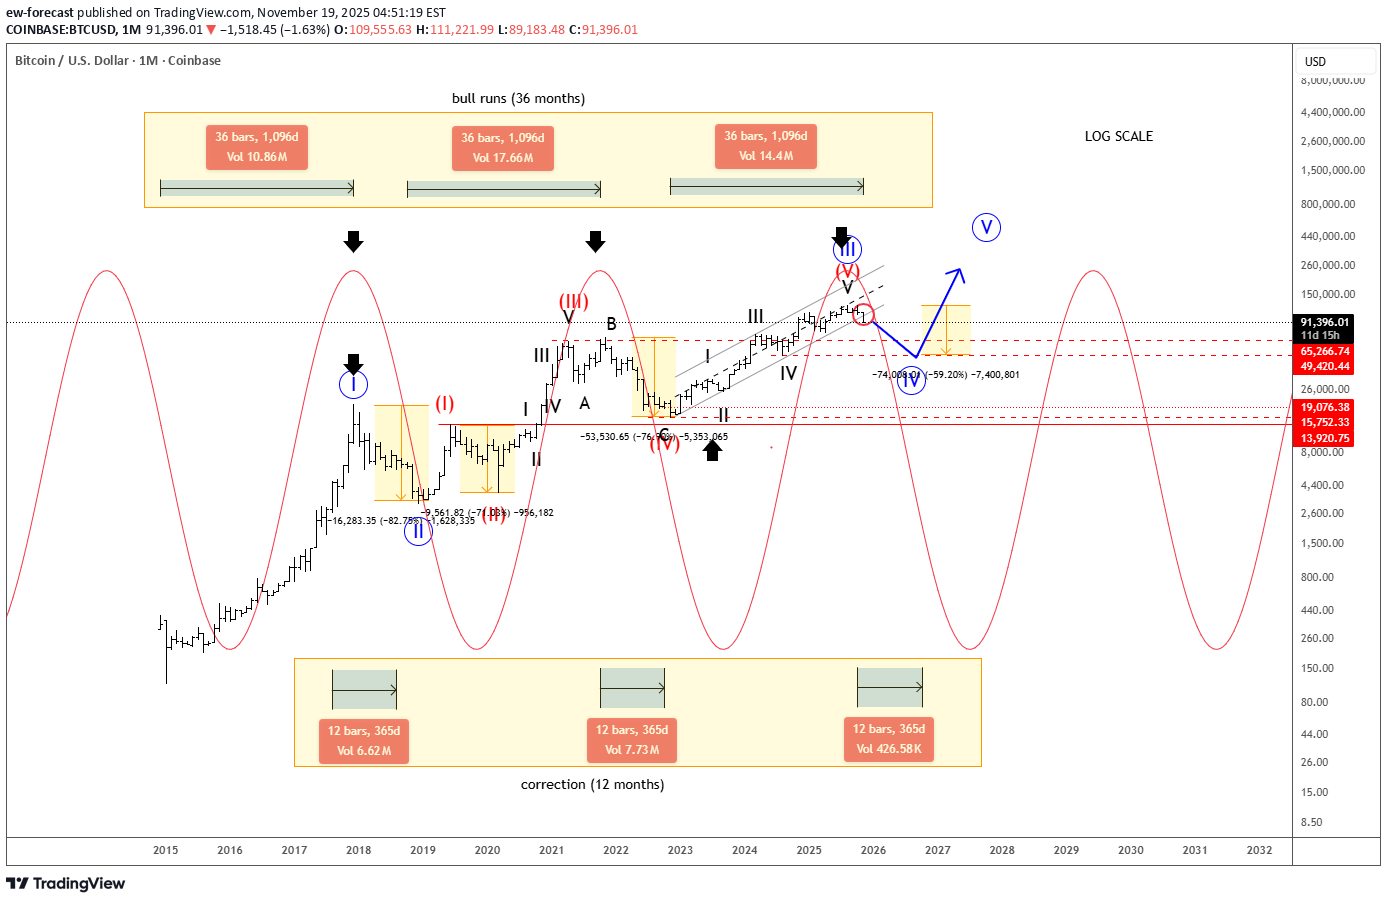
Bitcoin مجدداً به زیر سطح ۱۰۰ هزار دلاری و حمایت کانالی که از کفهای سال ۲۰۲۲ ترسیم شده بود، برگشته است. این نوع رفتار قیمتی حاکی از آن است که ما ممکن است در حال تکمیل چرخه صعودی باشیم که از آن کفها آغاز شد—چرخهای که تقریباً سه سال طول کشید، مشابه فازهای صعودی قبلی بین ژانویه ۲۰۱۵ تا دسامبر ۲۰۱۷ و دسامبر ۲۰۱۸ تا نوامبر ۲۰۲۱. با توجه به این شرایط، اکنون خطر قابل توجهی برای یک اصلاح عمیقتر وجود دارد. از نظر تاریخی، هر چرخه جدید معمولاً عقبنشینیهای درصدی کمعمقتری ایجاد میکند، اما فاز اصلاحی همچنان بخش حیاتی ساختار کلی بازار است. برای کسانی که قصد دارند برای رالی صعودی بعدی major موقعیتگیری کنند، امنتر آن است که صبر کنند تا بازار یک دوره اصلاحی پایدار—که احتمالاً حدود یک سال به طول میانجامد—را طی کند و سپس مطابق با روند کلیتر بازار، مجدداً وارد شوند. از دیدگاه امواج الیوت، Bitcoin احتمالاً یک حرکت (ایمپالس) پنجموجی را درون موج (V) از III در درجه بالاتر به پایان رسانده است. این موضوع با این ایده همخوانی دارد که یک اصلاح موج IV در درجه بالاتر ممکن است در حال شکلگیری باشد. همچنین، از منظر چرخهای، به نظر میرسد بازار در اکتبر ۲۰۲۵ سقف خود را ثبت کرده است، که این امر احتمال ورود به فاز بازار نزولی را تقویت میکند. به طور خلاصه، Bitcoin اکنون ممکن است از یک پیشروی چندساله به یک دوره اصلاحی ساختاری مهم در حال انتقال باشد؛ دورهای که میتواند مبنای سالمتری را برای چرخه گسترشی بعدی major فراهم کند.
ew-forecast
تحلیل تکنیکال MSTR: ریزش تا کجای حمایت؟ پیشبینی موج الیوت و چرخه زمانی
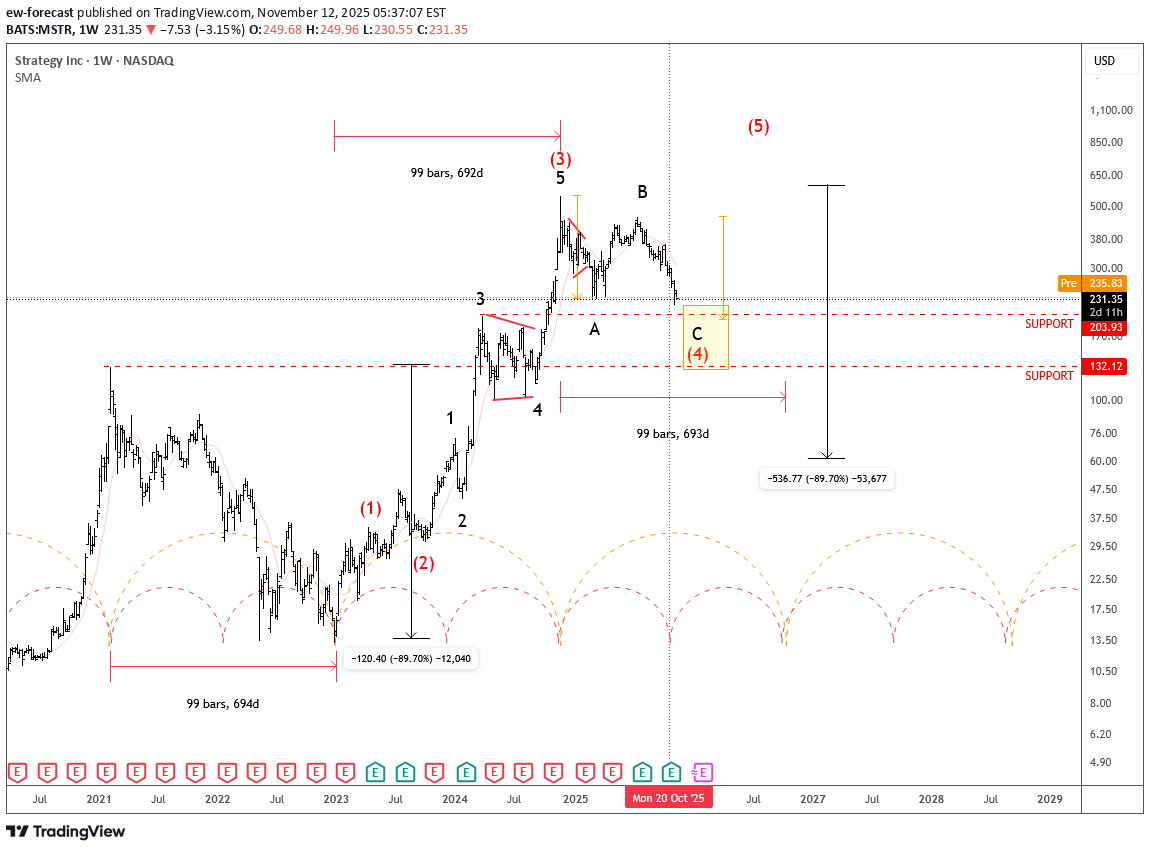
مایکرواستراتژی از زمان ثبت کفهای دسامبر ۲۰۲۲ یک روند صعودی قوی را تجربه کرده است، اما در طول سال گذشته، بازار در فاز اصلاحی (Retracement) قرار داشته است. به نظر میرسد این یک عقبنشینی A-B-C دیگر در داخل یک موج چهارم با درجه بالاتر باشد، جایی که ریزموج C به طور بالقوه میتواند منطقه ۲۰۰ را مجدداً آزمایش کند، یا حتی تا حمایت عمیقتر ۱۳۲ گسترش یابد. این سطح همچنین با سقف فوریه ۲۰۲۱ همتراز است، که آن را به یک محدوده حیاتی برای رصد تبدیل میکند. از منظر چرخهای، ما در حال حاضر در میانه یک چرخه کامل قرار داریم؛ این امر نشان میدهد که اصلاح میتواند وارد نیمه دوم خود شده باشد و ممکن است ظرف چند ماه آینده به پایان برسد. در حالت ایدهآل، میتوانیم در سال ۲۰۲۶ شاهد یک صعود جدید باشیم که روند صعودی گستردهتر را ادامه دهد. خلاصهبندی: روند: پولبک اصلاحی در موج چهارم حمایت: ۲۰۰ / ۱۳۲ نمای چرخهای: میانه چرخه؛ احتمال جهش جدید اوایل ۲۰۲۶ نکته: ساختار در یک دنباله صعودی گستردهتر پنجموجی میگنجد و روند بلندمدت قوی همچنان دستنخورده باقی مانده است. GH
ew-forecast
اگر فدرال رزرو متوقف شود، طلا هم متوقف میشود: چه زمانی برای خرید طلا صبر کنیم؟
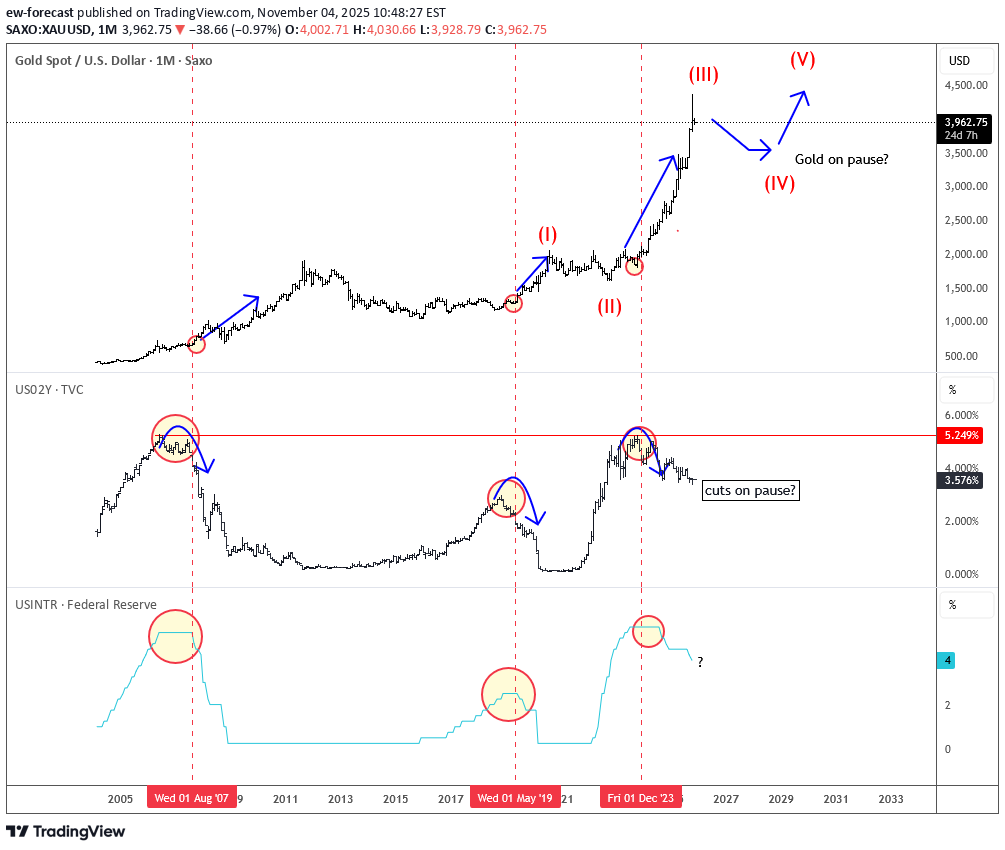
همانطور که احتمالاً متوجه شدهاید، طلا در هفتههای اخیر شاهد یک برگشت شدید بوده است و اکنون بسیاری از معاملهگران و سرمایهگذاران در این فکرند که آیا این اصلاح سریع و کمعمق بود یا طولانیتر میشود. از دیدگاه امواج الیوت، به نظر میرسد طلا ممکن است تلاش کند تا یک موج سوم کشیده را تکمیل کند و توقف در موج چهار را در دستور کار قرار دهد. اما چه چیزی میتواند باعث یک عقبنشینی شود؟ خب، ما باید سیاست پولی ایالات متحده را در نظر بگیریم. پاول هفته گذشته بازارها را در مورد کاهشهای بیشتر نرخ بهره در ماه دسامبر متقاعد نکرد. بنابراین، اگر نرخها برای چند ماه آینده یا حتی طولانیتر ثابت بمانند، ممکن است طلا همچنان در حالت توقف باقی بماند. طلا معمولاً زمانی راحتتر رشد میکند که انتظارات برای کاهش نرخ بهره افزایش یابد، نه کاهش. بنابراین، هم از منظر کلان (ماکرو) و هم از منظر امواج، این وضعیت احتمالاً به عنوان یک اصلاح موج چهارم با درجه بالاتر در نظر گرفته میشود. به طور کلی، این اصلاح میتواند طولانیتر شود و زمانی که قیمتهای عمیقتر، خریداران دیرهنگام و موقعیتهای ضعیفتر را حذف کنند — احتمالاً در ماههای آینده — آن زمان است که احتمالاً اطمینان بیشتری برای فراخوانی مرحله صعودی بعدی داشت، که ایدهآل در اوایل سال ۲۰۲۶ بود. پس به دنبال خرید هستید؟ صبور باشید! گرگا
ew-forecast
صعود انفجاری انویدیا: آیا قله ۲۳۰ در دسترس است؟ تحلیل موجی و نقاط ورود طلایی!
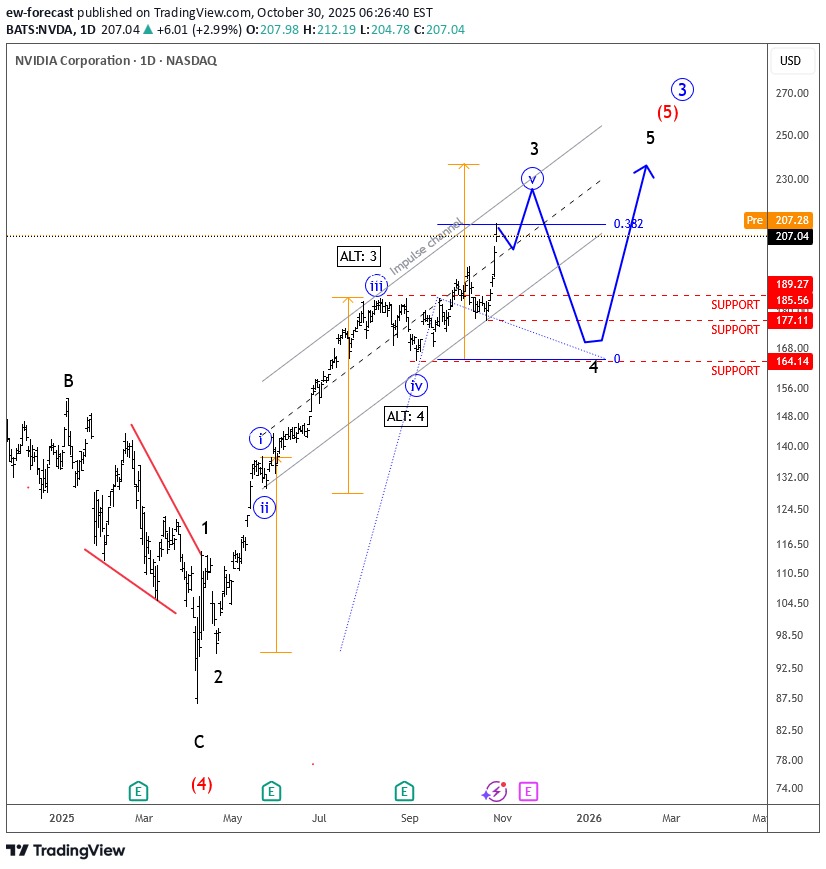
انویدیا در این هفته روند صعودی بیشتری را طی میکند و اکنون بالای سطح 200 در optimism معامله میشود که ایالات متحده و چین میتوانند به توافق تعرفهای دست یابند. از دیدگاه موج الیوت، به نظر میرسد که سهام همچنان در موج پنج قرار دارد، با موج سیاه با درجه بالاتر توسعه یافته سه که اکنون به اولین مقاومت خود در حدود 38.2 درصد نزدیک میشود. اگر احساس ریسک ادامه یابد، قیمت ممکن است حتی قسمت بالای کانال موج الیوت نزدیک به ناحیه 230 را دوباره آزمایش کند. این نشان میدهد که انویدیا میتواند وارد یک منطقه مهم شود که در آن موج سیاه درجه سه ممکن است تکمیل شود، و بعداً یک اصلاح عمیقتر در موج چهارم پیش از از سرگیری روند صعودی بیشتر انجام شود. بنابراین، من صبور میمانم و به محض شروع موج four، شیب احتمالی به سمت ناحیه 164-185 را تماشا میکنم. نکات برجسته: روند: روند صعودی مداوم. موج پنج هنوز در حال انجام است پتانسیل: رسیدن به مقاومت 230 قبل از بازگشت موج four پشتیبانی: منطقه 164–185 ابطال: زیر 164 توجه: مراقب علائم خستگی در نزدیکی 230 باشید. بعدی deep می تواند فرصت جدیدی ارائه دهد
ew-forecast
اصلاح قیمت کاسپا پس از جهش بزرگ: آیا فرصت خرید جدیدی در راه است؟
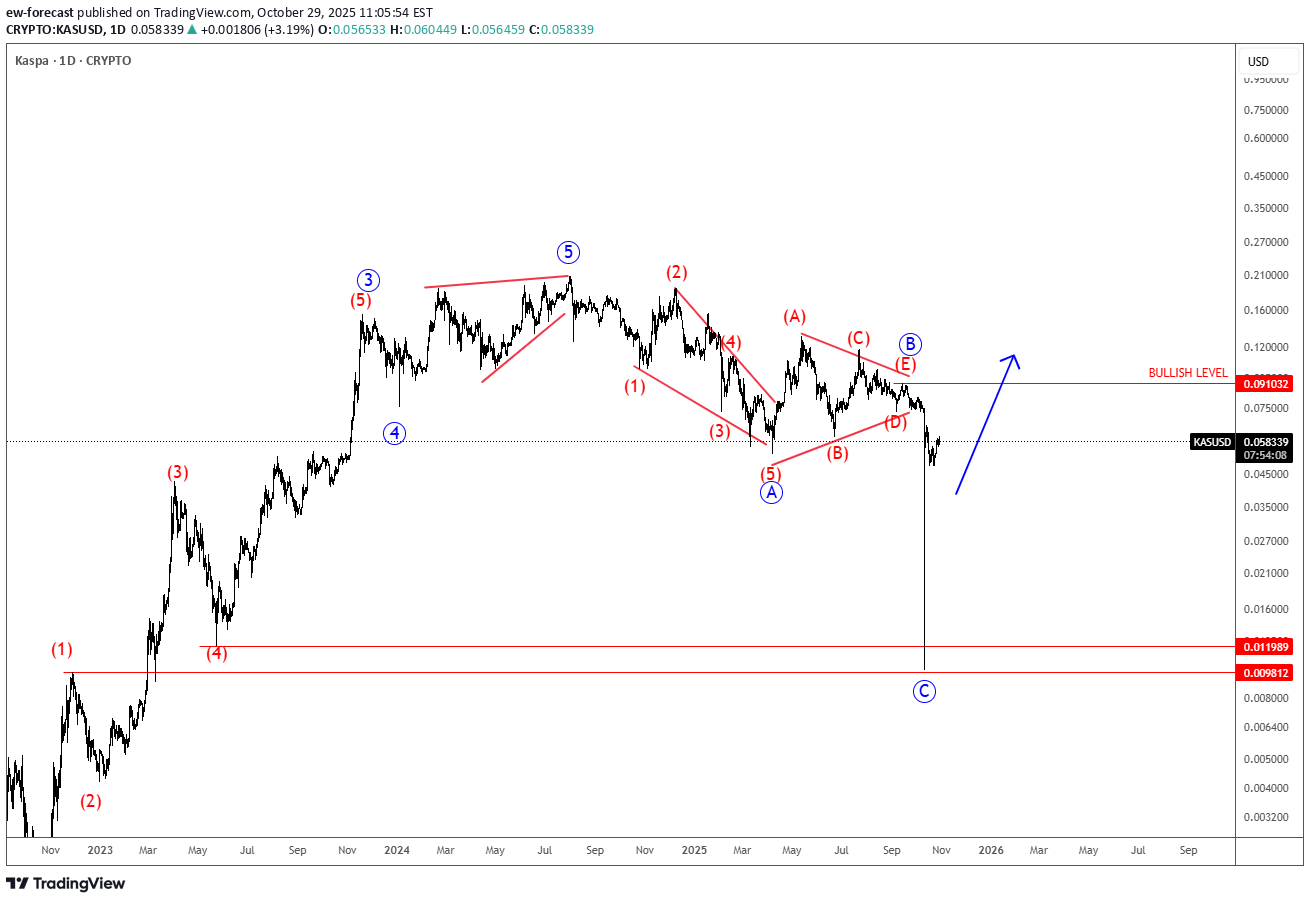
[0] اصلاحی را پس از یک اوجگیری بزرگ به پایان میرساند که میتواند به عنوان حمایت عمل کند، زیرا طبق تئوری امواج الیوت، ما ساختار اصلاحی را در درون روند صعودی میبینیم. [1] یک ارز دیجیتال با الگوریتم اثبات کار (PoW) است که از پروتکل جدید GHOSTDAG استفاده میکند (یک اجماع بلاک-دگ به جای یک زنجیره [2] تکی) تا امکان تولید سریعتر و همزیستی بلوکهای زیادی را فراهم کند. این پروژه بدون عرضه اولیه سکه (ICO) / پیشتولید (عرضه عادلانه) راهاندازی شد و خود را نسبت به بسیاری از زنجیرههای PoW، مقیاسپذیرتر معرفی میکند. به همین دلیل، توجهات را به عنوان یک جایگزین "PoW نسل بعدی" یا "زنجیره سریع" جلب کرده است. ریزش قیمت کَسپا (Kaspa) به نظر ترکیبی از تسویه پوزیشنهای خرید اهرمی است که یک [3] نزولی را تشدید میکند، احساسات ضعیف کلان/آلتکوین و ریسکهای ساختاری (پذیرش/تمرکز عرضه) است. با وجود افت شدید قیمت که ترس و بدبینی را در سراسر بازار برانگیخت، چنین عقبنشینیهای [4] اغلب فرصت ایجاد میکنند نه اینکه سیگنال شکست باشند. با وجود نوسانات، اصول بنیادی کَسپا همچنان قوی مانده است. فناوری نوآورانه GHOSTDAG، عرضه عادلانه و فعالیت قوی شبکه آن همچنان آن را متمایز میکند. زمانی که ترس حاکم میشود و احساسات بیش از حد منفی میگردد، در واقع میتواند یک چیدمان حمایتی برای سرمایهگذاران بلندمدتی باشد که به دنبال انباشت پروژههای باکیفیت در سطوح تخفیفخورده هستند. از منظر امواج الیوت، جفت ارز KASUSD([5]) از الگوی مثلث موج B به سمت موج C سقوط کرد، بنابراین این یک اصلاح ABC با درجه بالاتر است. این پروژه همچنان برای آینده امیدوارکننده به نظر میرسد و ممکن است ما همچنان شاهد مقداری رالی در چرخه صعودی فعلی باشیم. تأییدیه صعودی بالای محدوده 0.091 است.
سلب مسئولیت
هر محتوا و مطالب مندرج در سایت و کانالهای رسمی ارتباطی سهمتو، جمعبندی نظرات و تحلیلهای شخصی و غیر تعهد آور بوده و هیچگونه توصیهای مبنی بر خرید، فروش، ورود و یا خروج از بازارهای مالی نمی باشد. همچنین کلیه اخبار و تحلیلهای مندرج در سایت و کانالها، صرفا بازنشر اطلاعات از منابع رسمی و غیر رسمی داخلی و خارجی است و بدیهی است استفاده کنندگان محتوای مذکور، مسئول پیگیری و حصول اطمینان از اصالت و درستی مطالب هستند. از این رو ضمن سلب مسئولیت اعلام میدارد مسئولیت هرنوع تصمیم گیری و اقدام و سود و زیان احتمالی در بازار سرمایه و ارز دیجیتال، با شخص معامله گر است.